Landlord Ledger
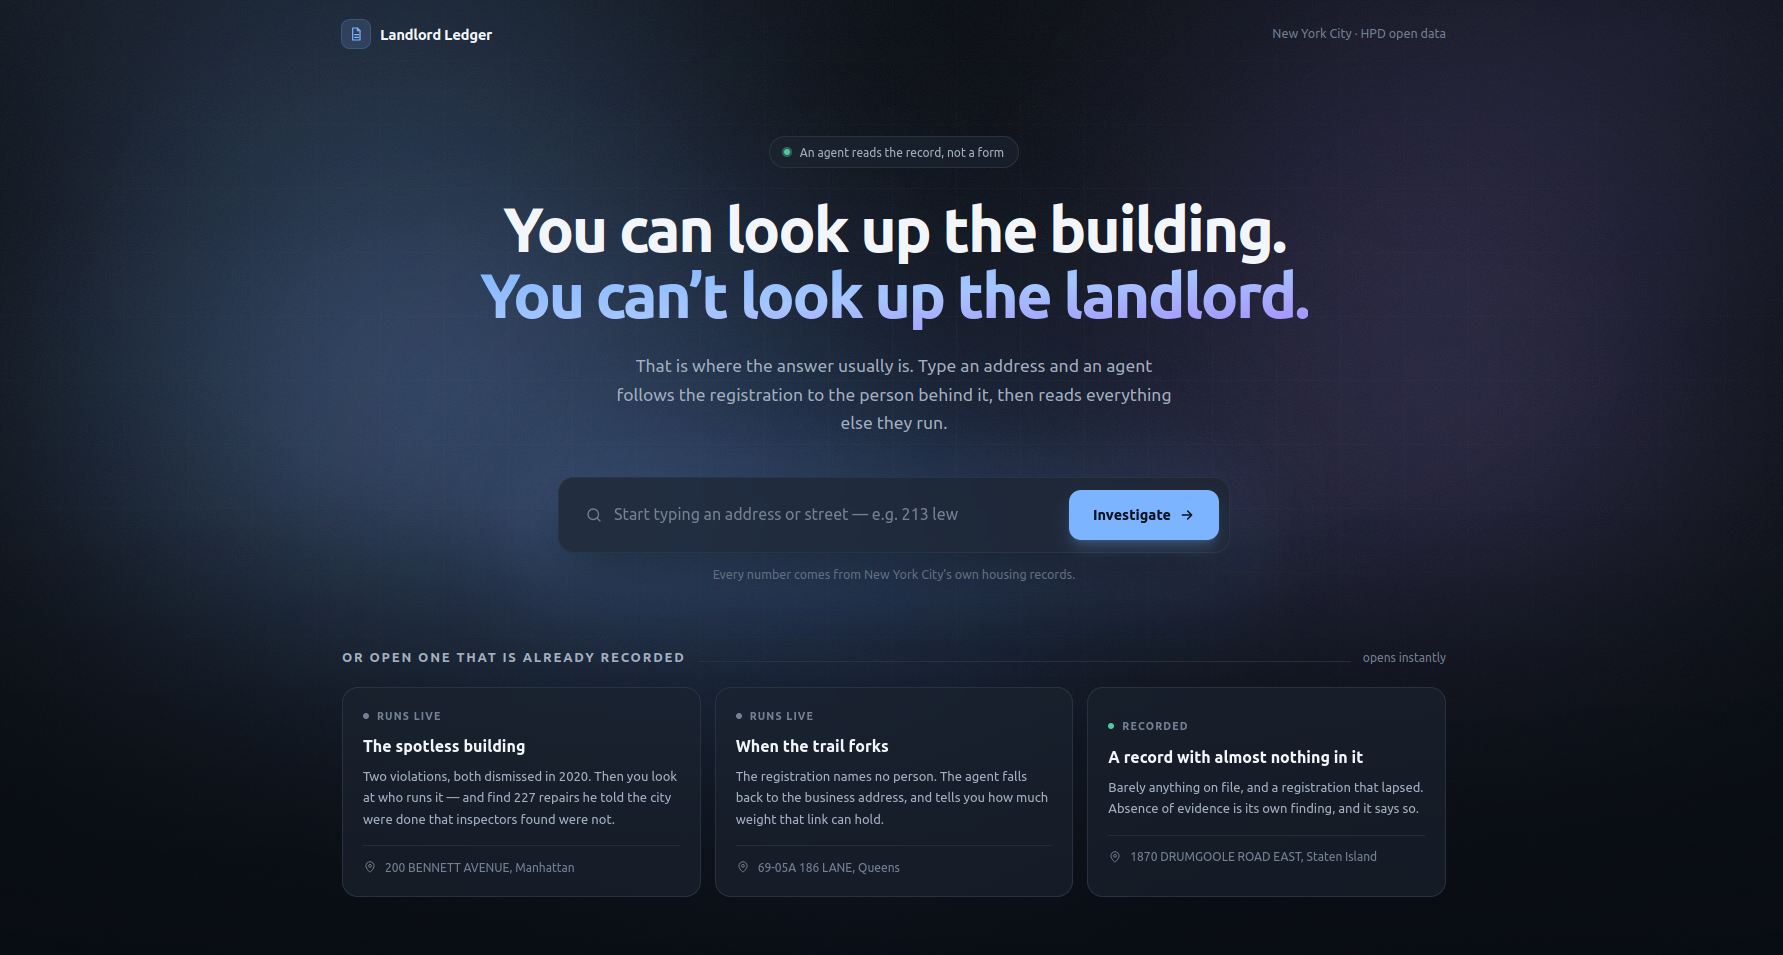
Before you sign a lease in New York you can look up the building. You cannot easily look up the landlord, and that is where the answer usually is.
Inspiration
You check an address, find two violations from 2020, both closed, and conclude it is fine.
200 Bennett Avenue looks exactly like that. Spotless. The landlord named on its HPD registration operates thirty-eight other buildings, and across that portfolio, 227 times he told the city a repair was done and an inspector went back and found it was not.
None of that is hidden. It is sitting in NYC Open Data, joinable only if you know the link from a building to a person runs through a registration ID and a contact type spelled HeadOfficer with no space. The asymmetry in a housing lease is not secrecy, it is a schema. So the thesis of this project is that the building is not the unit of analysis, the operator is, and the hop from address to owner is the product.
What it does
You type an address, say a little about your situation (a toddler, asthma, a December move-in), and an agent investigates.
- It goes to the owner unprompted. It follows the HPD registration to the head officer named on it, falls back to the business address when there is no person, and shows the trail as the chain of records it is, including how strong that link is.
- It writes its own queries. Given a database schema and read-only SQL over 7.2 million violations, it decides what to ask. There are no canned lookups, because a library of
get_violations_for_buildingis a pipeline in costume. - It grades the evidence. An open violation usually means nobody certified a repair, not that an inspector confirmed anything. Every violation is bucketed by status into caught misreporting, inspector confirmed, could not get in, or never re-inspected. 333 Central Park West has 16 open violations and exactly one the city ever went back to check, and the page says 6% verified instead of quoting 16.
- It ranks, rather than counting. "23 open violations" means nothing to a renter. "More unfixed problems than 91% of every building in New York" lands immediately.
- The portfolio grid is the argument in one picture. One square per building the owner runs, coloured by whether anything is open, yours ringed in blue. At 200 Bennett your square is green and 33 of the other 37 are red.
- Your situation reorders the findings, it never hides one. Mold is reported to a renter with no asthma and lead to a renter with no kids. A persona controls what leads, never what is included.
- It ends in actions, not a verdict. Three to six things to ask, inspect, document, or do if refused, each tied to a number in the record. "Ask about the heat" is worthless. "Ask why order 672 has been open since January 2015, and who holds the key to the heating system" tells the landlord you have read their file.
How I built it
NYC Open Data into a 1.76 GB SQLite file (7.2M class B and C violations, 203,884 registrations, 760,453 contacts), a LangGraph loop driving Claude Opus 5, FastAPI streaming the agent's events over SSE, and one hand-written index.html with SVG charts and no build step.
SQLite because a run fires 15 to 40 queries and every network round trip is a demo that dies on conference wifi. The Anthropic SDK called directly rather than through a wrapper, because the trace panel needs the raw event stream. Prompt caching on two breakpoints serves 85 to 93% of input from cache, taking a run from $2.25 to $0.63. A /facts endpoint answers from pure SQLite in 60 ms so the dashboard is painted before the agent's first query returns.
Model choice was measured. Sonnet 5 was 2.5x cheaper and wrote good findings, but on a 532-building portfolio it enumerated, hit the row cap, and kept reasoning over a truncated result. Opus aggregated throughout. That behaviour is the product.
Challenges I ran into
The dataset produces errors that render rather than throw. registrationid is not unique, so declaring it a primary key silently overwrites real buildings. One registration can carry 1,448 address rows, so aggregating across that join turned an owner's 23 falsified certifications into 1,388. Violation descriptions are sampled examples that still carry the sample's apartment number, and reading them literally invents specific, checkable, wrong claims about someone's future home.
Then the agent caught one I had not. Mid-investigation it wrote a correction against its own earlier findings: zero of the 409,000 violations issued citywide between 2008 and 2018 were marked closed. It was right, my ingest had filtered them out, and every landlord holding older buildings was reading as negligent. An agent that audits the ground it is standing on is the difference between an investigator and a report generator.
What's next
Ownership links across name variants and shell entities, 311 data to find the buildings where nobody calls, and eviction filings joined to the same operator.
Built solo in a day. LangGraph, Claude Opus 5, FastAPI, SQLite, vanilla JS. ~4,400 lines across 11 files.
Built With
- claude
- fastapi
- html
- nyc-open-data
- python
- react
- sqlite
- tailwind

Log in or sign up for Devpost to join the conversation.