-
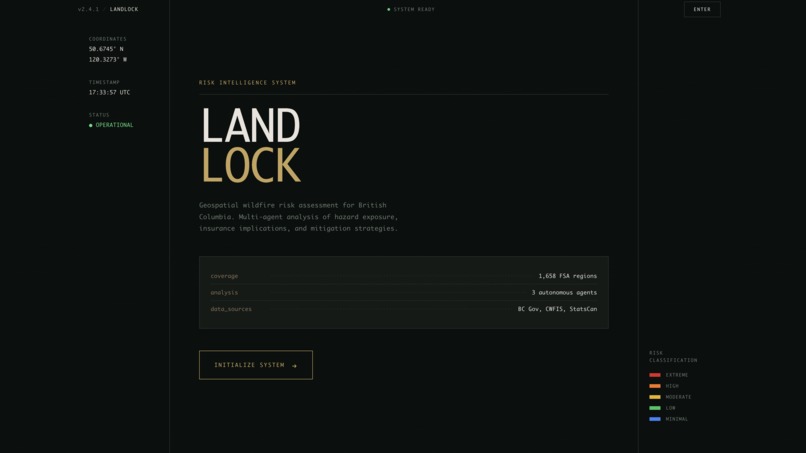
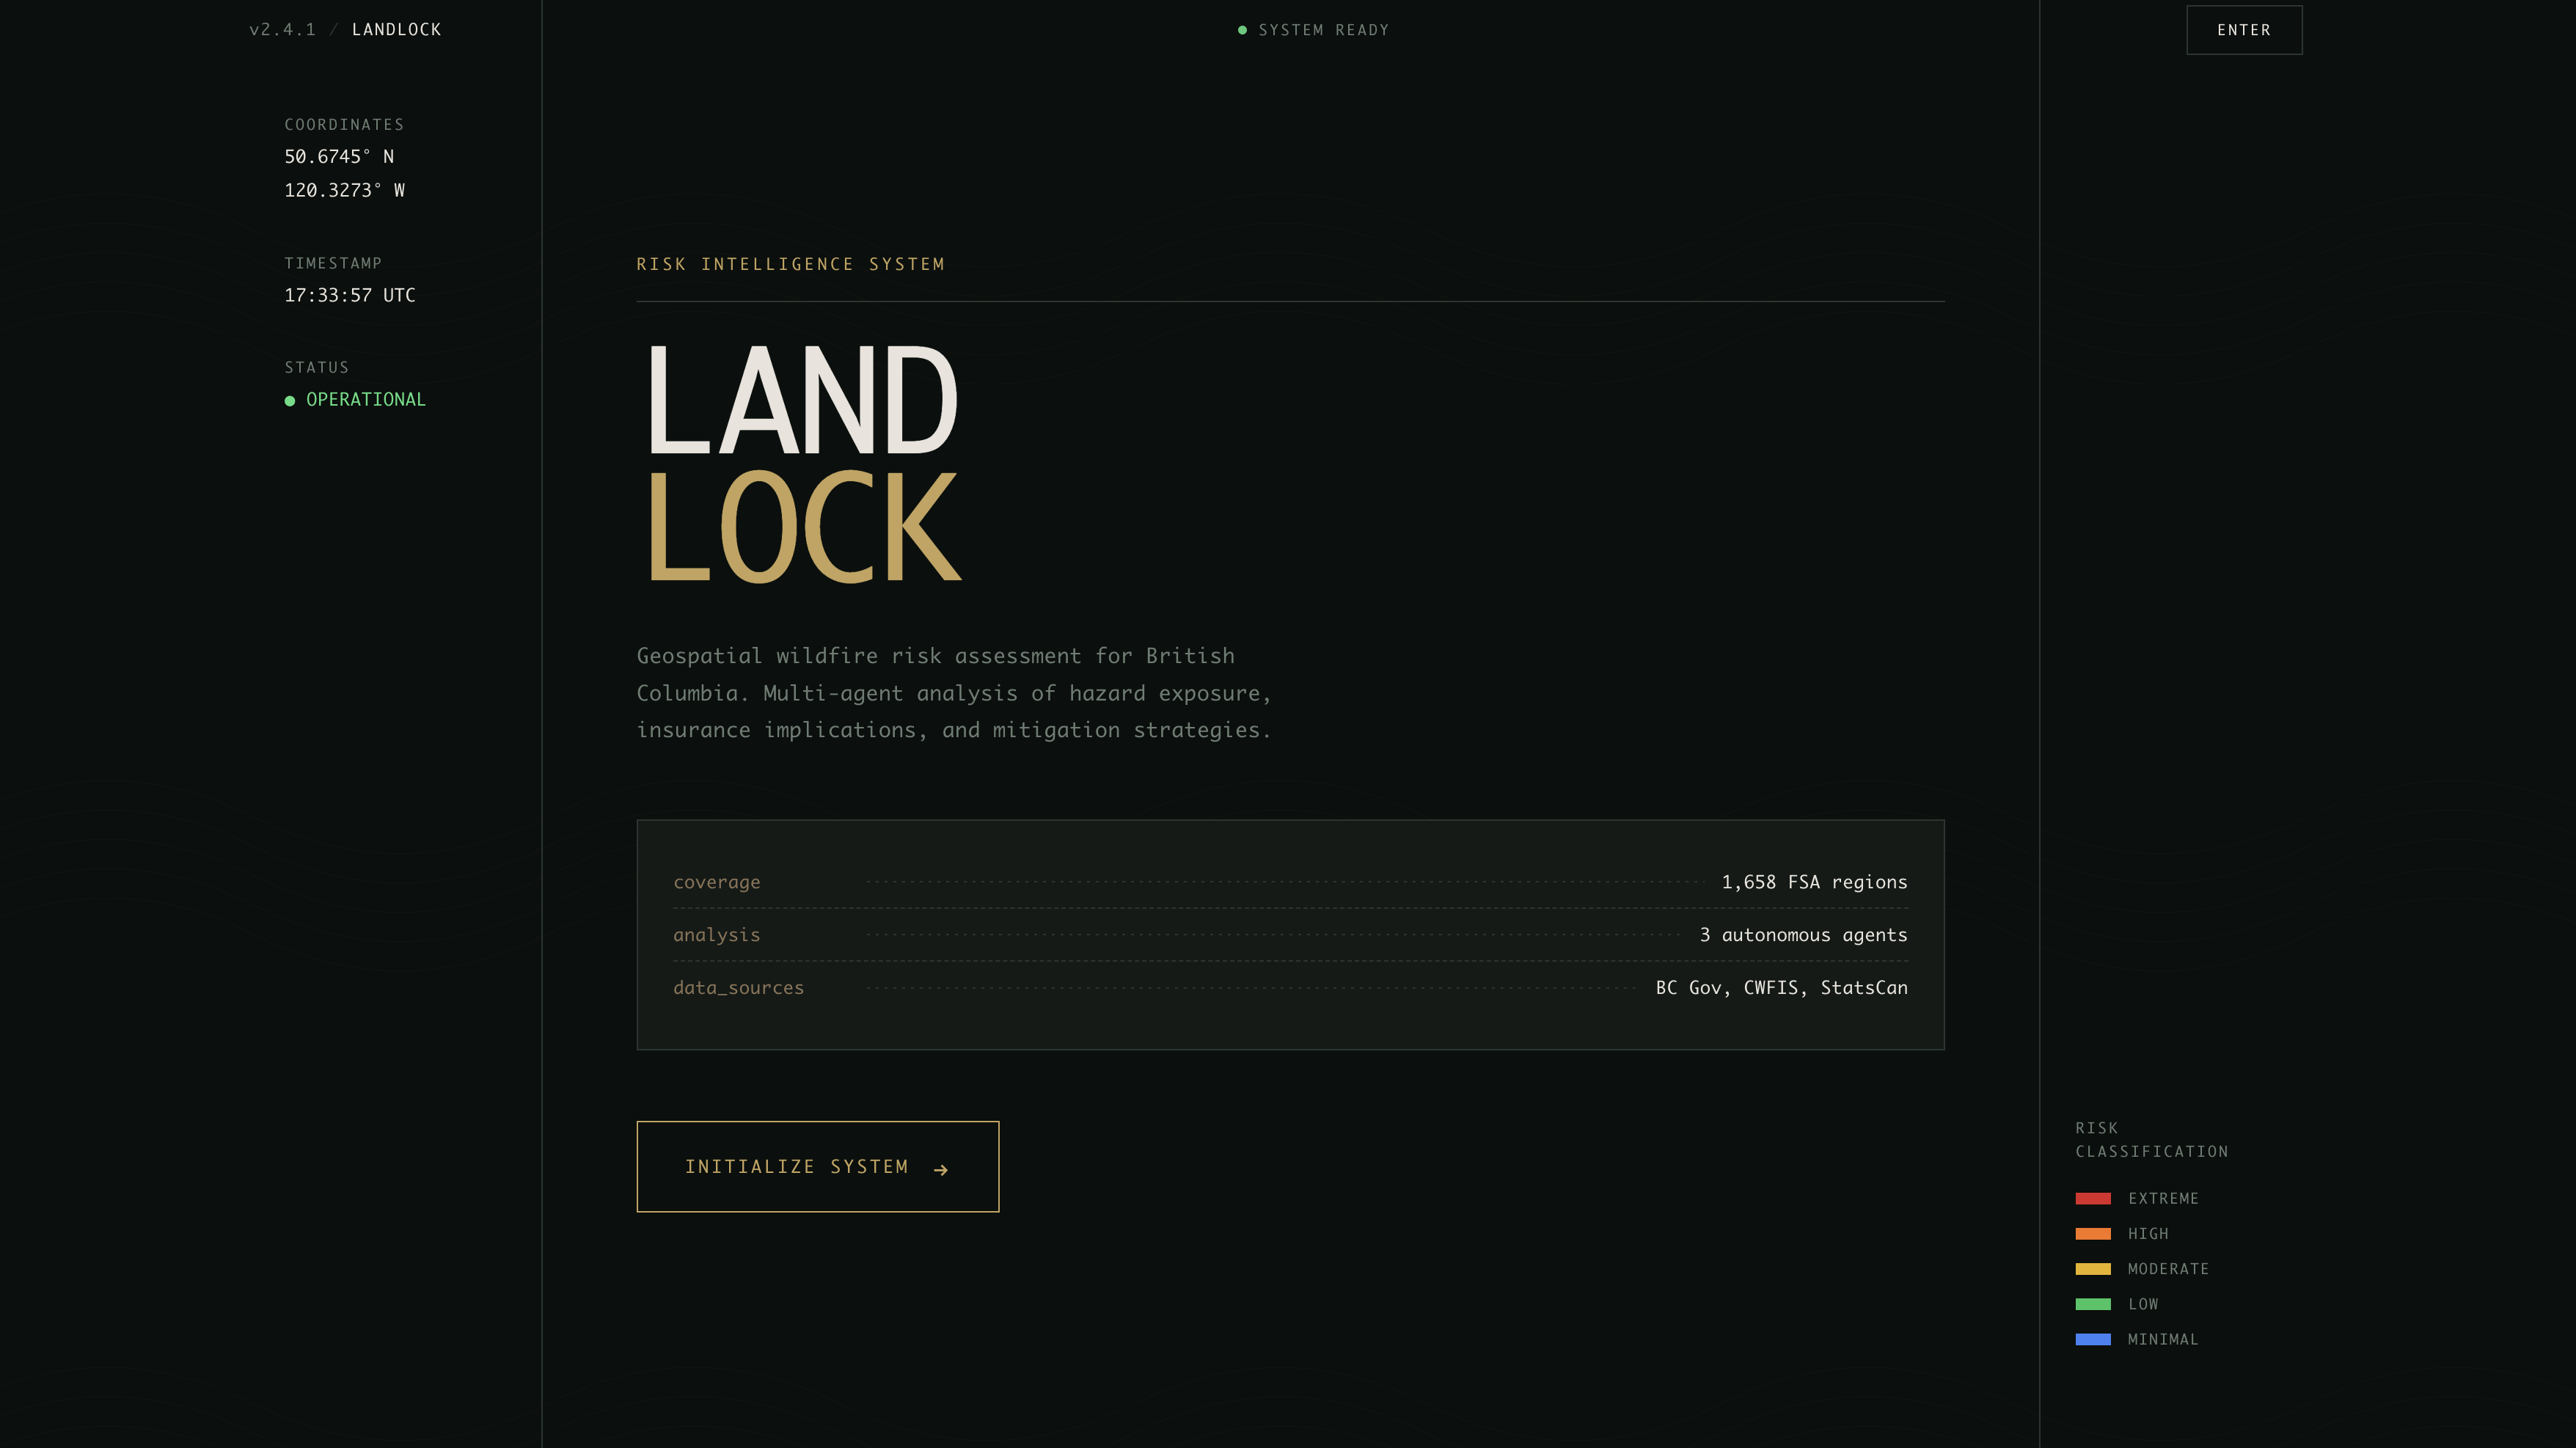
home page
-

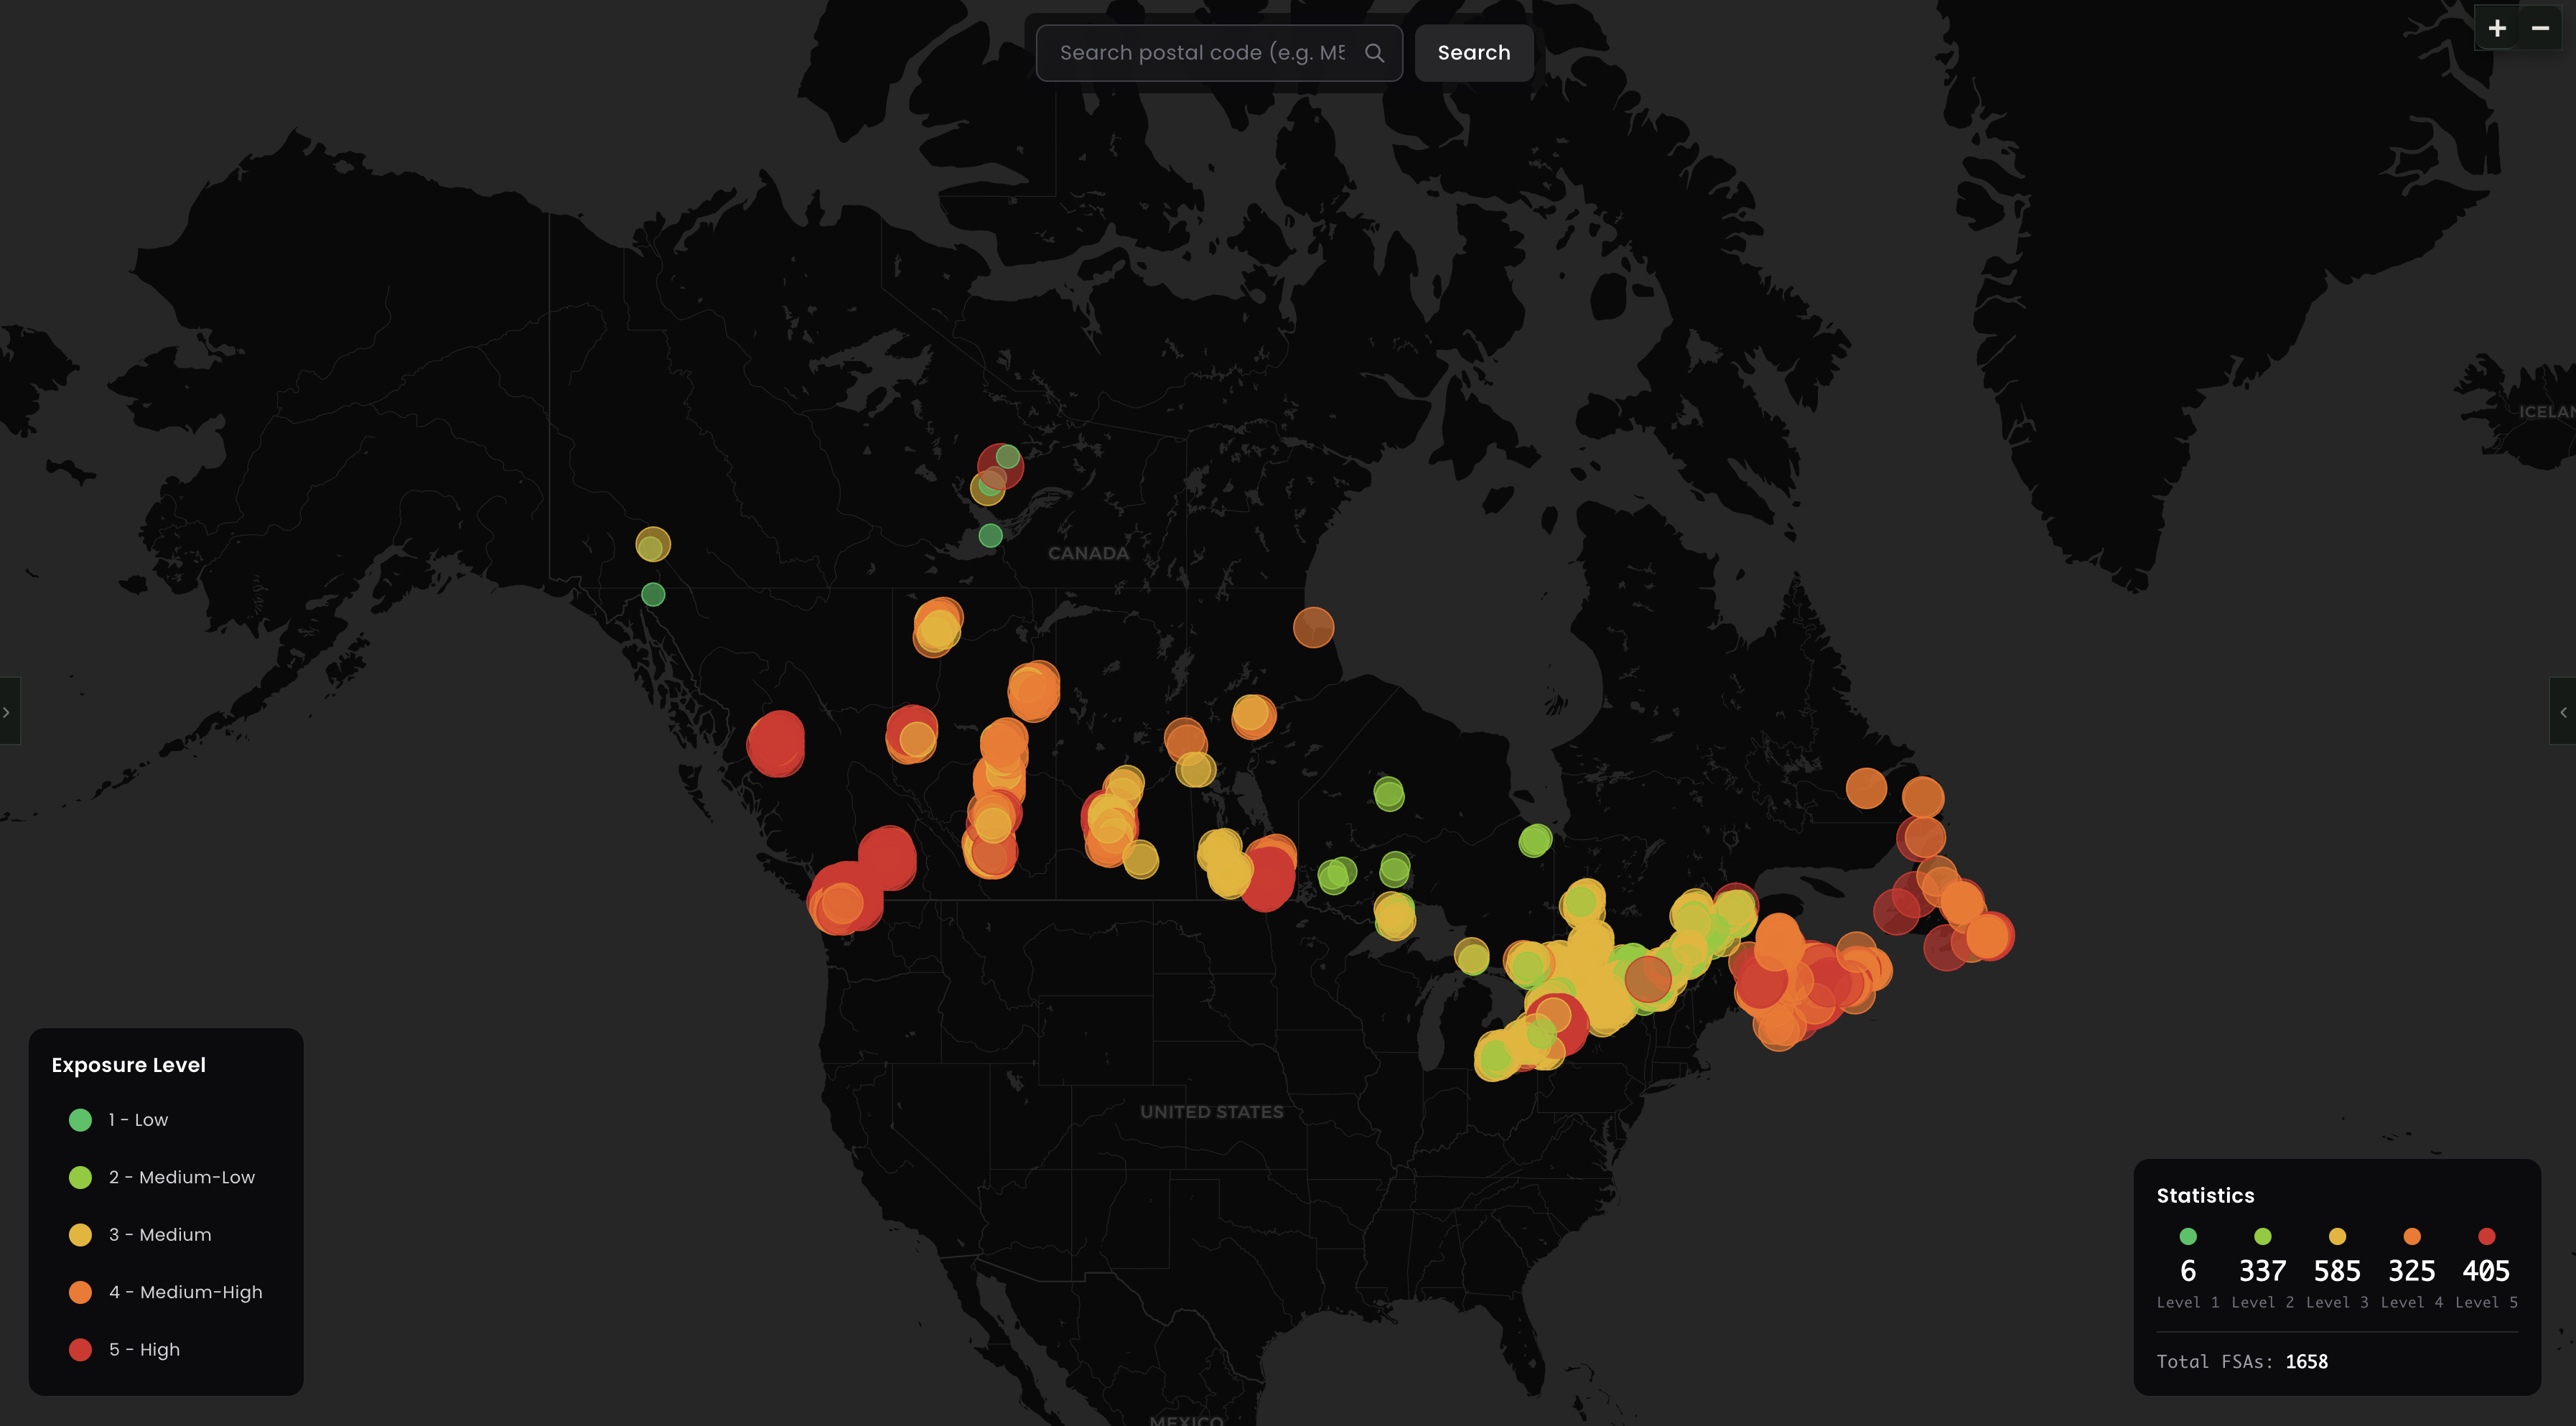
natural disaster risk heatmap
-
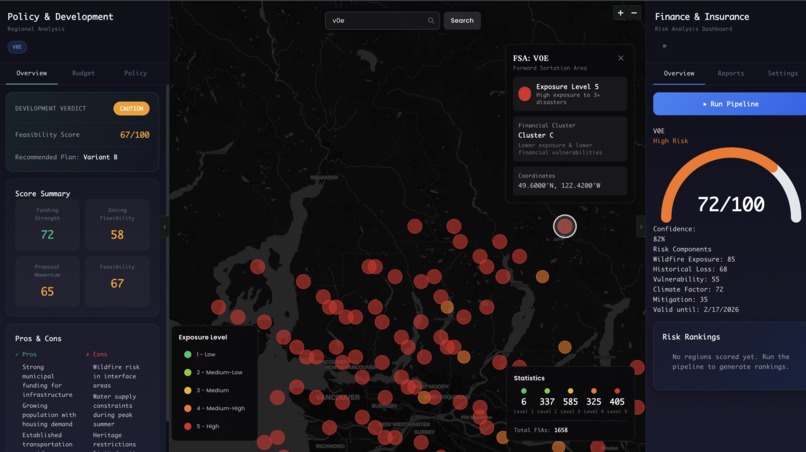
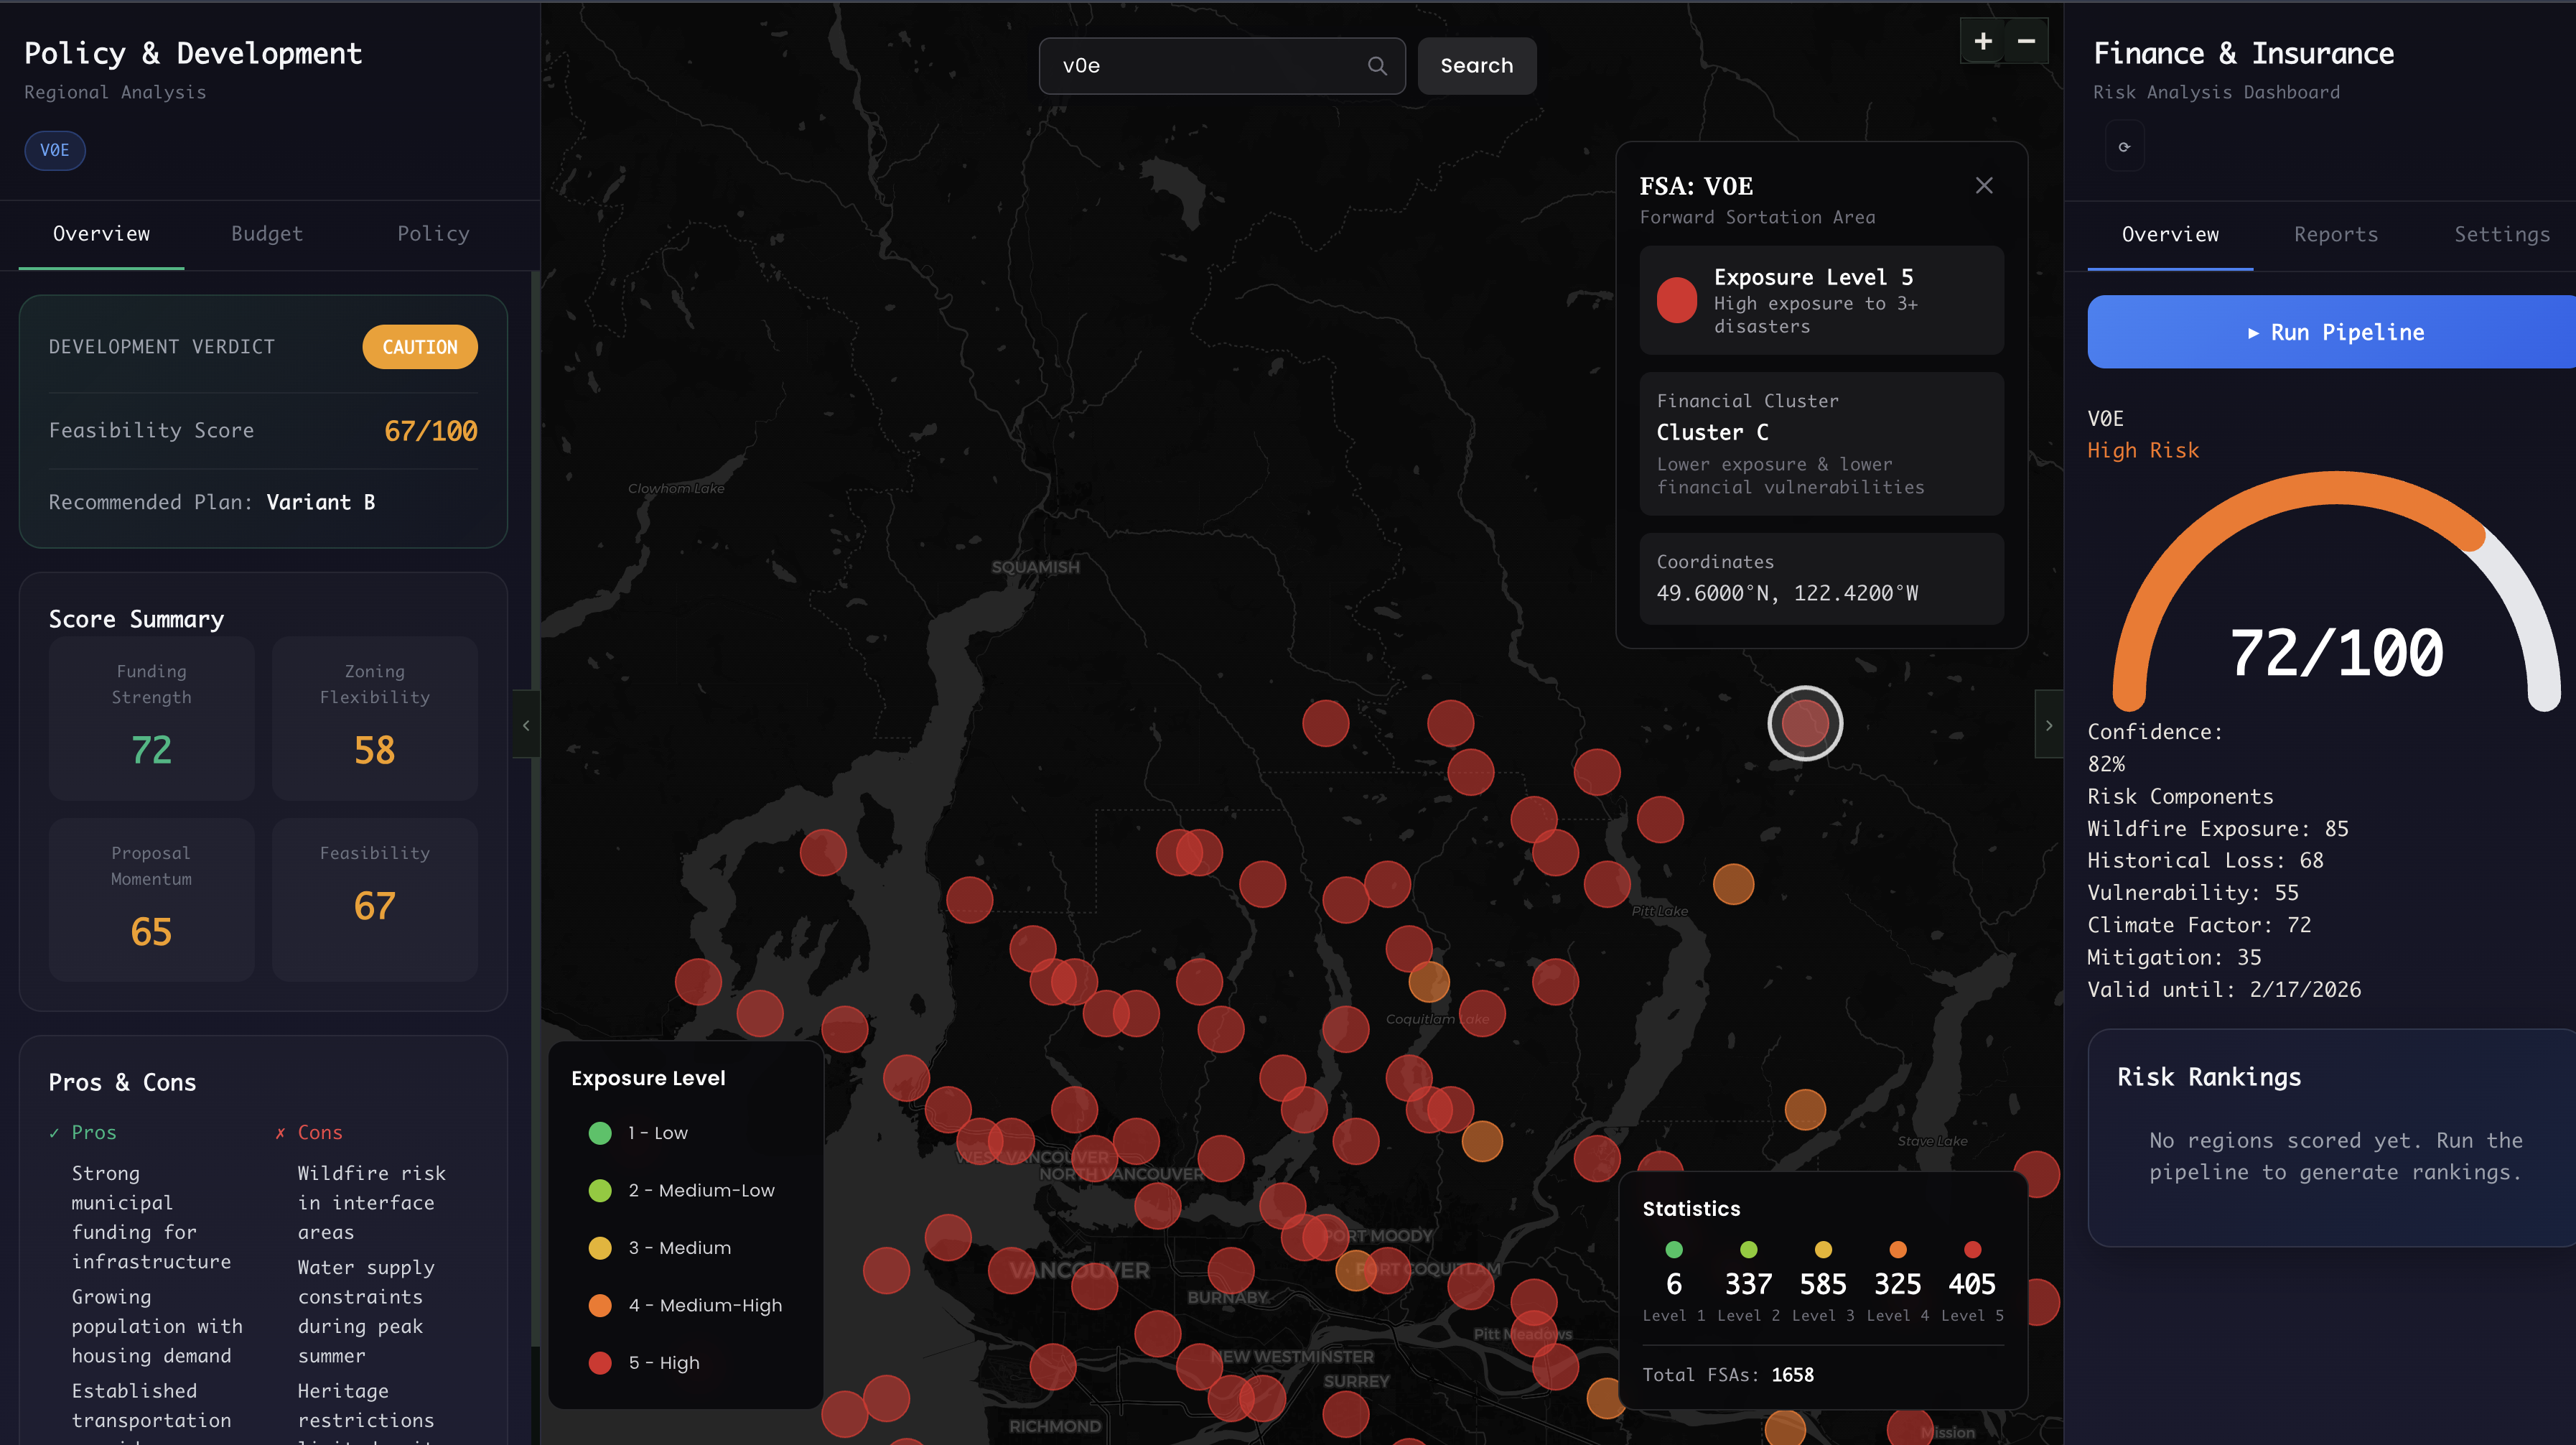
risk analyzer agent results
-
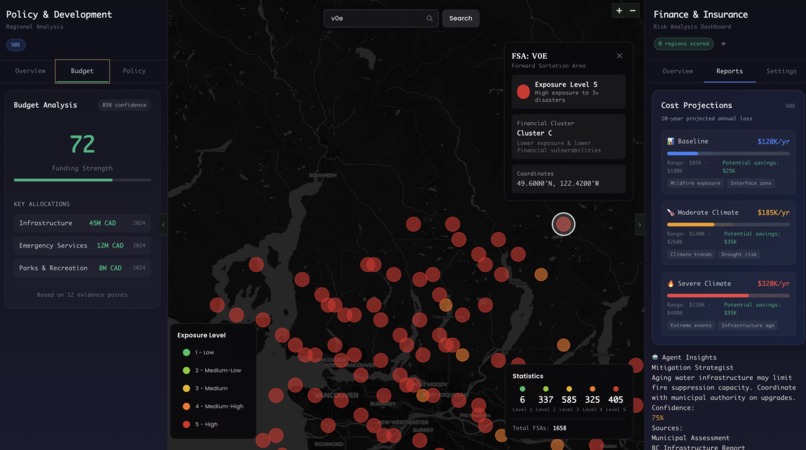
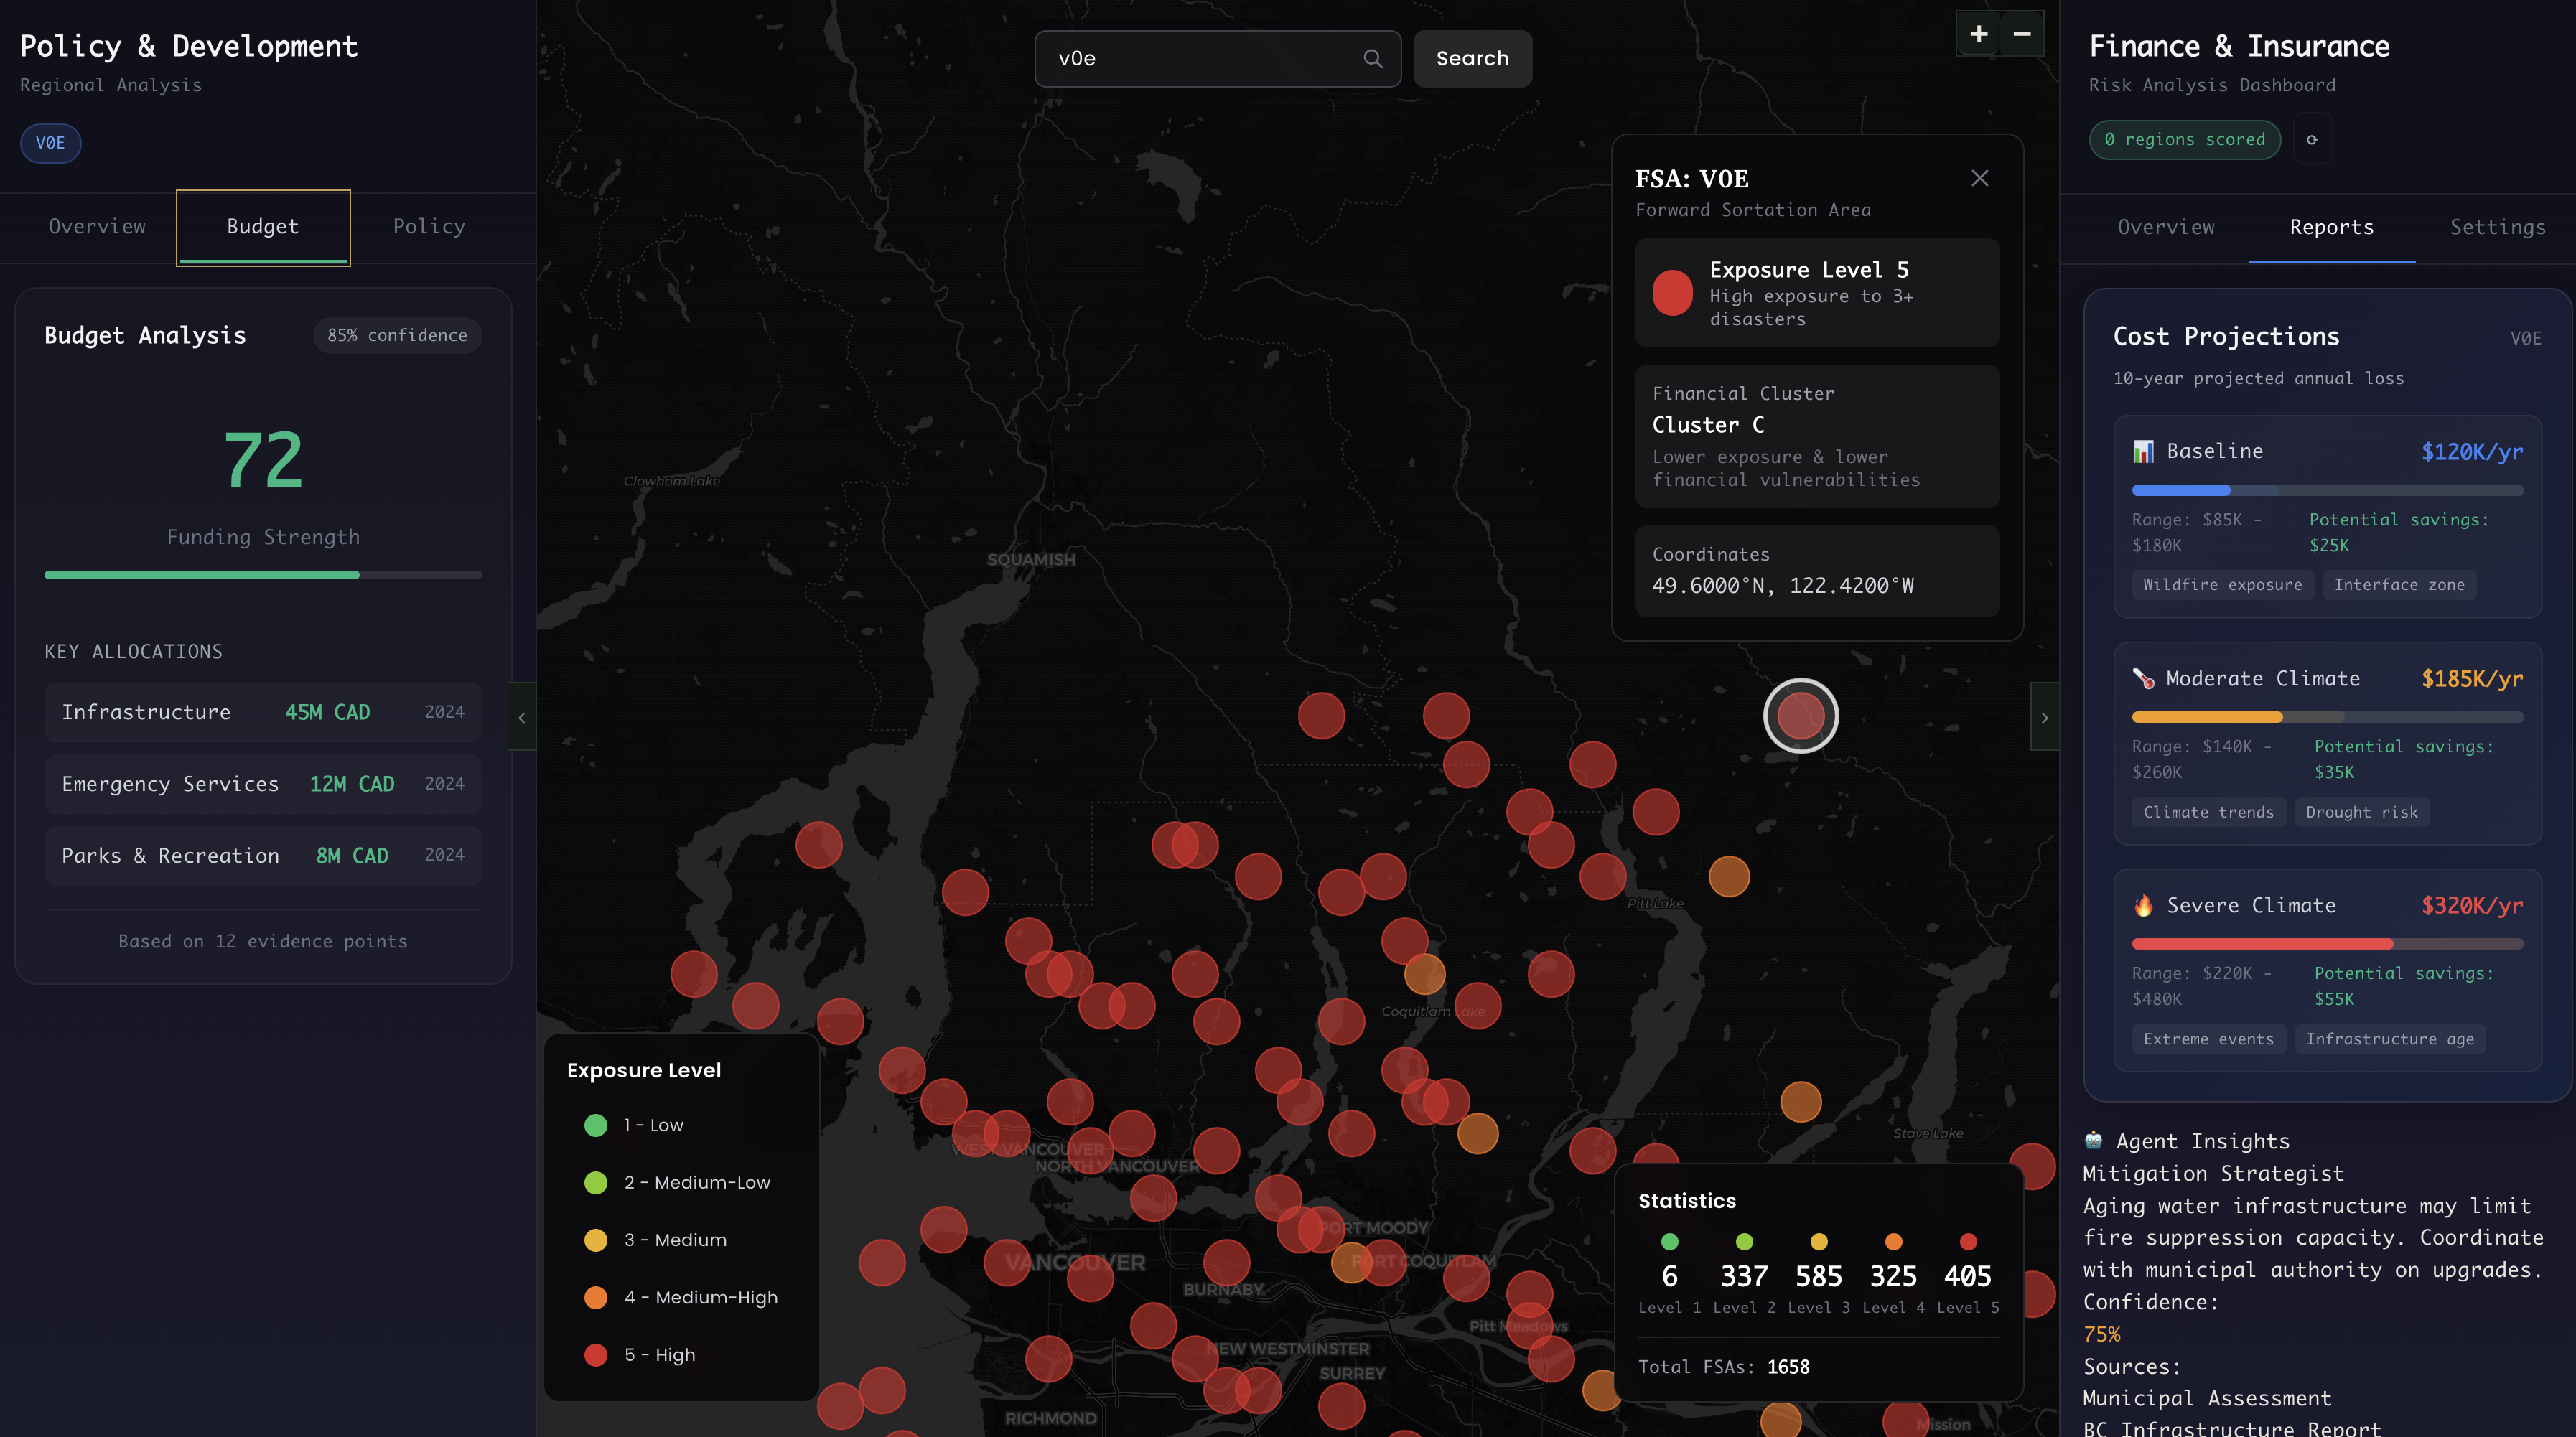
cost projections + budget analysis agent results
-
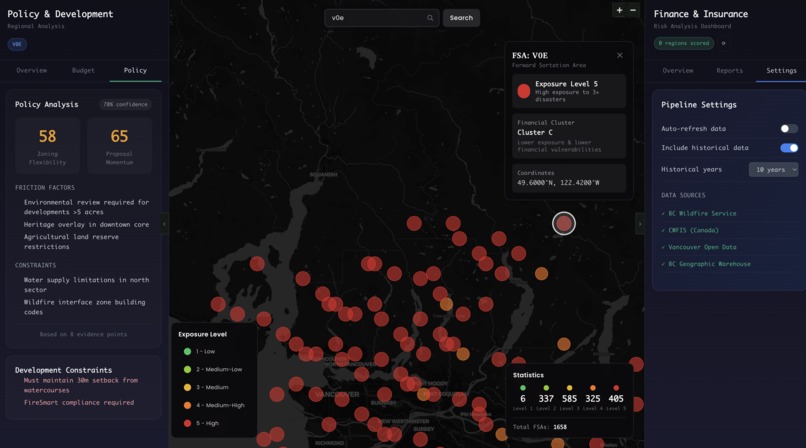
policy analyzer + pipeline settings

💡 Inspiration
Identity isn’t just who you are, it’s where you belong.
For most people, identity starts with a home: a place tied to safety, stability, and the future they imagine for themselves. But as climate risk accelerates, that identity is increasingly fragile. In 2024 alone, over 4,500 people in British Columbia were displaced by wildfires, losing not just housing, but a sense of permanence and belonging.
At the same time, cities continue to approve development in wildfire-exposed regions using fragmented, inaccessible data: zoning bylaws buried in decade-old PDFs, budgets that signal intent but are never connected to risk, and hazard maps that don’t translate into real financial consequences.
We asked a simple question: How can someone build an identity, a home, a community, or even a future, if the systems deciding where we build don’t understand risk holistically?
LandLock was built to answer that.
What it does
LandLock is an AI-powered land risk intelligence platform that helps people make informed decisions about where to live, build, and insure.
🏠 For Homebuyers
- Translates wildfire, climate, and insurance risk into clear 0–100 scores
- Reveals long-term safety and affordability risks before purchase
- Helps buyers understand not just if a place is risky, but why
🏗️ For Developers
- Identifies where development is viable and where risk is too high
- Connects zoning rules, municipal intent, and wildfire exposure
- Shows how mitigation strategies can reduce financial and insurance risk
🏦 For Insurers and Policymakers
- Provides consistent, data-driven regional risk assessments
- Supports premium optimization, underwriting, and planning decisions
- Links climate risk directly to financial and recovery outcomes
The platform features an interactive map with regional risk rankings across British Columbia, paired with AI-generated insights that explain the key drivers of risk. Users can explore climate and disaster scenarios with financial impact projections, exposure maps, and mitigation options.
🛠 How we built it
- Frontend: React + TypeScript + Tailwind CSS + Next.js for a responsive and interactive map-based UI.
- Mapping: Mapbox for real-time interactive mapping of risk and mitigation data.
- Backend: Python + FastAPI to handle data ingestion, processing, and AI orchestration.
- Multi-Agent Orchestration: CrewAI + LangGraph for managing agent workflows and shared state.
- AI & NLP: 3 rule-based TypeScript agents with optional OpenAI GPT-4 integration for insights.
- Data Integration & Parsing: Beautiful Soup for scraping and parsing unstructured public datasets, combined with 20+ BC government and public datasets for zoning, wildfire, climate, and insurance data.
⏱ Challenges we ran into
A lot of the challenge was not building agents but dealing with broken public data. City budgets, zoning bylaws, and development proposals come in different formats, reference regions inconsistently, and assume prior knowledge. Aligning everything for a single area took far longer than expected.
Another challenge was deciding how much information to show. Risk, wildfire, and zoning data are complex, and dumping raw numbers does not help users. We focused on what people actually need to understand if building in a region makes sense.
We also needed to ensure trust in the outputs. Conclusions could influence real decisions about where people live, so we added checks to hide anything unsupported by data. This slowed us down but made the results more reliable and accurate.
🏆 Accomplishments that we're proud of
We are proud of building multiple AI agents that learn and work together, integrating data from many sources into a simple, visual experience supported by clean data pipelines. The platform turned raw public data into clear business and strategy insights that end users can easily follow and understand. We were able to rank hazards, recovery projections, implement a geospatial heatmap, and generate risk reports.
For the majority of us, this was our first experience building AI agents that collaborate effectively, and the first time we all used Crew AI to orchestrate them. Most importantly, we turned public data that exists but isn’t usable into something people can actually reason with.
🌱 What we learned
We learned pretty quickly that identity is tied to stability, and stability depends on decisions most people never get to see. Where cities invest, what they restrict, and how risky an area actually is all shape where communities form or fall apart.
On the technical side, we learned how to implement mapbox, orchestrate agents, and create many platform unit tests that ensure that we are not hallucinating and spreading misinformation. More than anything, this project taught us that building tools around housing and risk comes with responsibility. If a system is going to influence decisions about homes and communities, it has to prioritize clarity, caution, and sustainability over speed or flashiness
🚀 What's next for LandLock
Next, we plan to expand LandLock beyond British Columbia by integrating more comprehensive natural disaster datasets, including floods and extreme heat. We also want to incorporate real-time insurance and climate data directly from users and partners.
Future features include project-level development simulations, premium optimization tools, and scenario visualization. We want to try using generative video models to visualize how homes and communities look under different risk and mitigation outcomes.
Long-term, our goal is for LandLock to become the go-to platform for understanding land risk, guiding development strategy, and aligning insurance with climate reality.
Built With
- beautiful-soup
- crewai
- esri
- fastapi
- jest
- langgraph
- pytest
- python
- react
- typescript


Log in or sign up for Devpost to join the conversation.