-
-
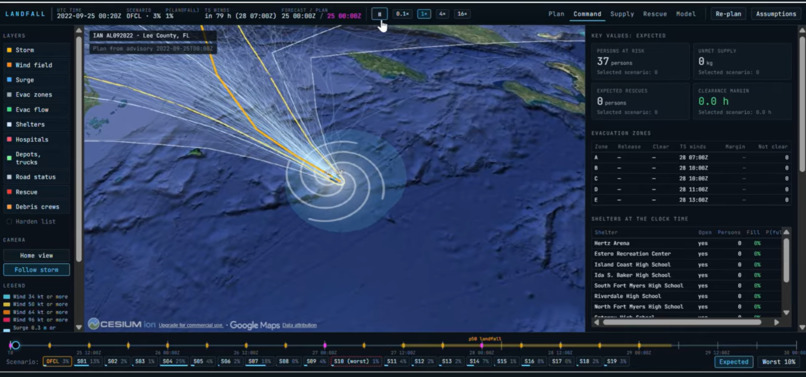
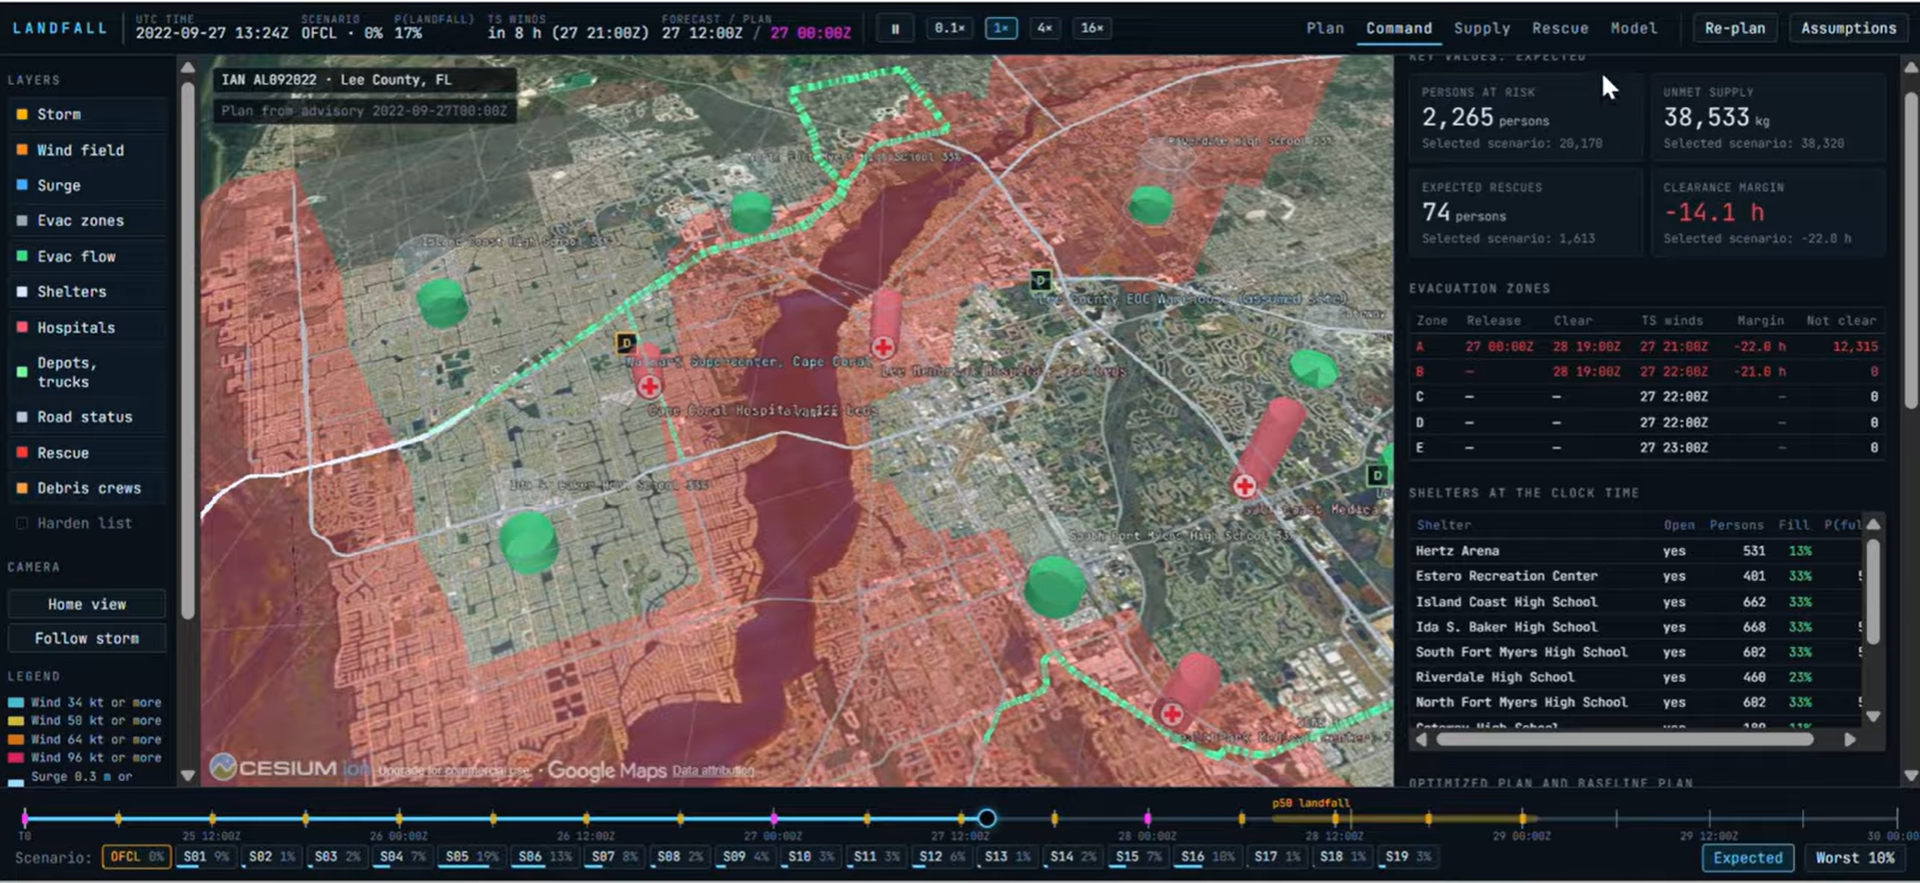
storm view
-
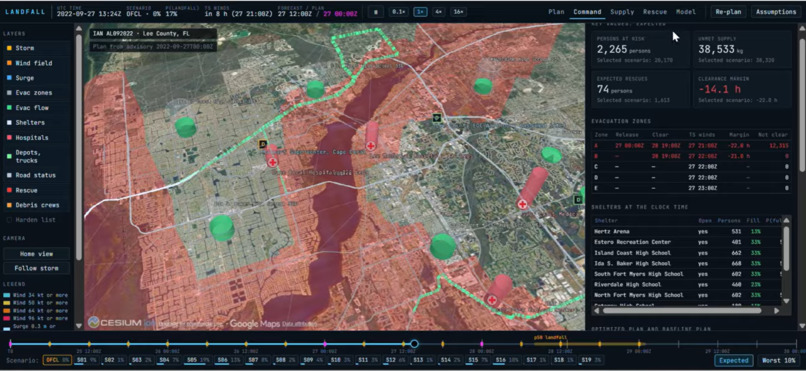
evacuation paths
-
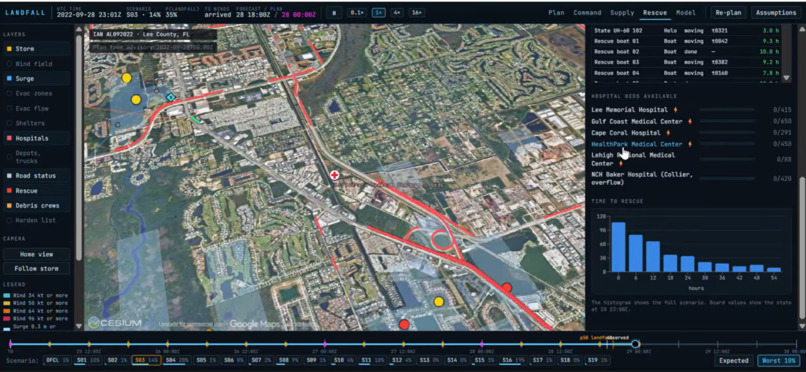
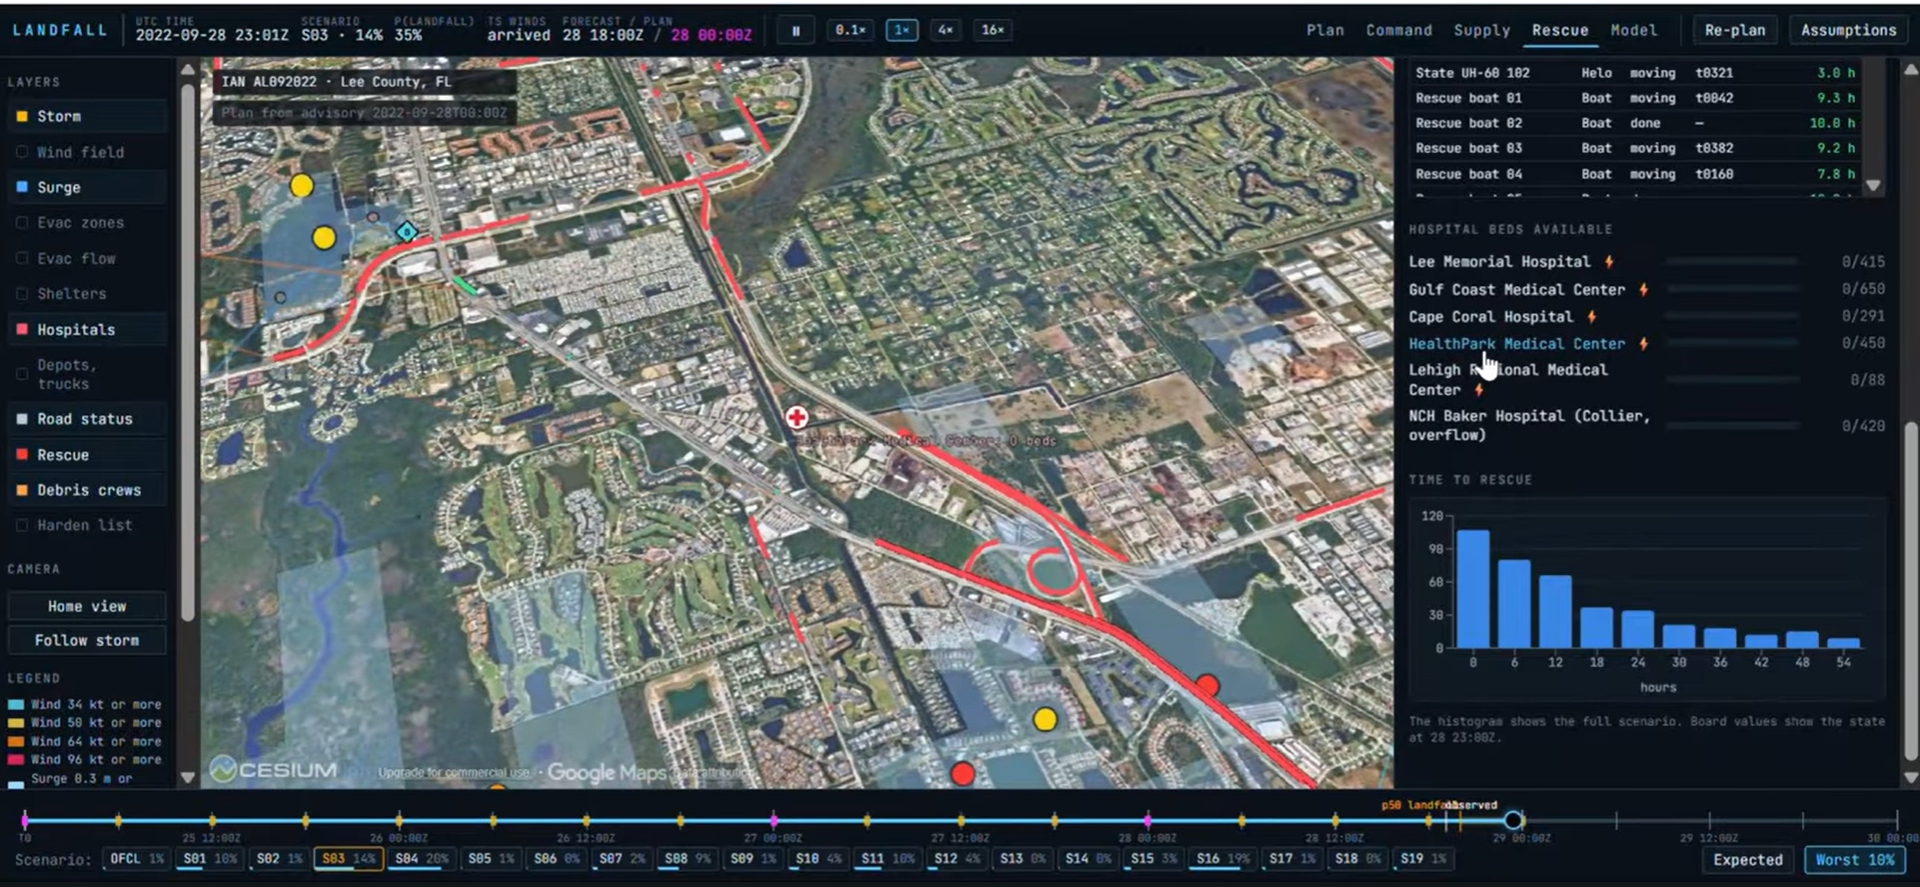
helicopter tracking
Inspiration
On September 28, 2022, Hurricane Ian came ashore at Cayo Costa with 150 mph winds and pushed a wall of water into Fort Myers Beach and Sanibel. It became the deadliest storm to hit Florida since 1935, and Lee County had more deaths than any other county (NPR). Lee ordered its mandatory evacuation on September 27, the day before landfall. Neighboring counties had moved a day earlier.
Hindsight makes that look like an easy call. Two days out, it wasn't. The official forecast still leaned toward Tampa Bay, and every hour of waiting bought a better forecast while spending clearance time. We wanted to build the tool we would want in that room: one that takes the uncertainty seriously and still hands you a decision.
What it does
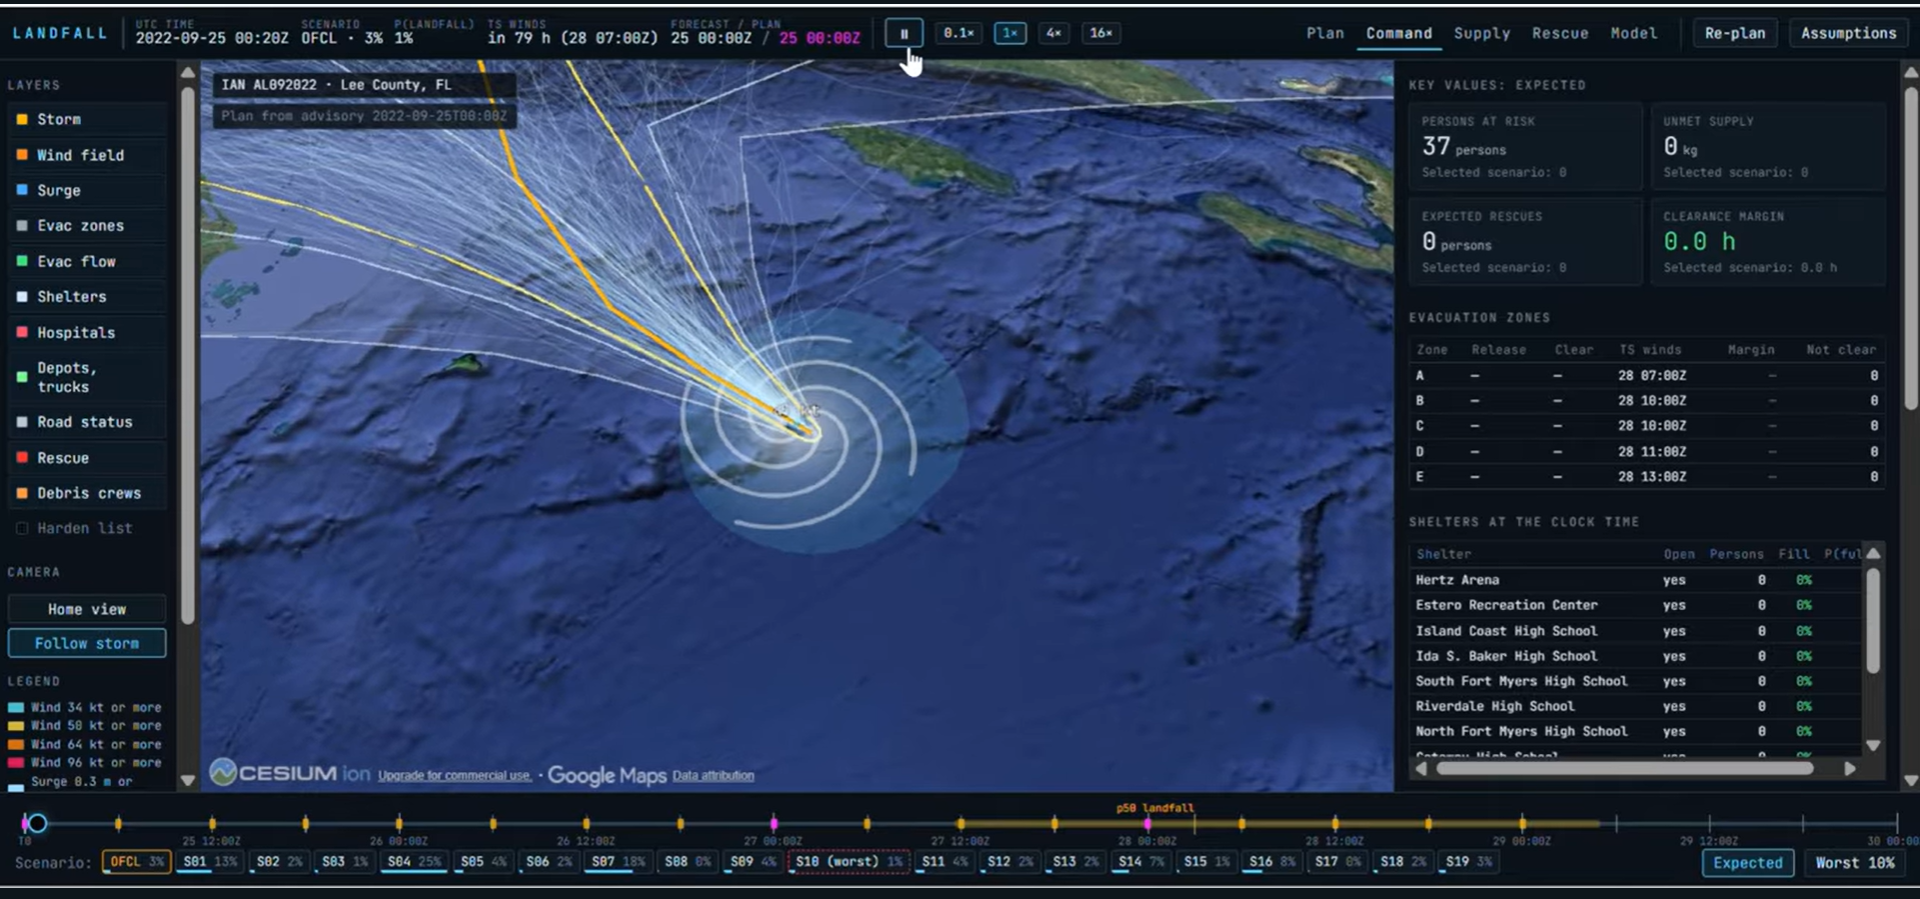
LANDFALL plans the preparation and response to a hurricane before it happens: evacuation, medevac, logistics, infrastructure routes are all simulated and optimized. At every NHC advisory it predicts 1,000 possible tracks, works out the wind, surge, damage, and blocked roads for each one, and plans the response across all of them at once: when to order each evacuation zone, which shelters to open, where to stage water, food, fuel, and medical kits, and where the boats and helicopters go once the wind drops.
Everything lands on a 3D globe with a scrubbable timeline. Drag it forward and you watch the cone redraw itself as new advisories arrive, traffic build on I-75, shelters fill, causeways turn red, and helicopters lift off toward Sanibel. Five views split the work: Command for the emergency manager, Plan for a time-ordered action list, Supply for logistics, Rescue for search and rescue, and Model for forecast verification. One toggle flips every number between the expected case and the worst 10%.
How we built it
LANDFALL is a Python pipeline with 5 steps and a React UI. Each step writes files that the next step reads.
- Features (Chalk). Chalk computes the predictor inputs from the NHC best tracks (HURDAT2) and the advisory fixes (ATCF). Each row resolves at its own time, so the model never sees a future fix. The same resolvers serve the replay online.
- Stage 1: predict the storm. A bagged MLP (5 members, 3 layers of 256 units) predicts the change in position and wind over 6 h. It trains on Atlantic storms from 1980 to 2014 and validates on storms from 2015 to 2021. Ian is in neither set. At each step, the sampler adds a residual from a bank of past forecast errors. It rolls 1,000 tracks forward 120 h. K-medoids reduces the tracks to 20 scenarios with probabilities. The NHC official forecast is always scenario 0.
- Stage 2: compute the impacts. On a 500 m grid, the model computes the wind, the surge depth, the damage, the injuries, and the rescue requests. It also computes the chance that each road segment is blocked.
- Stage 3: plan the response. A greedy search sets the release time of each zone. A two-stage stochastic linear program in HiGHS stages the supplies. Then each scenario runs 5 draws of compliance, road damage, and rescue requests. Each draw runs the evacuation traffic, the truck deliveries, the OR-Tools rescue routing, and the debris crews. A baseline plan that follows the county category rules runs on the same 100 draws.
- Serve and show. FastAPI serves the artifacts. React, CesiumJS, and resium draw them on the globe.
The wind field uses the Holland (1980) profile with \( B = 1.3 \):
$$ V(r) = V_{max} \sqrt{\left(\frac{R_{max}}{r}\right)^{B} \exp\left(1 - \left(\frac{R_{max}}{r}\right)^{B}\right)} $$
The first-stage decisions minimize the expected cost over the scenarios \( s \), each with a probability \( p_s \):
$$ \min \sum_{s} p_s \left( 1000\, N_s + 50\, U_s + 500\, R_s \right) + E + 0.1\, C $$
Here \( N_s \) is the persons not cleared before tropical-storm winds, \( U_s \) is the unmet supply in kg, \( R_s \) is the rescue demand, \( E \) is the persons evacuated without need, and \( C \) is the transport cost.
All inputs are real data: HURDAT2, the ATCF a-deck, the Lee County evacuation zones, Census TIGER and ACS, the Copernicus GLO-30 elevation model, and OpenStreetMap roads. All documentation follows ASD-STE100. A custom linter checks it in make check.
Challenges we ran into
Our first ensemble was confidently wrong. We sampled whole error histories from past storms, and the cone turned into a collage of other hurricanes, 800 km wide at 48 hours. We switched to per-step residuals grouped by latitude and calibrated the spread on 2015 to 2021 storms until the median spread matched the median error. Ian never touched the tuning.
The optimizer found a loophole. When "persons not cleared" counted only evacuees, the best plan was to evacuate nobody. We redefined it as people in flooded areas who are still there when tropical-storm winds arrive, and the plans started making sense.
Textbook physics, wrong answer. The pure Holland formula put 34-knot winds 380 km from the eye, so tropical-storm conditions reached Lee a full day early. Adding the Coriolis term pulled that in to about 230 km. The surge constant needed the same treatment: it gave 28.6 m at Fort Myers Beach until we calibrated it to the observed 4 m.
Chalk kept us honest, sometimes more than we expected. Our remote training labels came back empty because Chalk will not show a fix after the row time, and a 6-hour label needs exactly that future fix. We moved the labels into an offline-only resolver. We also chased lag features that were all zero until we found Chalk timestamps in microseconds where our code expected nanoseconds.
Infrastructure. We trained on CPU with no GPU, waited 45 minutes on overloaded OpenStreetMap servers during a clean rebuild, and ran into a Chalk Compute cap of 100 scaling groups on our account.
Accomplishments that we're proud of
- On the September 27 advisory, the optimized plan leaves 1,358 people in flood zones uncleared when tropical-storm winds arrive. The county-rules baseline leaves 2,049.
- In the worst scenario, the plan watches the Sanibel Causeway and the Matlacha Pass Bridge go down and sends helicopters to 102 island rescues. Both crossings failed during the real Ian.
- Our forecast beats the climatology baseline on Ian at 48 hours (432 km against 449 km) and loses to NHC (118 km). We publish that, along with the two acceptance checks we failed.
- Chalk remote and local runs agree to within 0.000001 on all 18,100 training rows.
- A fresh clone rebuilds everything with one command and reproduces the same numbers.
What we learned
Uncertainty only matters when it changes a decision. A cone on a map says nothing about when to order zone B, and turning probabilities into actions took more work than predicting the storm.
Point-in-time correctness is easy to promise and easy to break. Chalk caught a leak we would have shipped.
Writing every assumption down pays off. Ours live in the config, the model card, and an Assumptions drawer in the UI, so anyone who asks where a number came from gets an answer.
What's next
- Give the predictor steering-flow data from reanalysis so it can see the trough that turned Ian.
- Replace the surge proxy with NOAA SLOSH grids.
- Run LANDFALL live on real advisories next hurricane season and add neighboring counties.


Log in or sign up for Devpost to join the conversation.