-
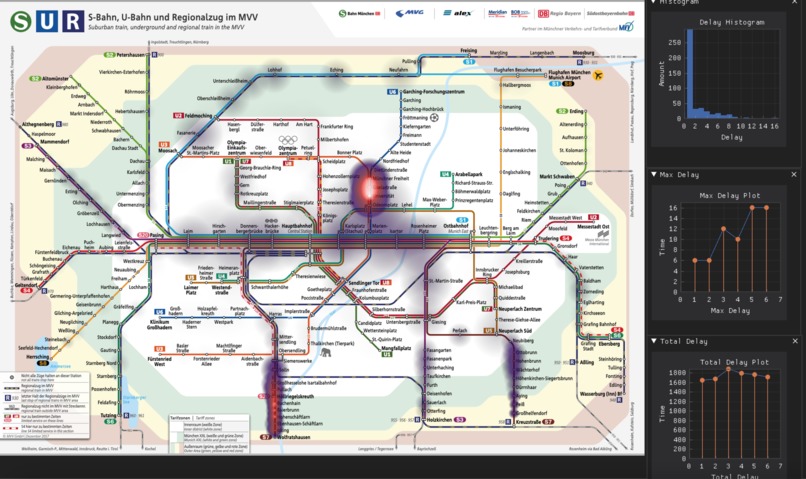
Screenshot of the Dashboard
Track/Sponsor
Landeshauptstadt München
Inspiration
Our inspiration came from the frustration with public transport delays.
What it does
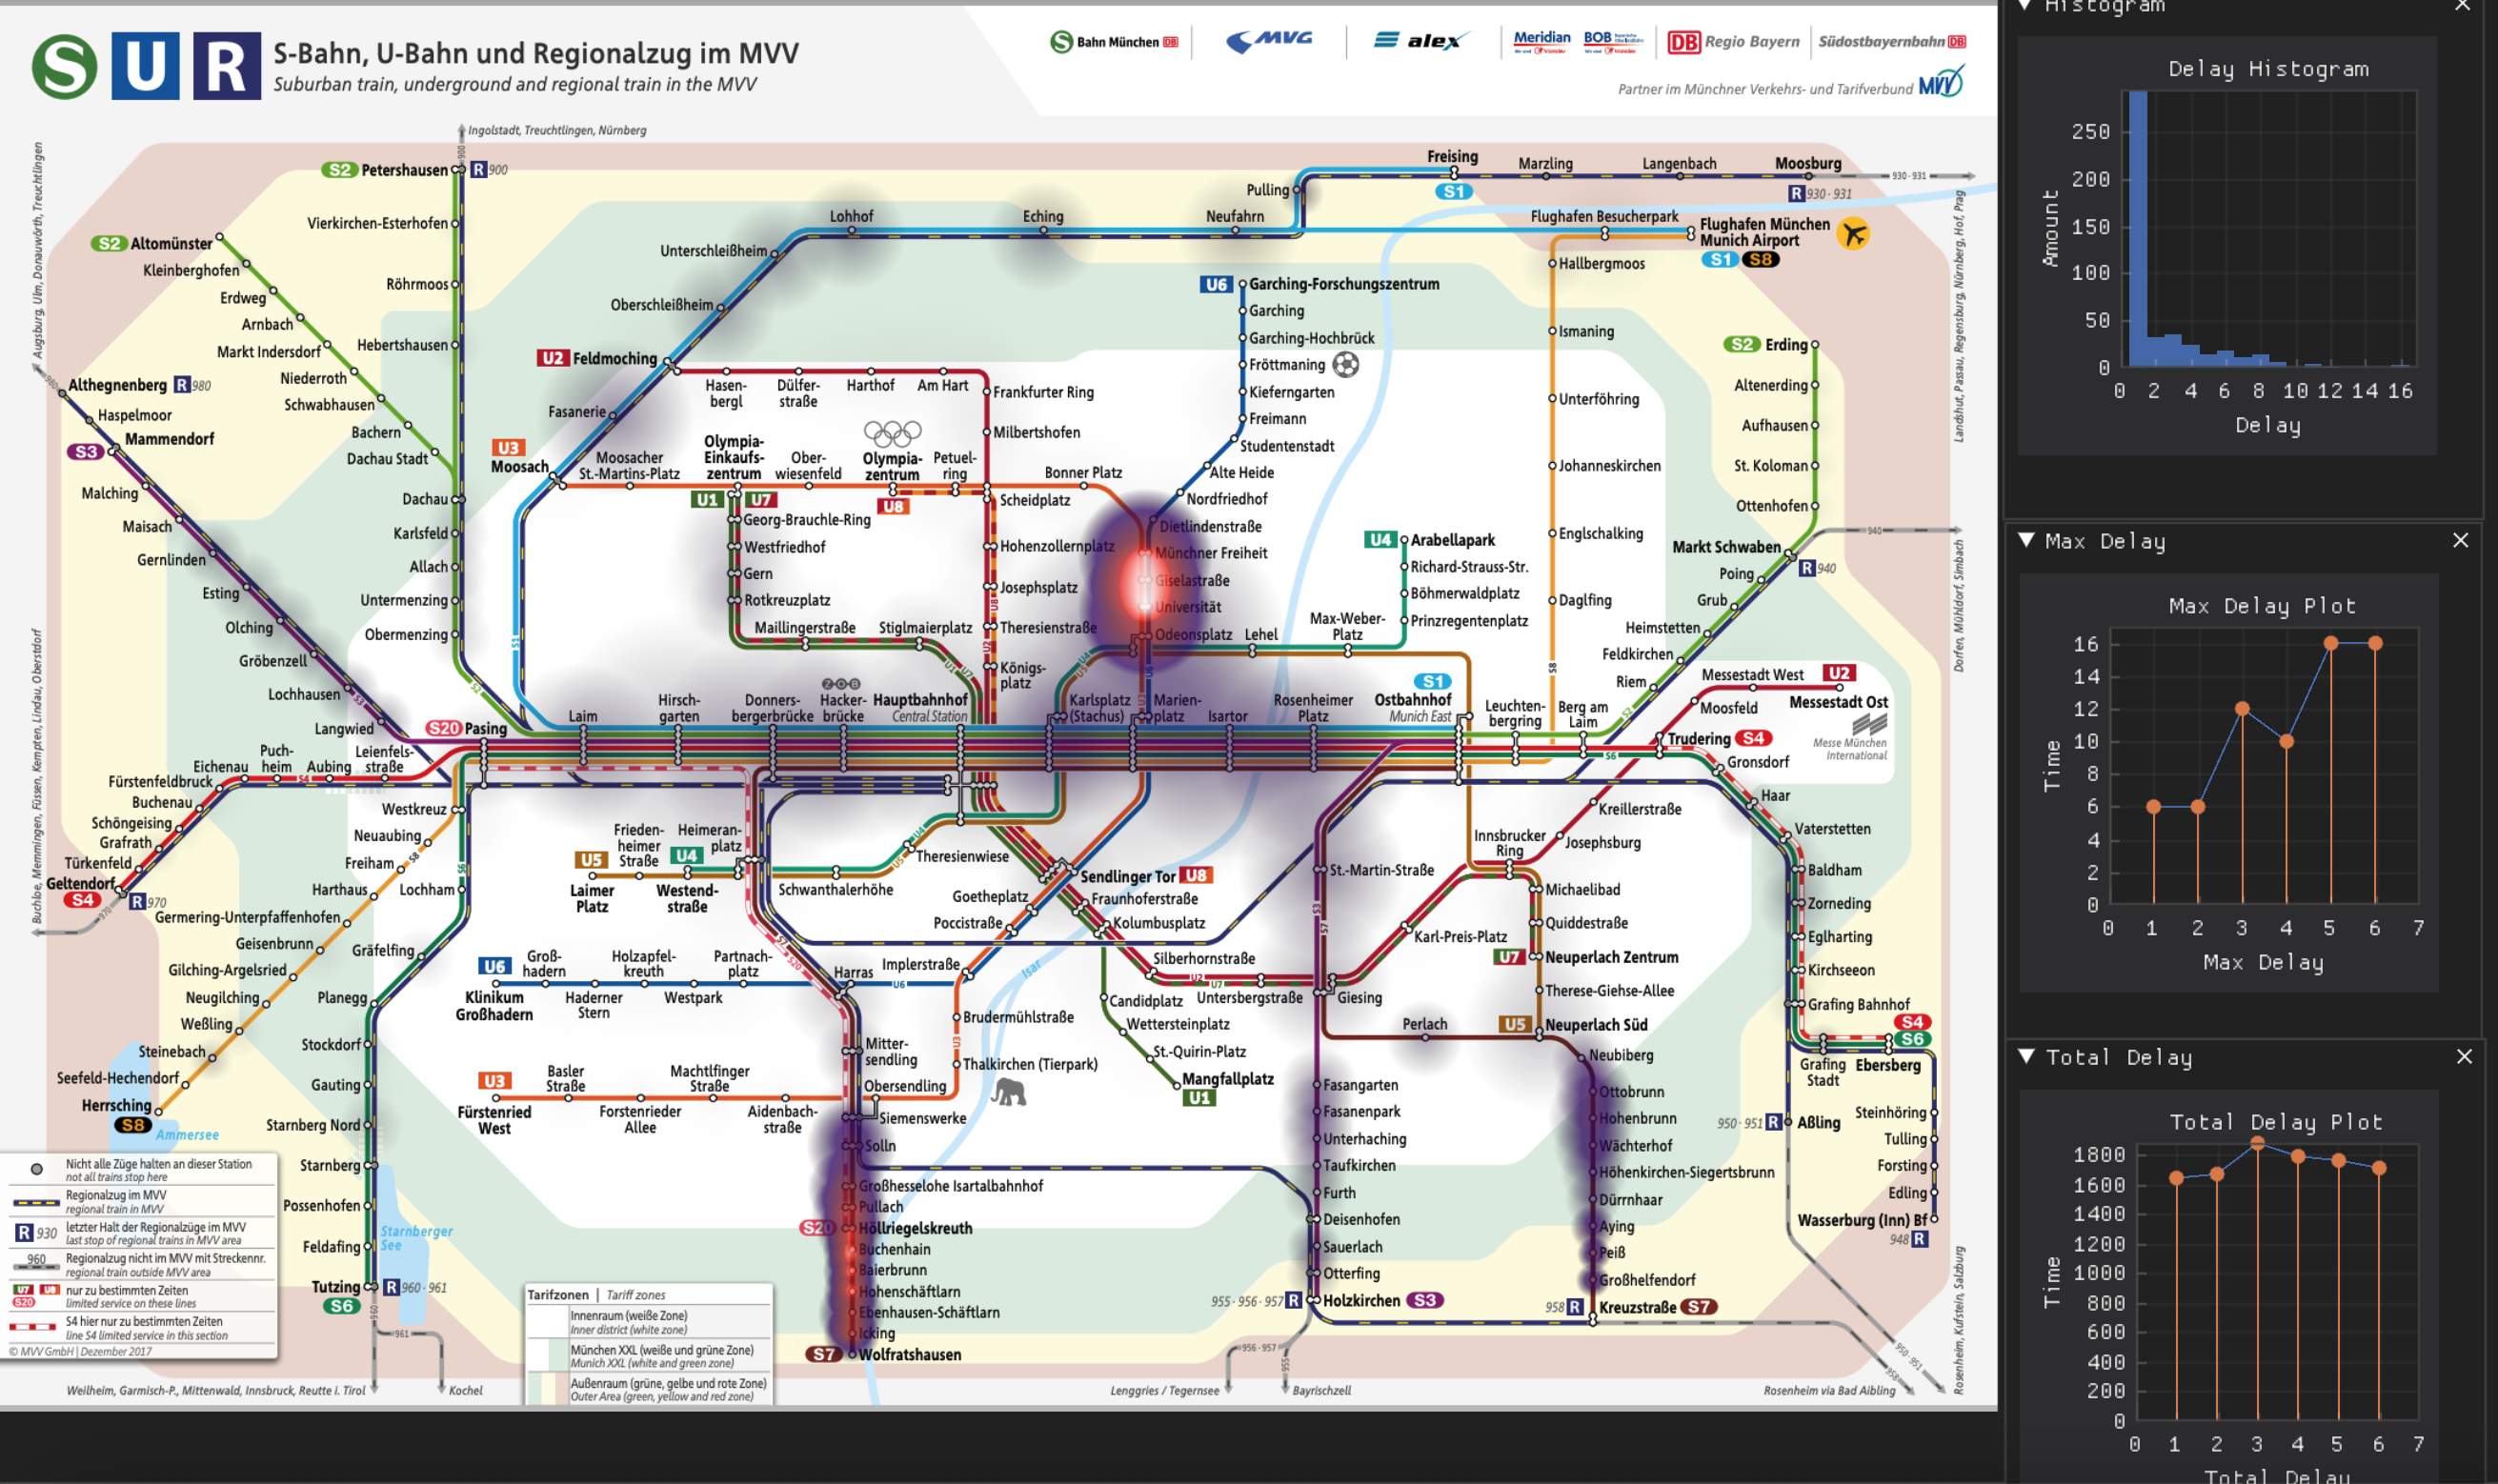
Our dashboard displays heatmap, histogram, and line graphs of information on delay time for ubahn and sbahn trains in real time.
How we built it
We used Python, the python_mvg_api to get the data and dearpygui to visualize it. We downloaded the map from the internet and made use of it. Source - https://www.mvv-muenchen.de/fileadmin/mediapool/03-Plaene_Bahnhoefe/Netzplaene/2018_MVVnetz_Final_S_U_R_screen.pdf
Challenges we ran into
Team building - We had to build team randomly with people we didn't know anything about Identifying coordinates of the stations on the map - We had to click on the stations on the map one-by-by to get the coordinates of the stations
Accomplishments that we're proud of
The dashboard displays realtime data on a realtime basis.
What we learned
Working in a team. And for some of us: Programming with python the first time.
What's next for Landesbauptstadt München Challenge
Utilize the dashboard to effectively identify issues and improve the transportation system in Munich
Dashboard Screenshot
-attached files
Built With
- .
- dearpygui
- python
- python-mvg-api


Log in or sign up for Devpost to join the conversation.