-
-
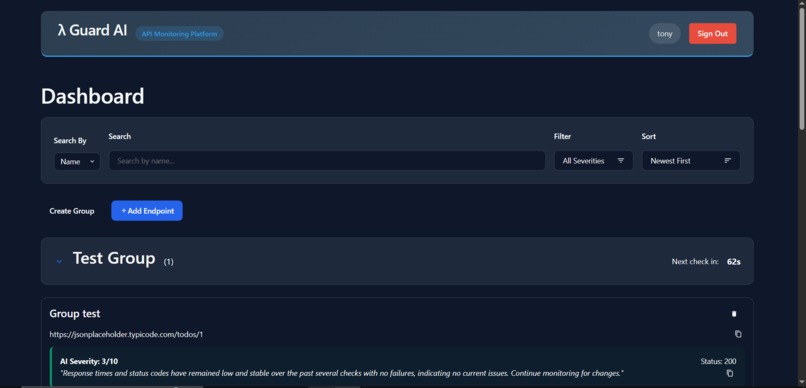
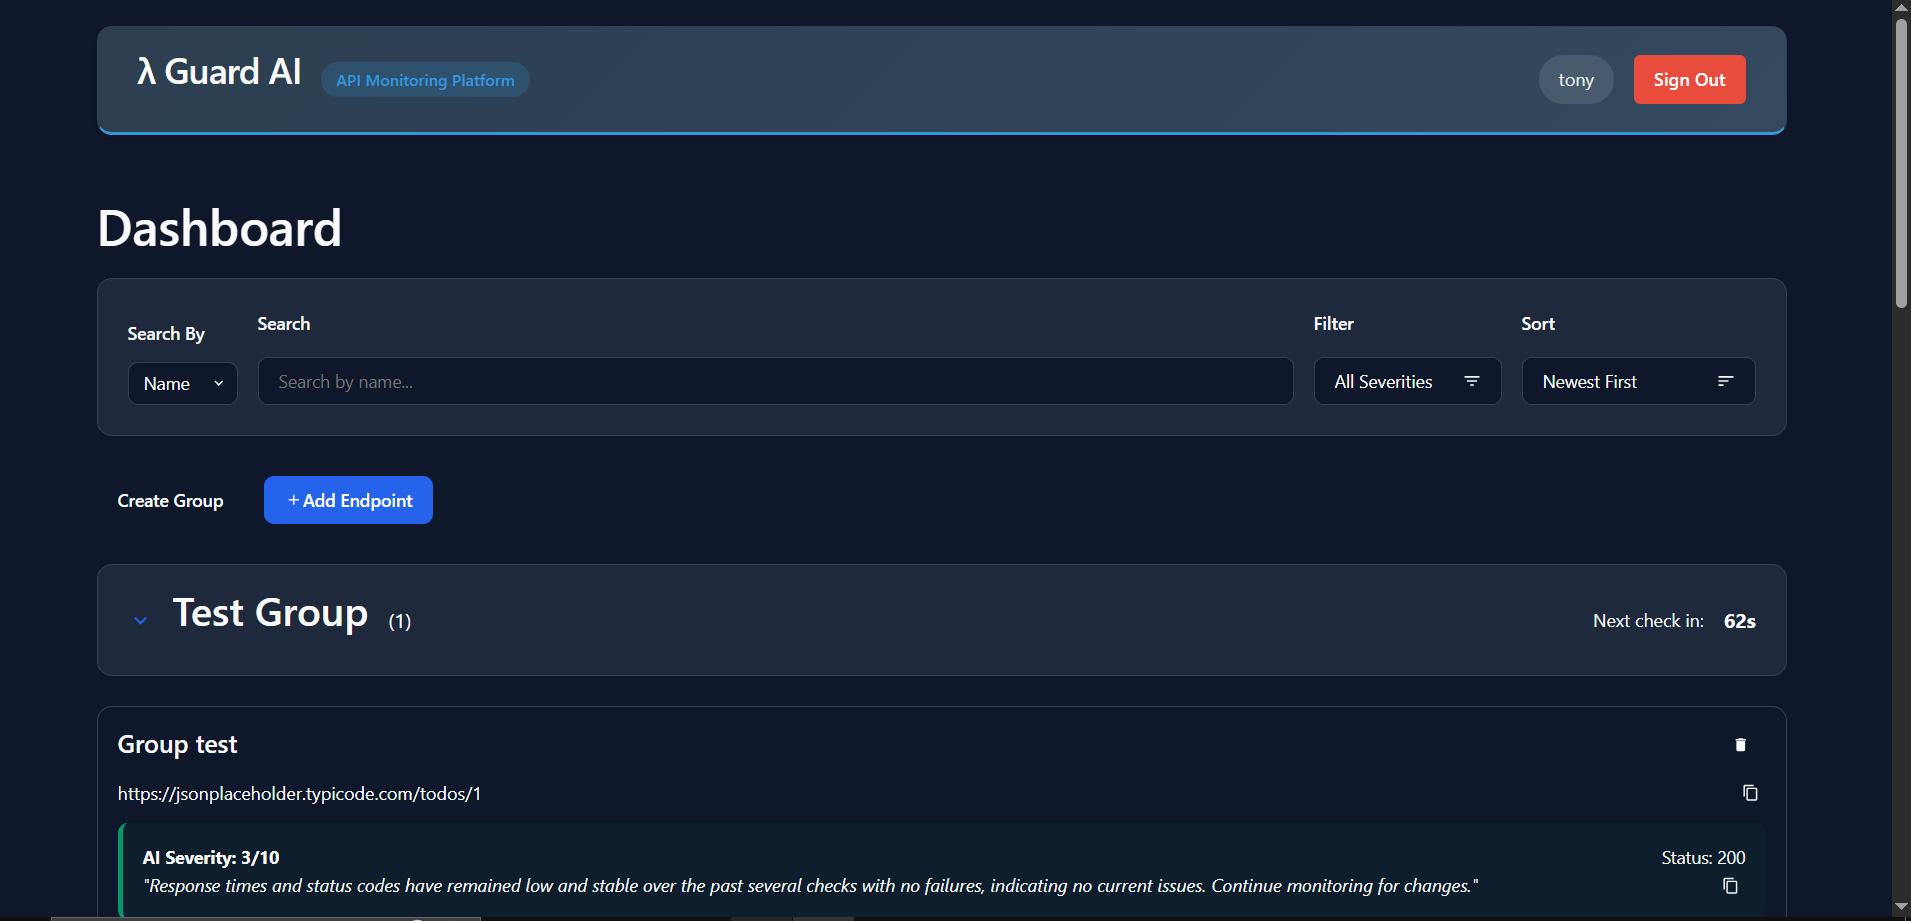
The top of the dashboard page
-
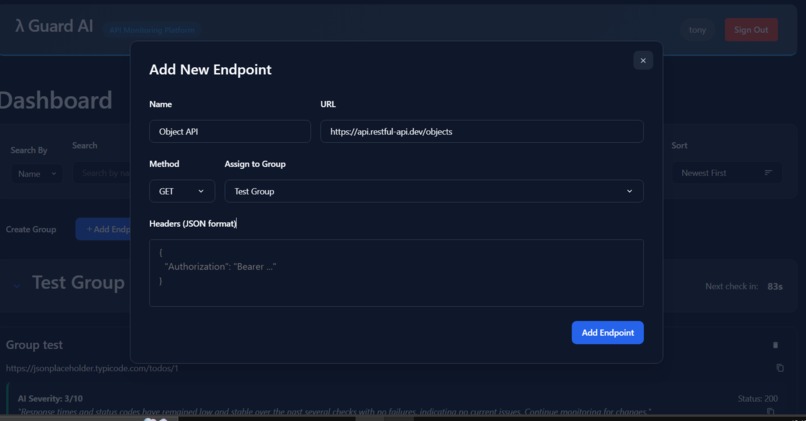
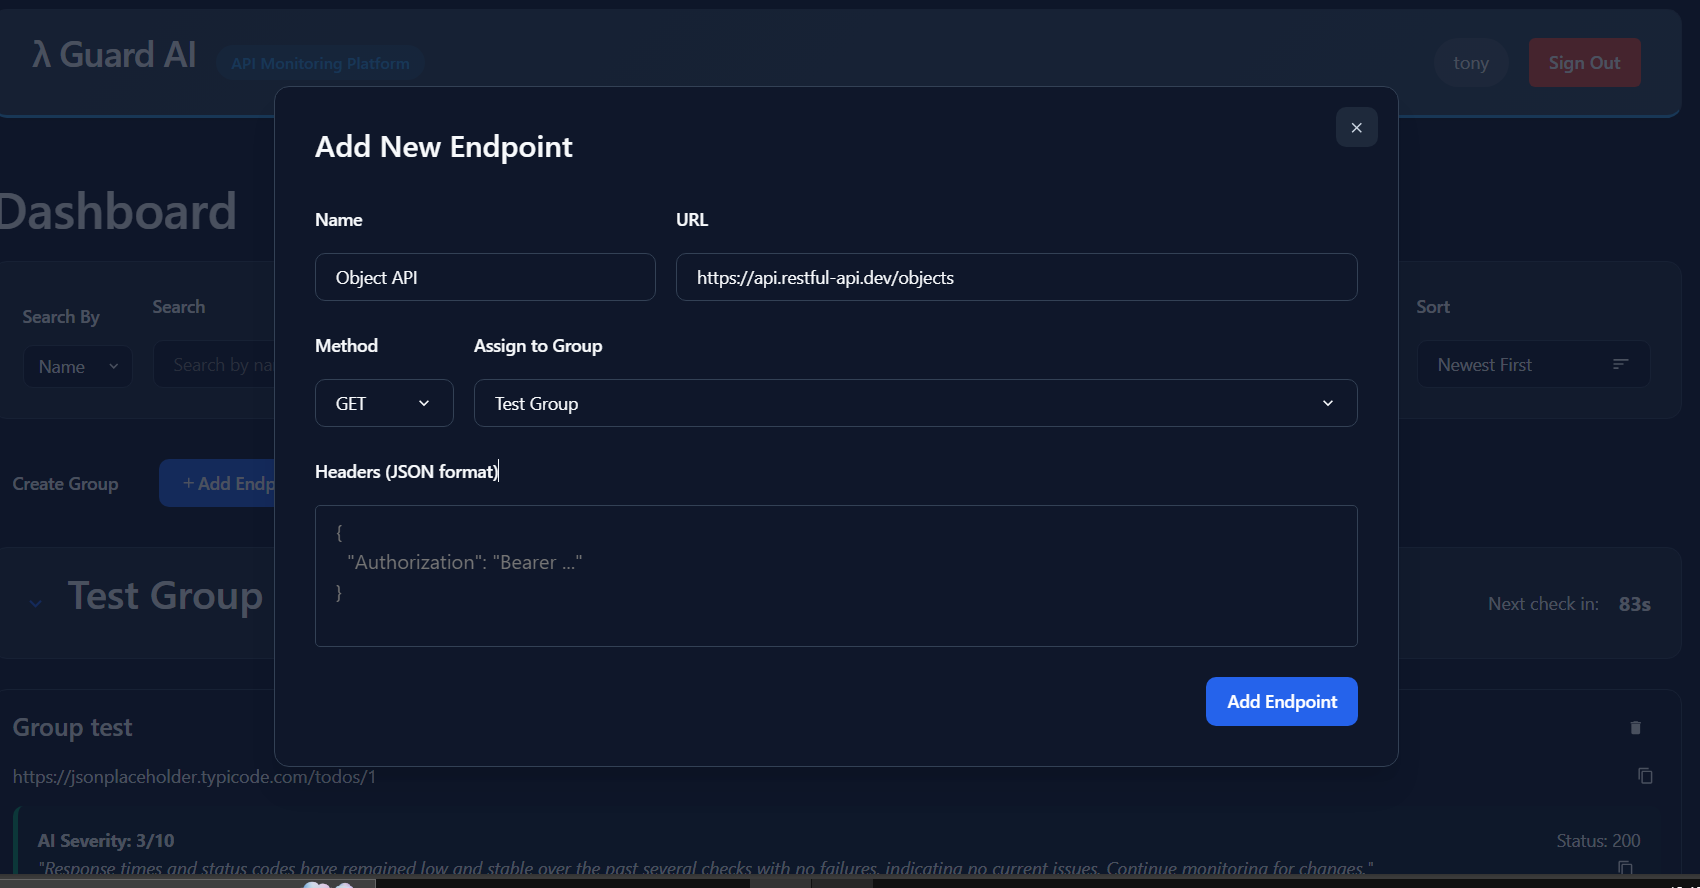
Create endpoint modal - get request
-
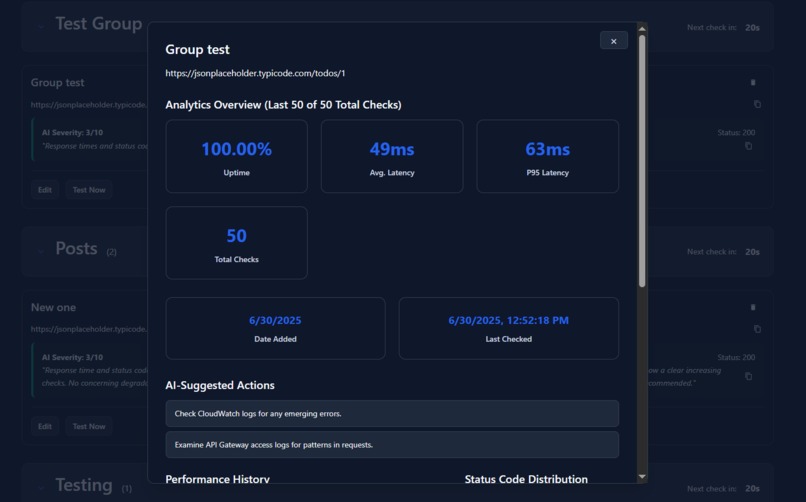
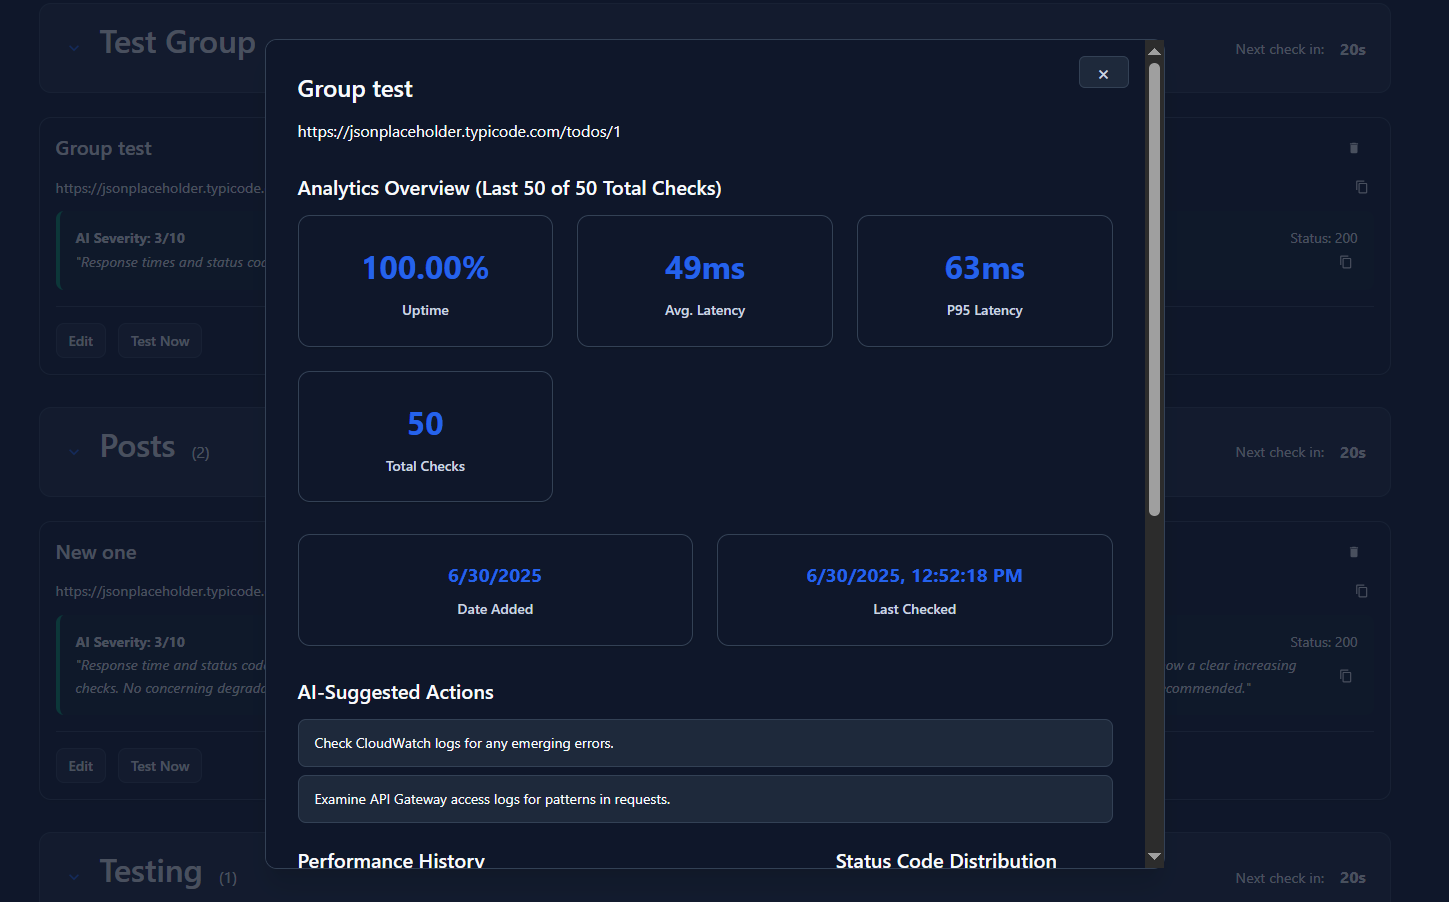
Endpoint detail modal view metrics about specific clicked on endpoint
-

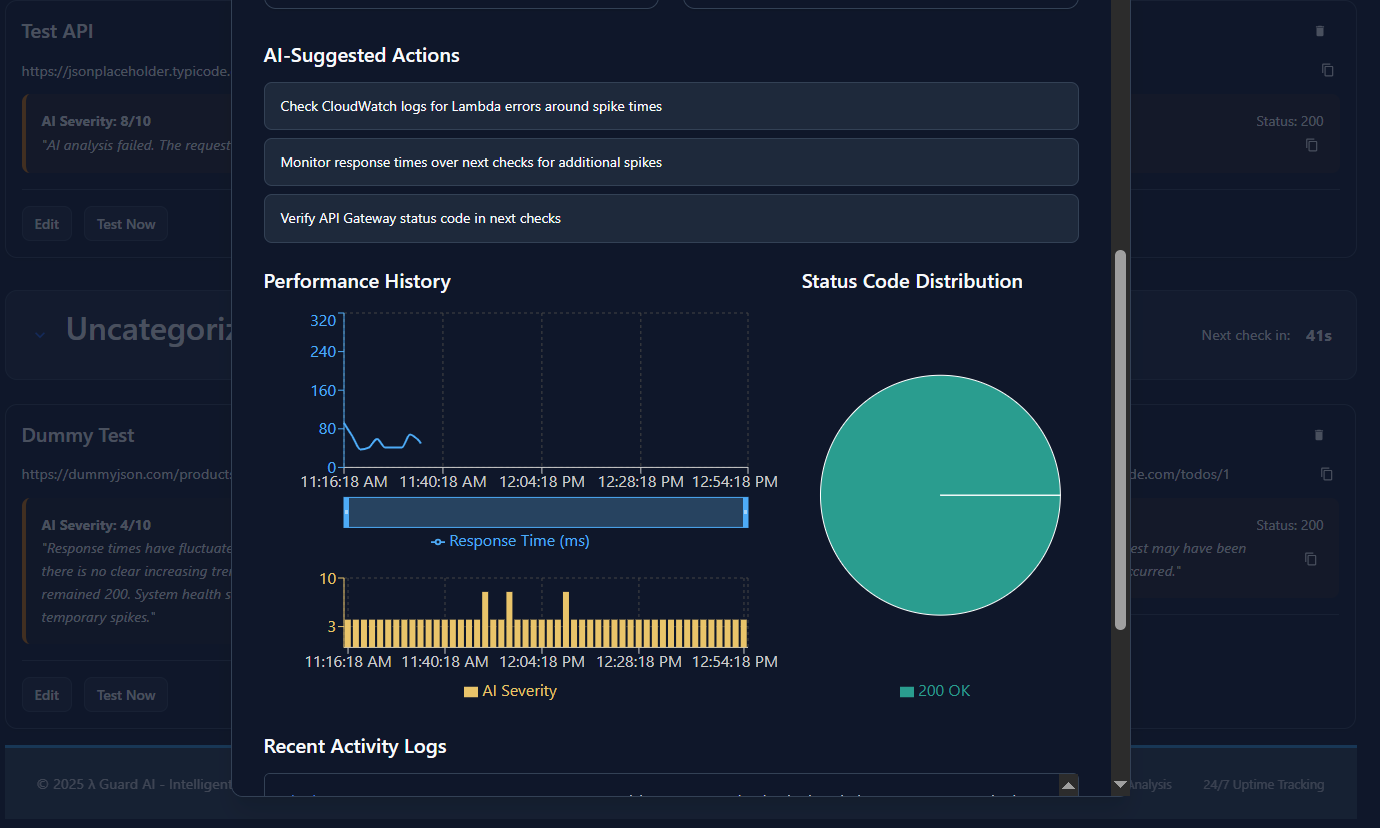
Endpoint detail modal view charts and ai suggested actions based on metrics
-
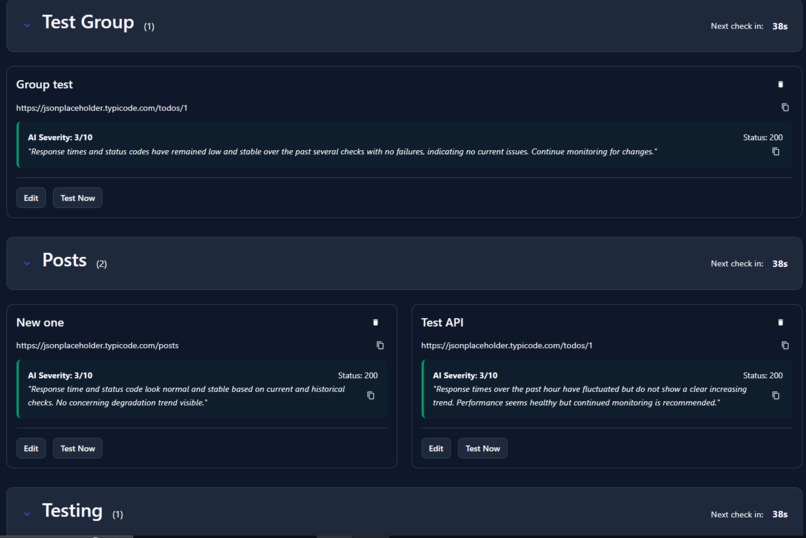
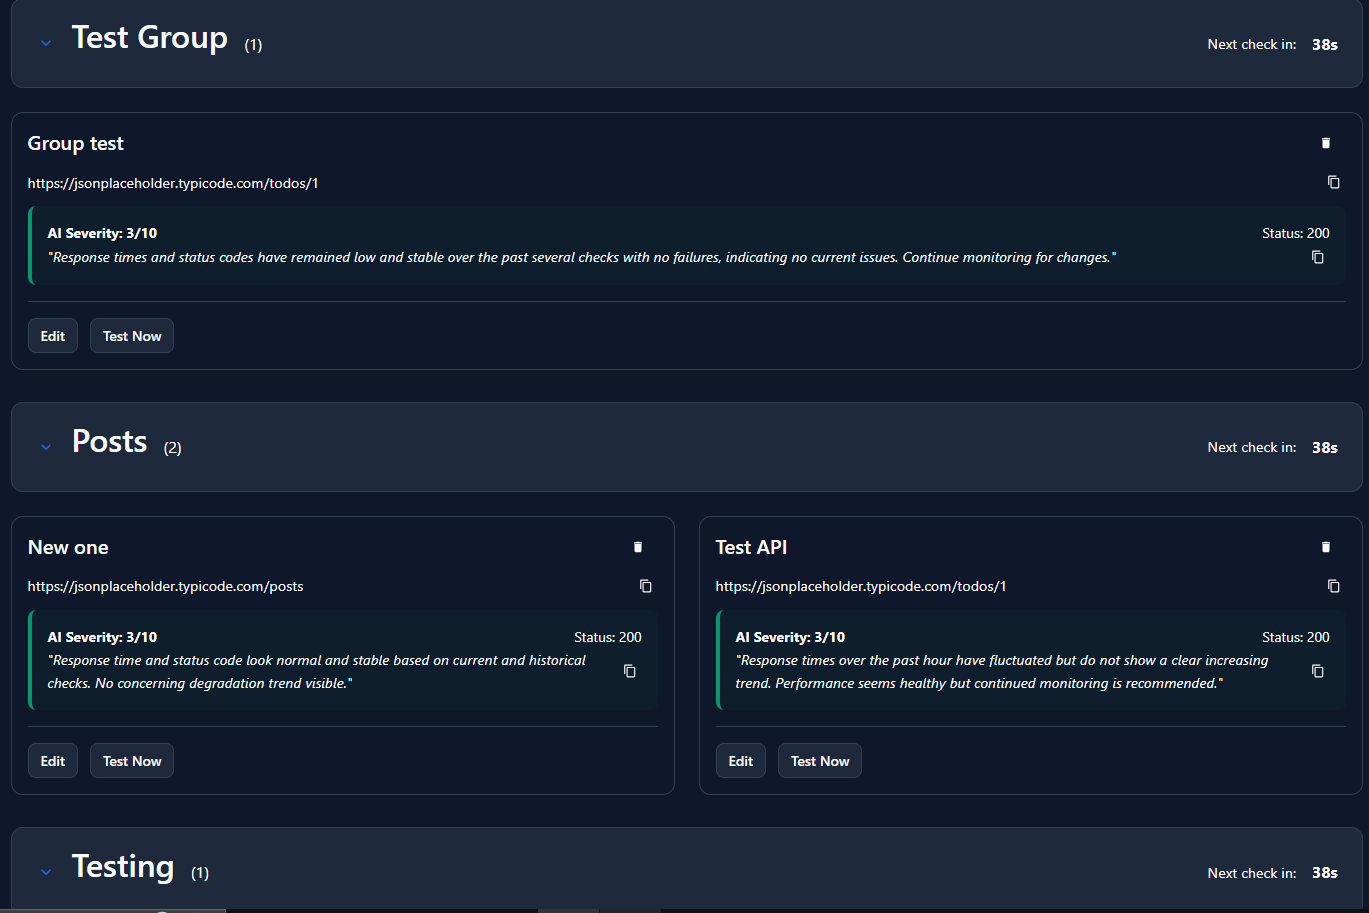
Basic dashboard view of ai analysis for each endpoint in each group
-
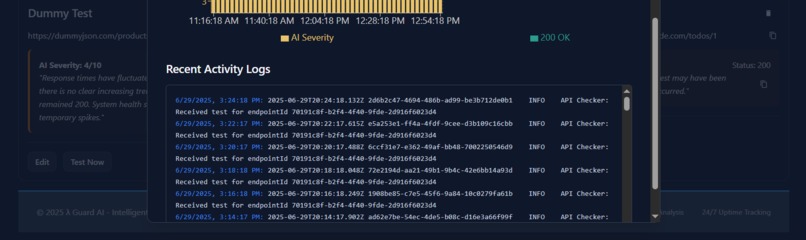
Endpoint detail modal view logs for specific endpoint from the cloudfront console
-
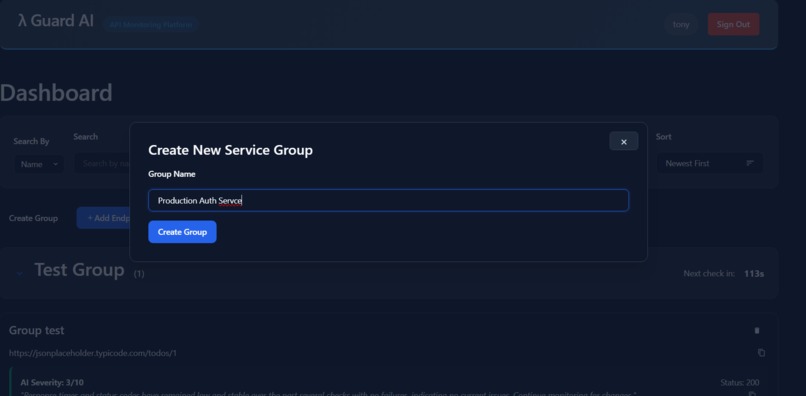
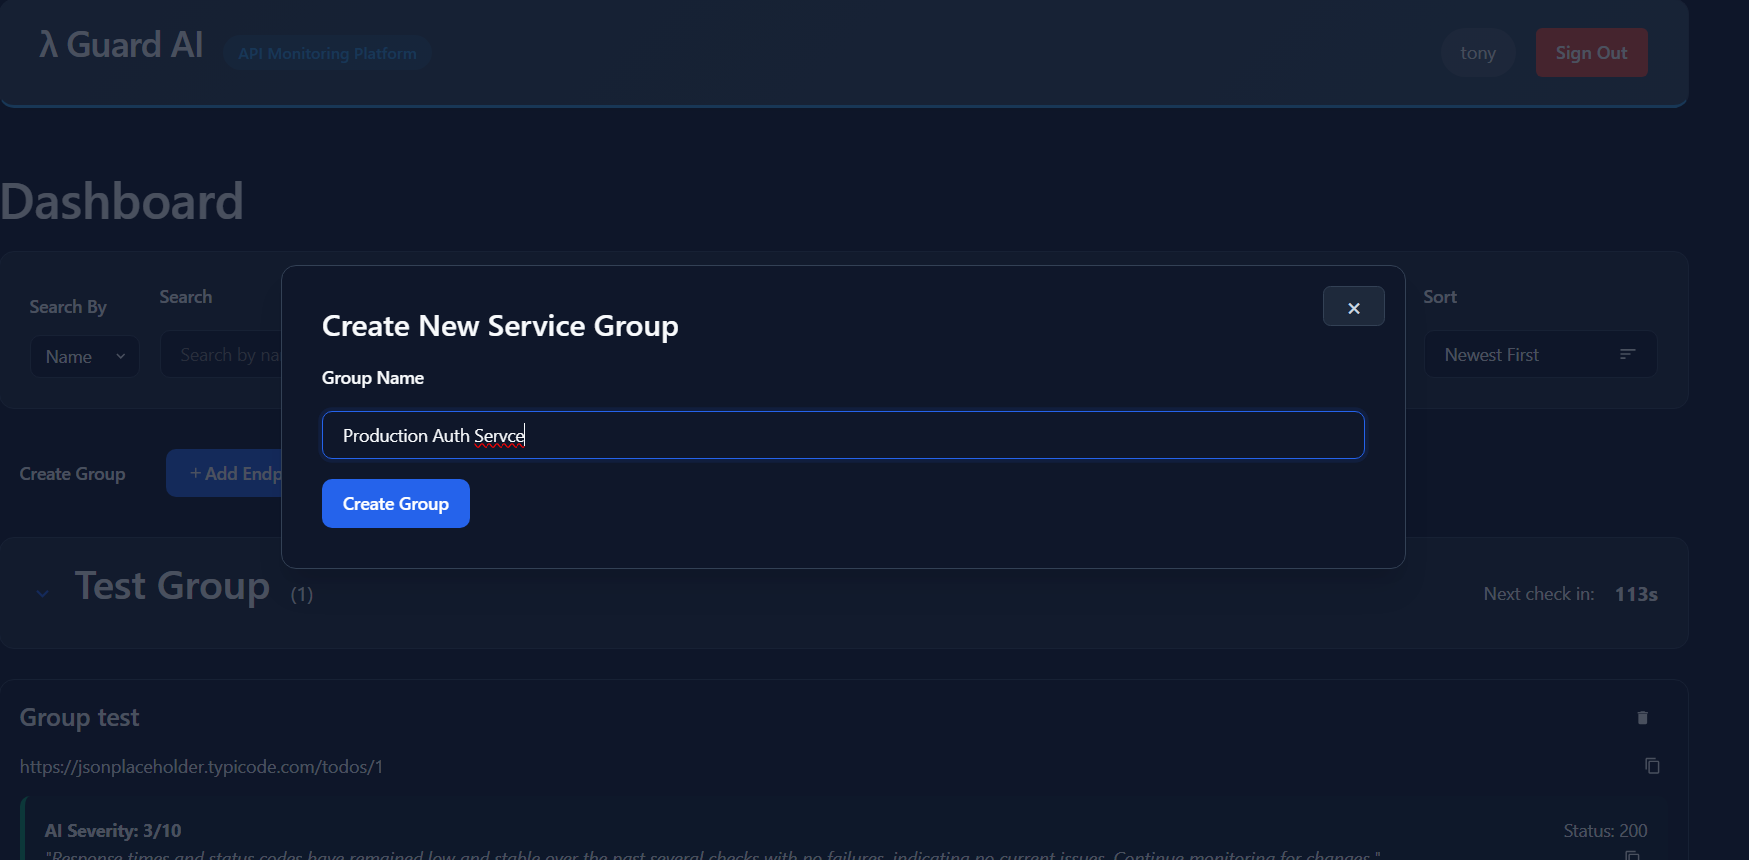
Create an endpoint group modal
-

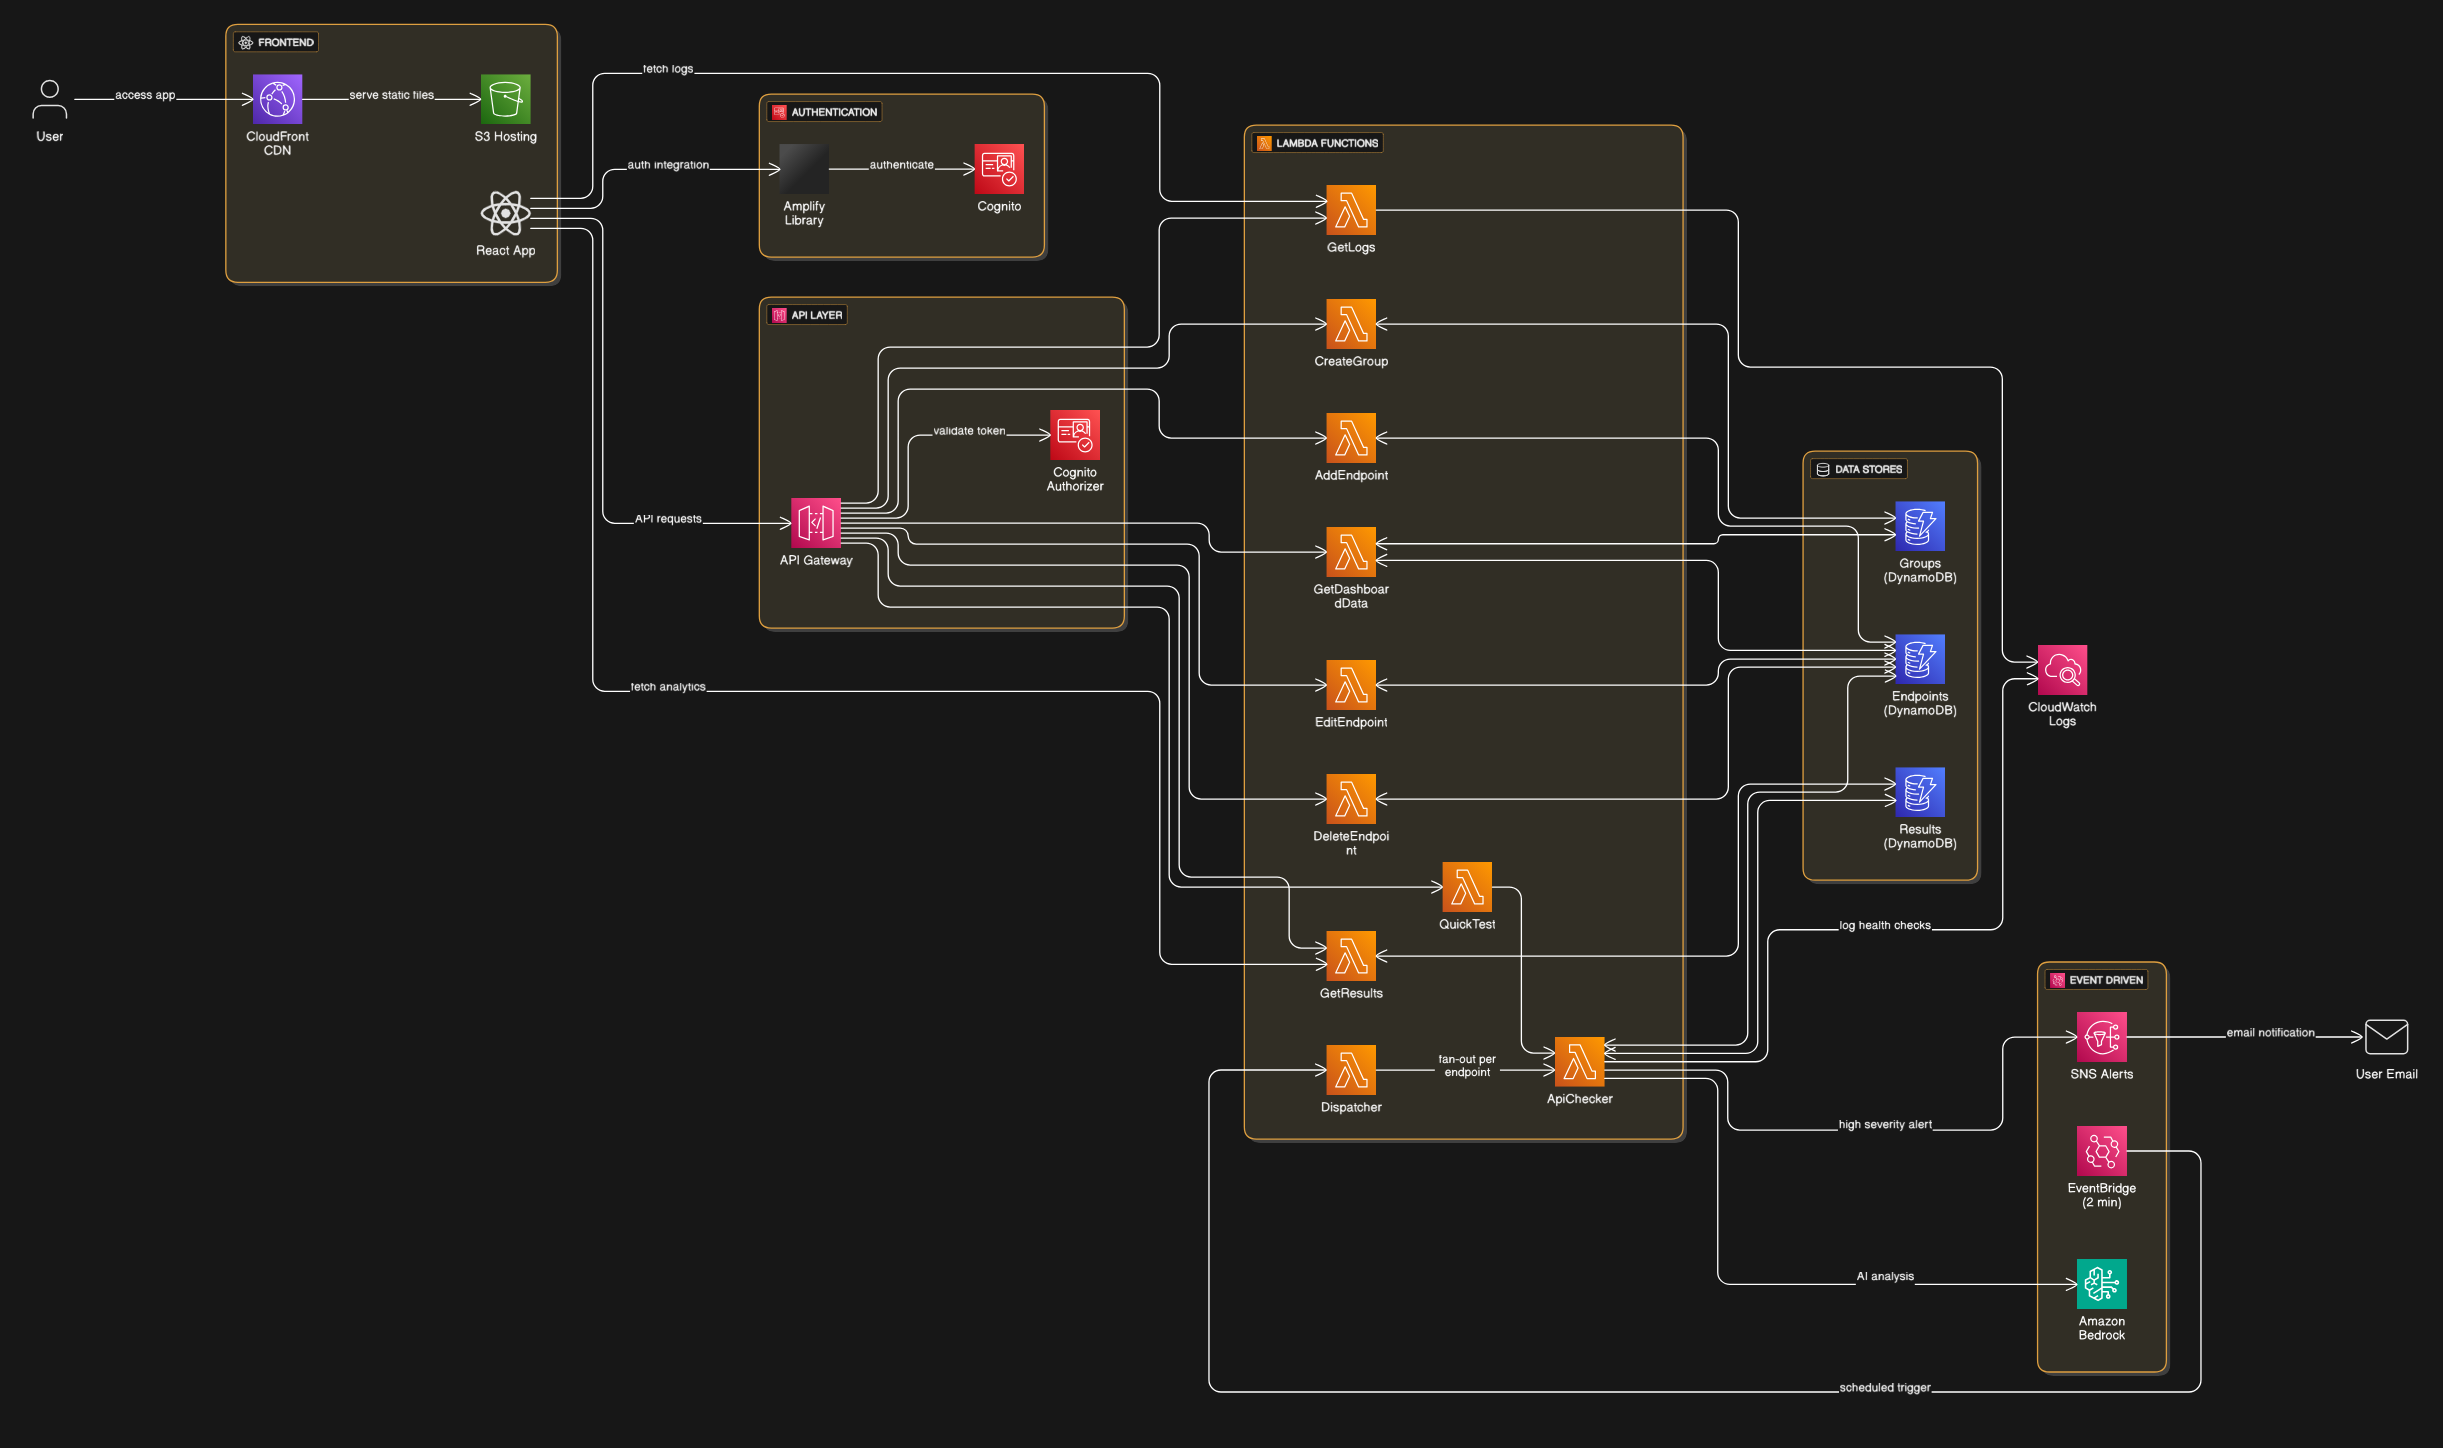
System Architecture Diagram

Inspiration
We were tired of the traditional, reactive approach to API monitoring. Standard tools only tell you when your service is already down, which is too late and already impacting users. We were inspired by the idea of predictive maintenance from the industrial world and wanted to apply it to software. We asked ourselves: "What if a monitoring tool could act like an experienced senior engineer, not just flagging a 500 error, but noticing when a service is getting 'sick'—when its latency is slowly creeping up or its response format is subtly changing?" We saw a huge gap for a tool that moves beyond simple uptime checks to provide proactive, intelligent, and genuinely useful insights, preventing outages before they ever happen.
What it does
LambdaGuard AI is an intelligent, multi-tenant observability platform that transforms how developers monitor their critical APIs. Instead of just checking for uptime, it proactively identifies performance degradation, predicts potential failures, and provides actionable remediation advice.
Here are its core features:
- Multi-Endpoint & Group Management: Authenticated users can securely sign up, log in, and organize a dashboard of multiple API endpoints into logical groups through a clean, intuitive web interface.
- AI-Powered Trend Analysis & Remediation: This is the heart of LambdaGuard AI. For every check, the system sends the current result along with its recent history to Amazon Bedrock. The AI then generates:
- Trend Analysis: A human-readable summary of the API's health trend (e.g., "Latency is consistently increasing," "Status codes have been flapping between 200 and 503").
- Severity Score: An intelligent score from 1-10 assessing the real-time risk, beyond just the status code.
- Actionable Remediation: A concrete suggestion for a developer to investigate (e.g., "The high latency on this GET request often points to an inefficient database query. Investigate the primary data retrieval function associated with this endpoint.").
- Deep Observability Dashboard: Users can click into any endpoint to view a detailed modal containing interactive charts for historical latency and AI severity scores. Crucially, it also provides a direct feed of the relevant CloudWatch logs for that specific endpoint, allowing for immediate debugging without ever leaving the application.
- Proactive Alerting: Users automatically receive email notifications via Amazon SNS when any of their monitored endpoints has a check with a severity score above a critical threshold, allowing them to act before a major outage.
How we built it
LambdaGuard AI is built on a 100% serverless AWS architecture, defined as Infrastructure as Code using the AWS Serverless Application Model (SAM).
The Frontend is a React (Vite) single-page application built with the @aws-amplify/ui-react component library. It uses AWS Amplify to seamlessly handle user authentication with Amazon Cognito. The application is deployed as a static site to an S3 bucket and served globally at low latency via Amazon CloudFront.
The Backend is a sophisticated, event-driven system composed of several AWS services working in harmony:
User Management & API Layer: An Amazon API Gateway serves as the front door, secured by a Cognito authorizer. It routes authorized requests to a suite of small, single-purpose AWS Lambda functions that handle user actions like adding, deleting, or viewing their configured endpoints. These Lambdas interact with Amazon DynamoDB tables where user and endpoint configurations are stored.
Monitoring Engine: The core workflow is fully automated.
- An Amazon EventBridge schedule triggers a "Dispatcher" Lambda every two minutes.
- This "Dispatcher" Lambda reads the DynamoDB table and invokes a separate "API Checker" Lambda for each endpoint, demonstrating a scalable fan-out pattern.
- The "API Checker" Lambda is our main workhorse. It calls the target API, fetches historical data from a second DynamoDB "Results" table, and sends all this context to Amazon Bedrock.
- After receiving the AI analysis from Bedrock, it saves the rich report to the "Results" table and, if necessary, publishes an alert to an Amazon SNS topic, which in turn sends an email to the user.
This entire architecture is designed to be scalable, resilient, and cost-effective, running only when it needs to.
Challenges we ran into
- Reliable AI Output: Getting the LLM in Amazon Bedrock to consistently return a valid, structured JSON object was a key challenge. We overcame this through meticulous prompt engineering, providing few-shot examples within the prompt, and adding robust JSON parsing and error handling in our Lambda function to handle edge cases where the model's output might be imperfect.
- Production vs. Development Reality (CORS): This was our toughest challenge. The application worked perfectly locally using Vite's proxy, but failed with CORS errors when deployed. We learned that the Cognito authorizer was blocking the browser's preflight
OPTIONSrequests before they could be processed. This forced us to go beyond basic tutorials and implement an explicit, production-grade CORS policy directly in our API Gateway definition within the SAM template, a crucial step for any real-world web application. - Serverless Debugging: Tracing a request through a distributed system (API Gateway -> Lambda -> DynamoDB -> Bedrock -> SNS) can be complex. We had a learning curve with CloudWatch Logs, but we developed a discipline of adding detailed, structured logs (with user IDs, endpoint IDs, etc.) in each function. This allowed us to trace the entire lifecycle of a check and quickly pinpoint issues.
Accomplishments that we're proud of
- Building a True Multi-Tenant Platform: We didn't just build a script; we built a complete, end-to-end application with secure user authentication and data isolation, deployed globally and ready for real users.
- Implementing an Advanced Serverless Pattern: We are particularly proud of the event-driven fan-out architecture (EventBridge -> Dispatcher -> Checkers). It's an efficient, scalable, and professional-grade pattern that showcases a deep understanding of serverless design.
- Context-Aware AI: Our biggest accomplishment is how we use AI. We don't just ask it about a single data point. By feeding it a history of previous checks, we made the AI "context-aware," enabling it to perform trend analysis and deliver insights that are impossible with simple, stateless checks. This is the feature that makes our project truly unique and powerful.
- Full Infrastructure as Code: Defining every single piece of our cloud infrastructure—from the Cognito user pool to the last IAM permission—in a single
template.yamlfile feels like a superpower. We can tear down and redeploy our entire stack in minutes, which is incredibly powerful for development and reliability.
What we learned
- The Power of Prompt Engineering: We learned that the quality of AI output is directly proportional to the quality of the prompt. Small changes in wording, providing examples, and clearly defining the desired output structure can make a world of difference.
- The Nuances of Production Environments: We learned firsthand that a working local proxy is not the same as a correctly configured production CORS policy. This taught us invaluable lessons about browser security, preflight requests, and the explicit configurations required in API Gateway for a live application.
- Declarative Infrastructure is the Future: Moving from manually clicking in the AWS console to defining everything in a SAM template was a transformative experience. We now have a deeper appreciation for how Infrastructure as Code leads to more consistent, secure, and manageable applications.
What's next for LambdaGuard AI
- Expanded Notification Channels: Integrate with popular developer tools like Slack, PagerDuty, and provide generic webhooks for maximum flexibility.
- Enhance the Analysis Dashboard: Build upon the existing modal view (which includes performance charts and log streams) to create a full-page, time-series dashboard for each endpoint, allowing for deeper historical analysis.
- Configurable Check Intervals & Sensitivity: Give users control over how frequently their endpoints are checked and allow them to set their own severity thresholds for alerting.
- Advanced Root Cause Analysis: Enhance the AI to not only identify a problem but to perform a deeper root cause analysis, perhaps by securely analyzing deployment events or anonymized logs to suggest the exact source of an issue.
Built With
- amazon-api-gateway
- amazon-bedrock
- amazon-cognito
- amazon-dynamodb
- amazon-eventbridge
- amazon-sns
- aws-amplify
- aws-lambda
- aws-sam-(serverless-application-model)
- docker
- infrastructure-as-code
- javascript
- node.js
- react
- rest
- vite

Log in or sign up for Devpost to join the conversation.