-

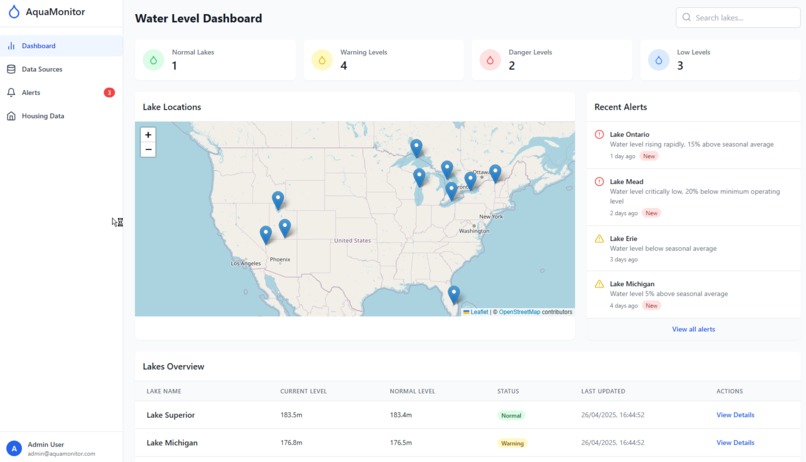
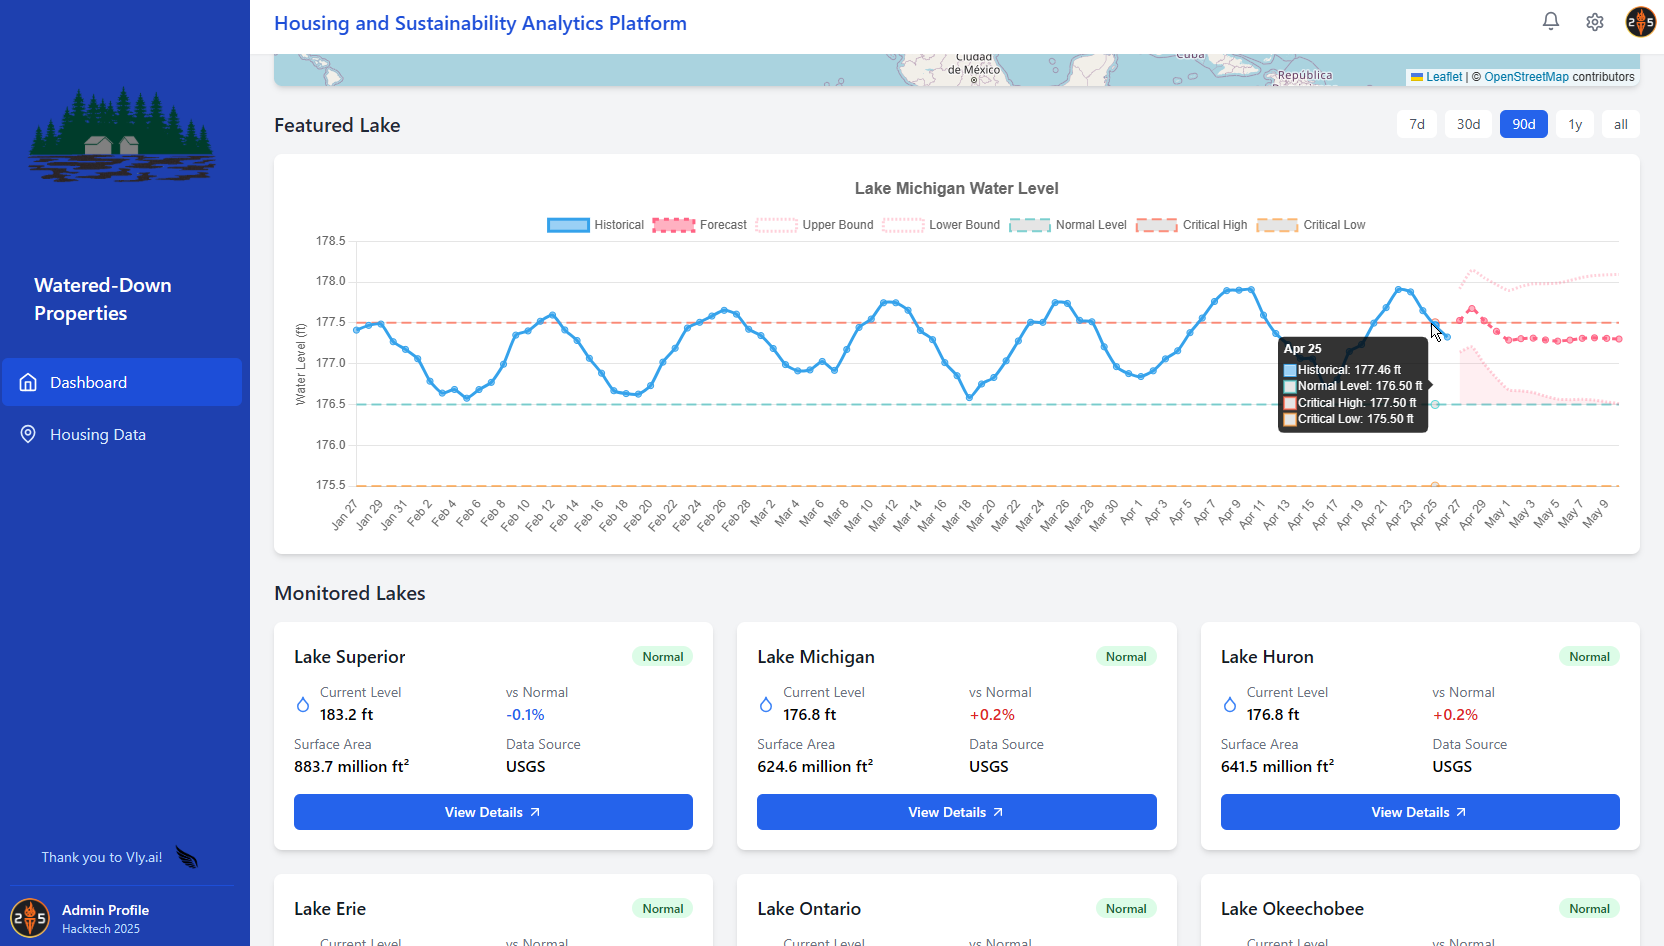
main page
-

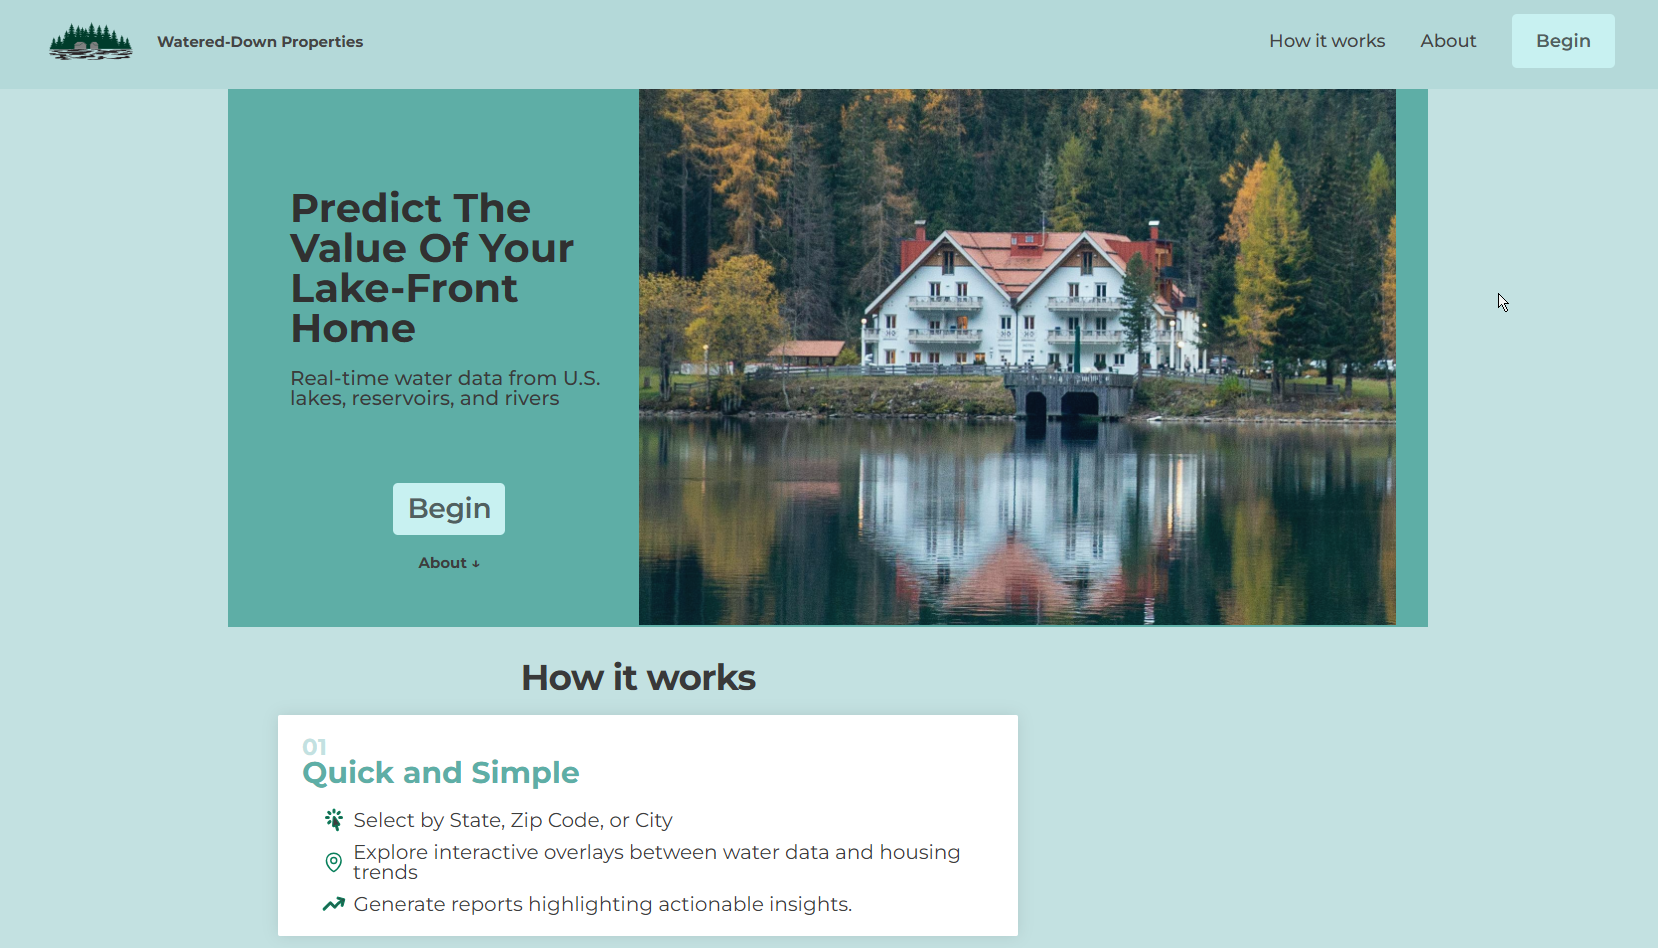
home page
-
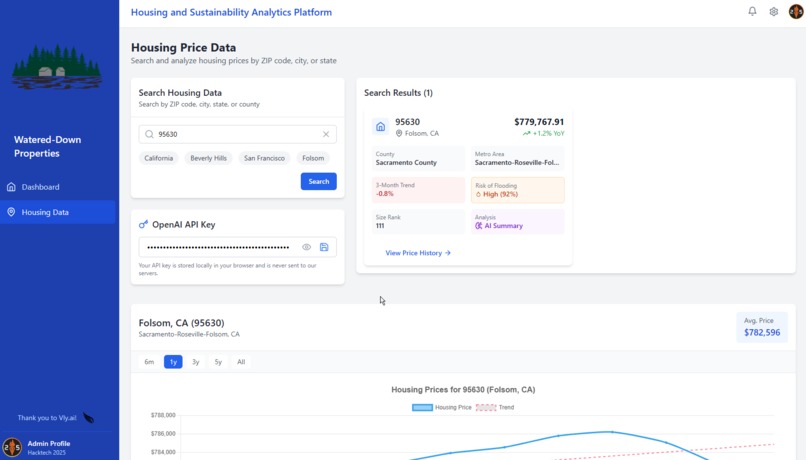
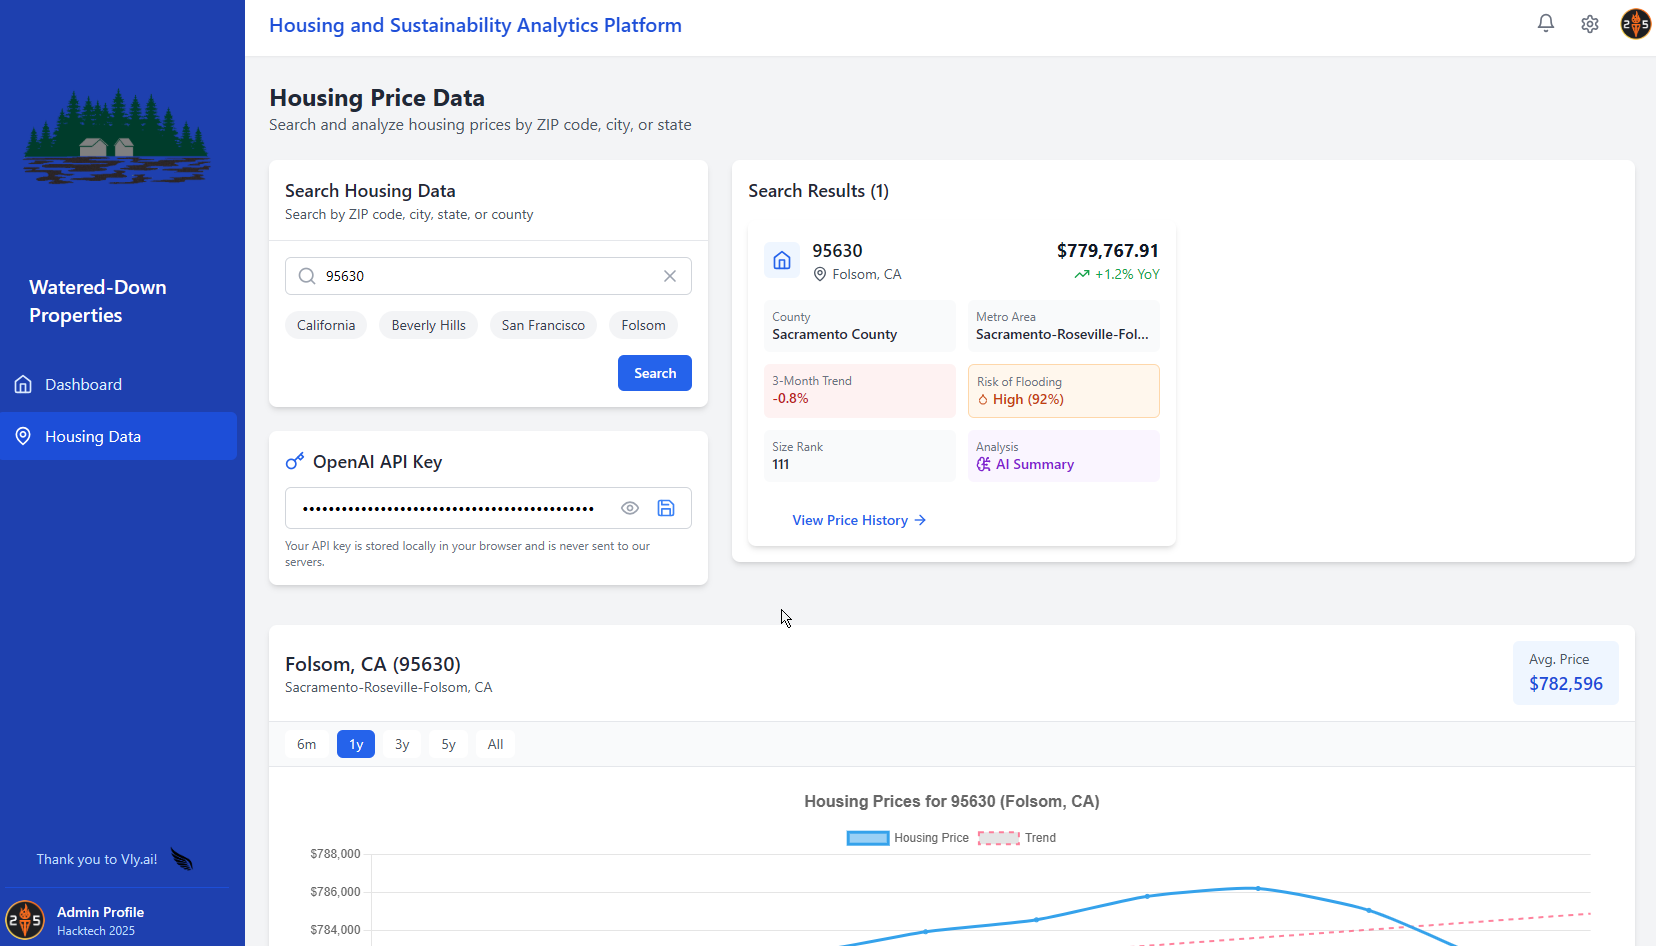
detailed Zillow housing data
-
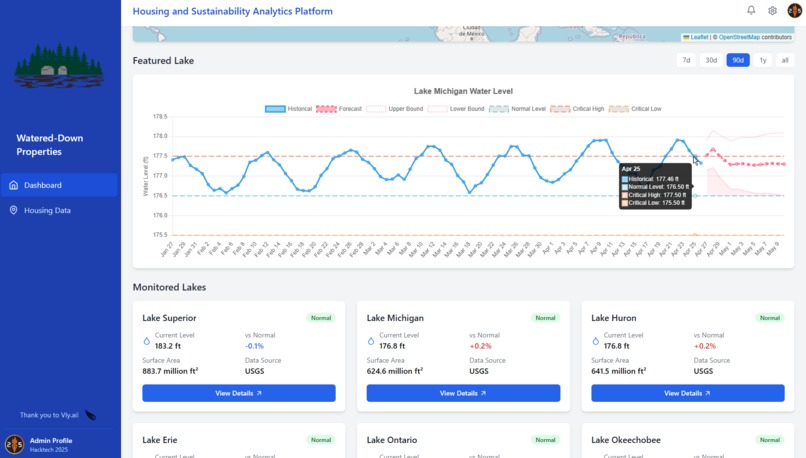
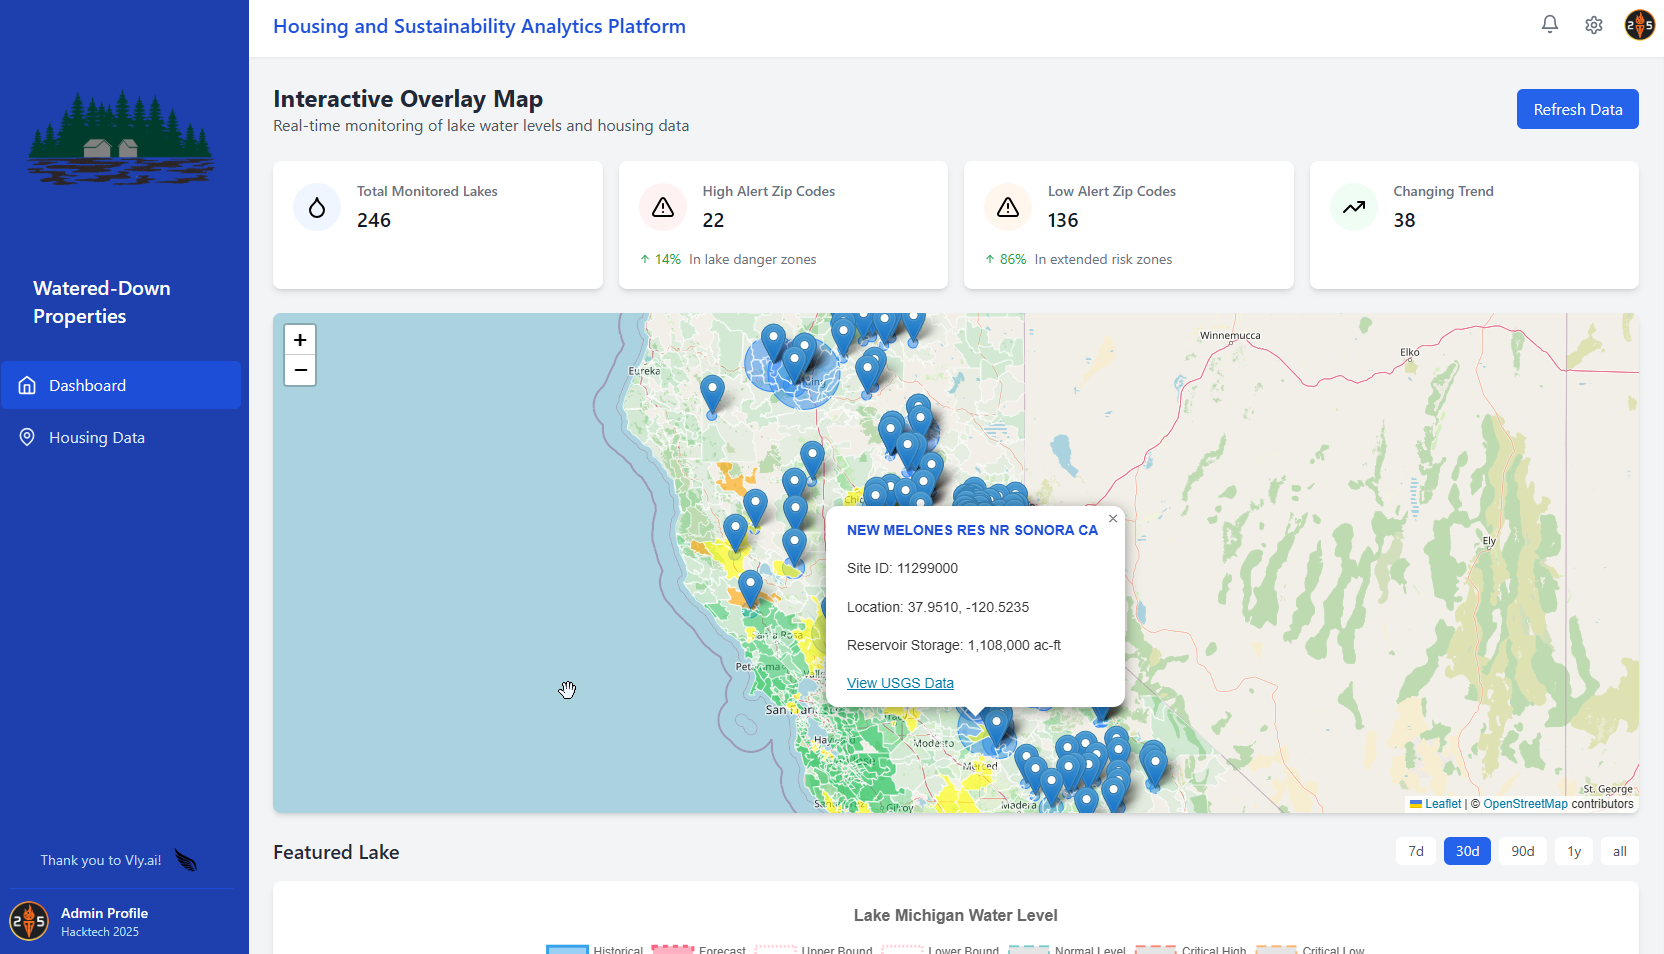
detailed USGS lake data
-
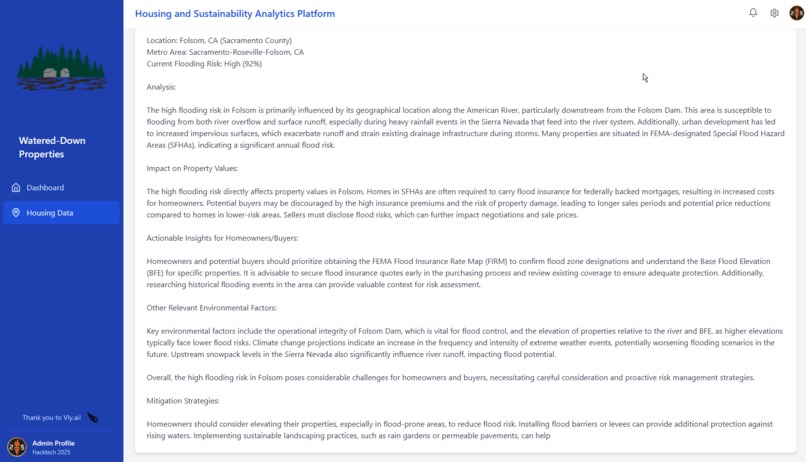
leveraging AI for insights
-
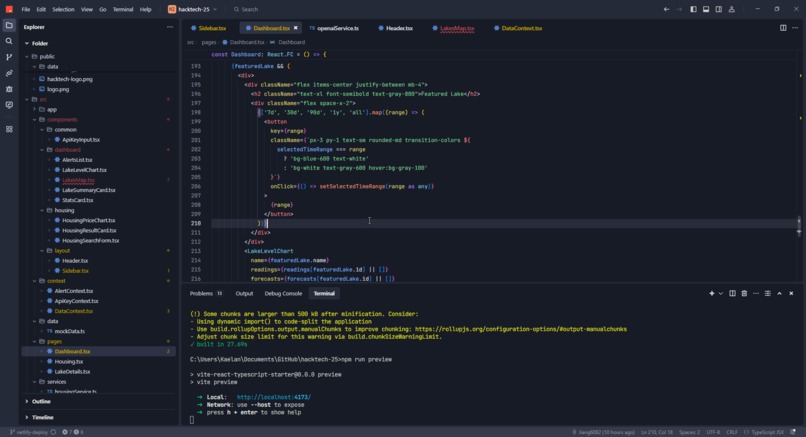
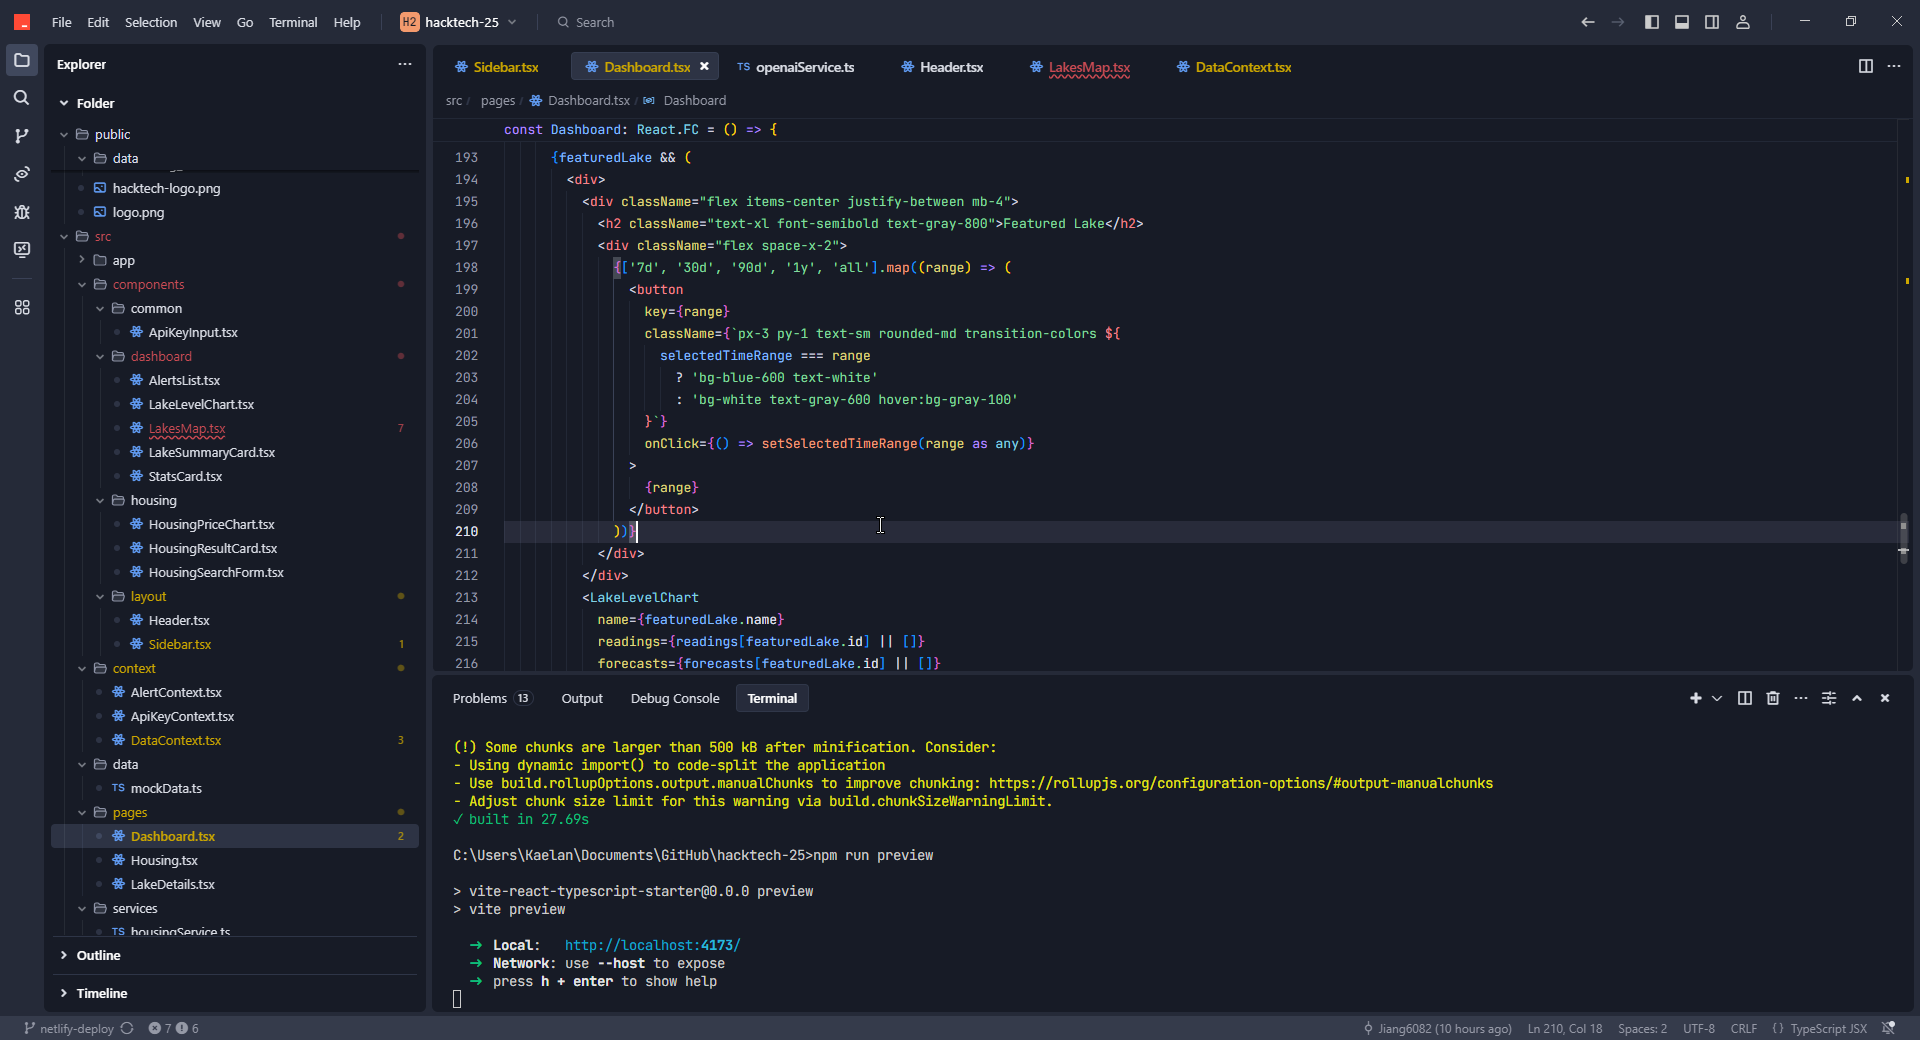
code in action
-
early development version


Project Story: Watered-Down Properties
What Inspired Us
Witnessing the growing impact of climate change on communities—from droughts draining lakes to floods eroding property values—we wanted to bridge the gap between environmental data and real estate decisions. News stories of homeowners near Lake Mead or the Great Lakes losing equity due to water crises sparked our mission: to quantify how water shapes wealth.
How We Built It
- Data Integration: Pulled real-time water-level data from USGS APIs and historical housing trends from public real estate datasets.
- Geospatial Mapping: Overlaid water bodies and zip codes.
- Frontend Dashboard: Visualized insights with React, allowing users to explore risks/opportunities by region.
What We Learned
- Latency Issues: Real-time water data requires constant syncing with slower-updating property records.
- Stakeholder Needs: Homebuyers prioritize short-term affordability; insurers care about long-term risk—a balance our tool must strike.
Challenges We Faced
- Misaligned Data Formats: USGS uses JSON, while housing data came in CSV—requiring custom pipelines. We also developed our own innovative approach in leveraging a GeoJSON file for accurate zip code borders.
- Noise vs. Signal: Isolating water’s impact from other factors (e.g., interest rates) demanded rigorous regression analysis.
- User Trust: Translating complex correlations into simple, actionable insights without oversimplifying.
The Outcome
Watered-Down Properties isn’t just a tool—it’s a lens to see the hidden ties between environment and economy. By revealing how a shrinking lake might sink a neighborhood’s value or how conservation efforts could boost equity, we empower smarter investments in a climate-uncertain world.
Built With
- javascript
- node.js
- openai
- react
- tailwind
- typescript
- usgs
- vite


Log in or sign up for Devpost to join the conversation.