-
-
Lagos LiveWell 360 Dashboard
-

-
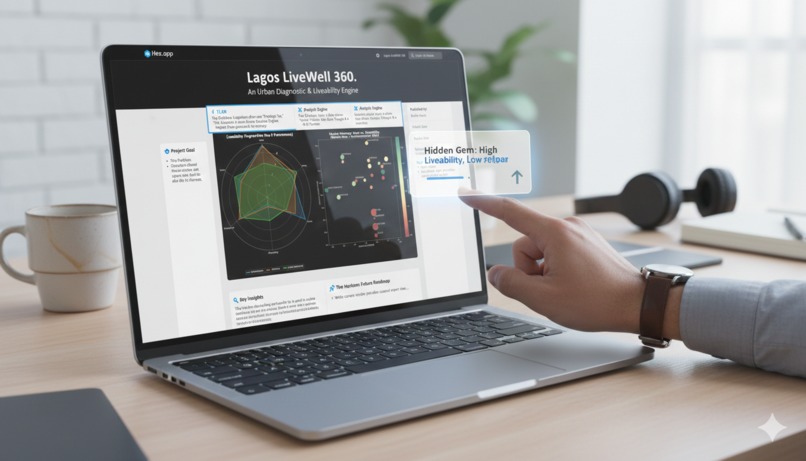
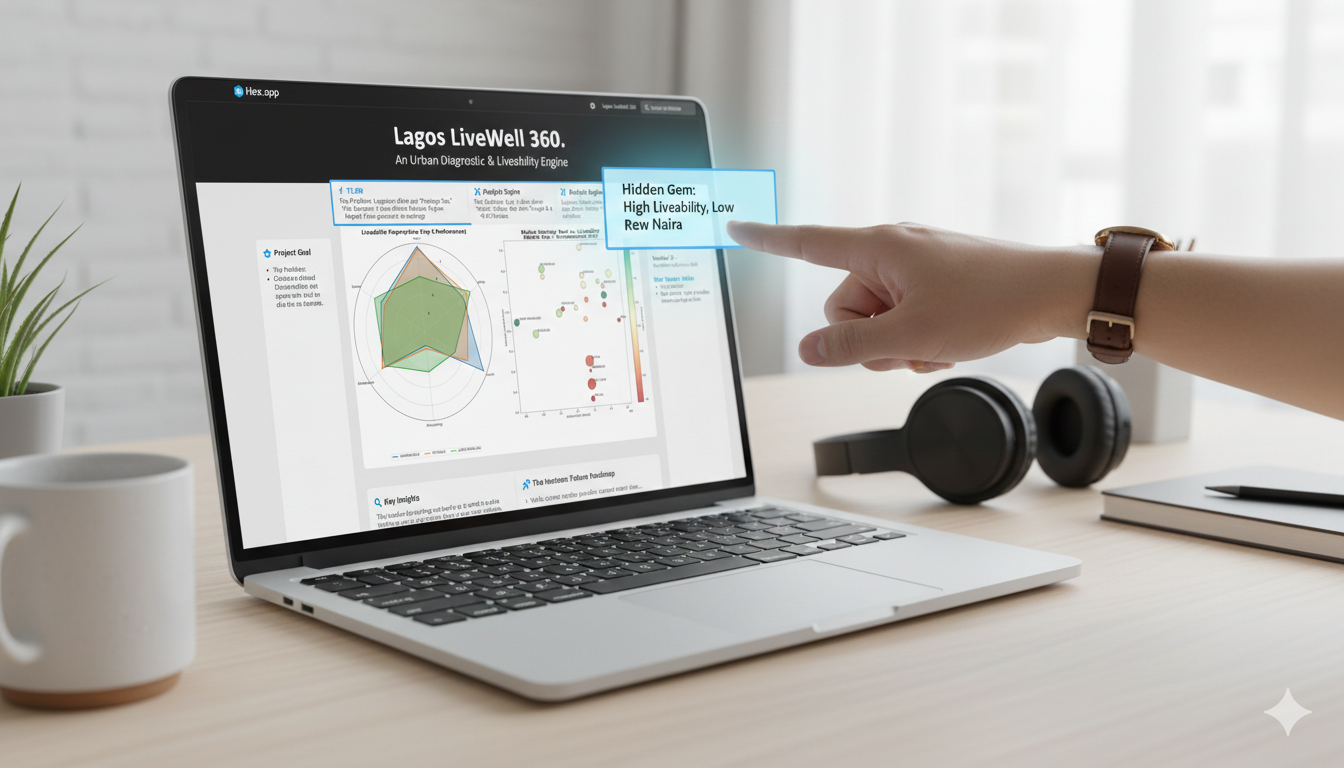
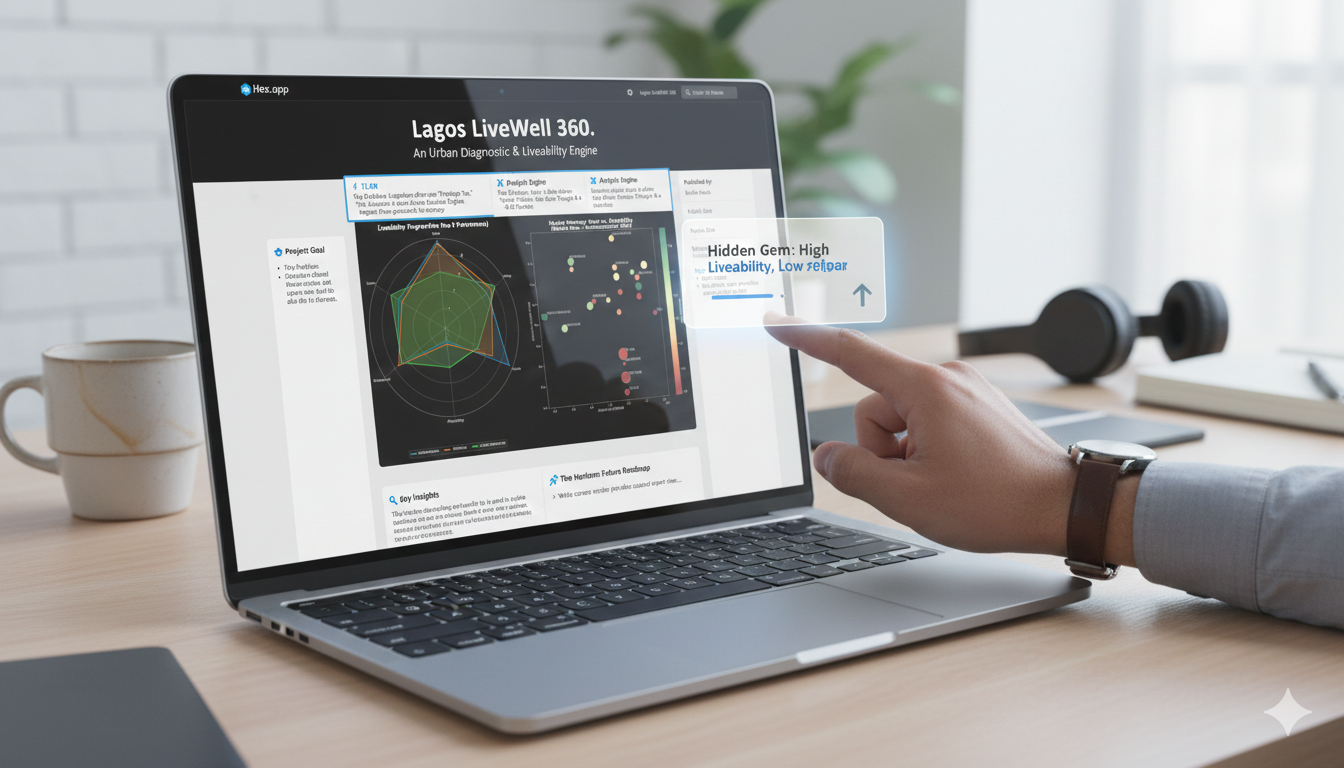
Lagos LiveWell 360: Navigating the Megacity Trade-offs
Inspiration
Lagos is a city of extremes, where limitless opportunities often coexist with daily logistical hurdles. Millions of Lagosians face a high-stakes gamble every year: “Where is it actually best to live?” Is it the prestigious address where rent consumes 60% of income, or the hidden gem neighborhood where utility is high but environmental risk is a ticking clock?
I realized that while data for Lagos exists, it is fragmented. I built the analysis I wish I had: a unified urban diagnostic engine that turns raw data into a strategic map for better living.
What It Does
Lagos LiveWell 360 is a decision engine that ingests data across six critical pillars:
- Power
- Safety
- Health
- Affordability
- Environment
- Leisure
These are combined to create a Liveability Fingerprint for the city.
Instead of a simple list, it provides:
- The LiveWell Score: A multi-criteria utility index
- The Stakeholder Matrix: A visualization of Value for Money (VFM) against Environmental Risk
- The Safety–Power Paradox: An analytical discovery showing a –0.42 correlation between infrastructure density and security vulnerability
How We Built It
The project was built entirely within Hex, leveraging its ability to blend Python-heavy logic with a refined UI.
Data Engineering
Harmonized disparate datasets, including:
- Power supply logs
- DSVA security statistics
- Healthcare facility directories
Feature Engineering
Developed custom metrics to quantify urban trade-offs:
VFM Ratio
[ \text{VFM} = \frac{\text{LiveWell Score}}{\text{Rent} / 1{,}000{,}000} ]Fragility Index
[ \text{Fragility} = \text{LiveWell Score} - \text{Environmental Resilience} ]
Visualization
Using matplotlib and numpy, I built:
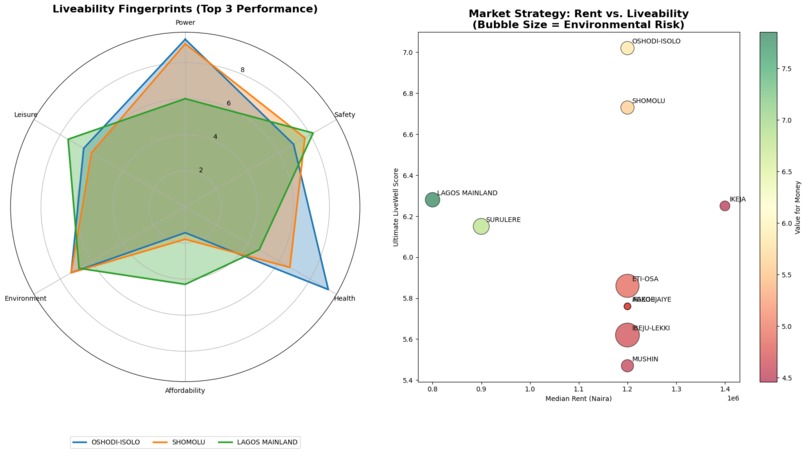
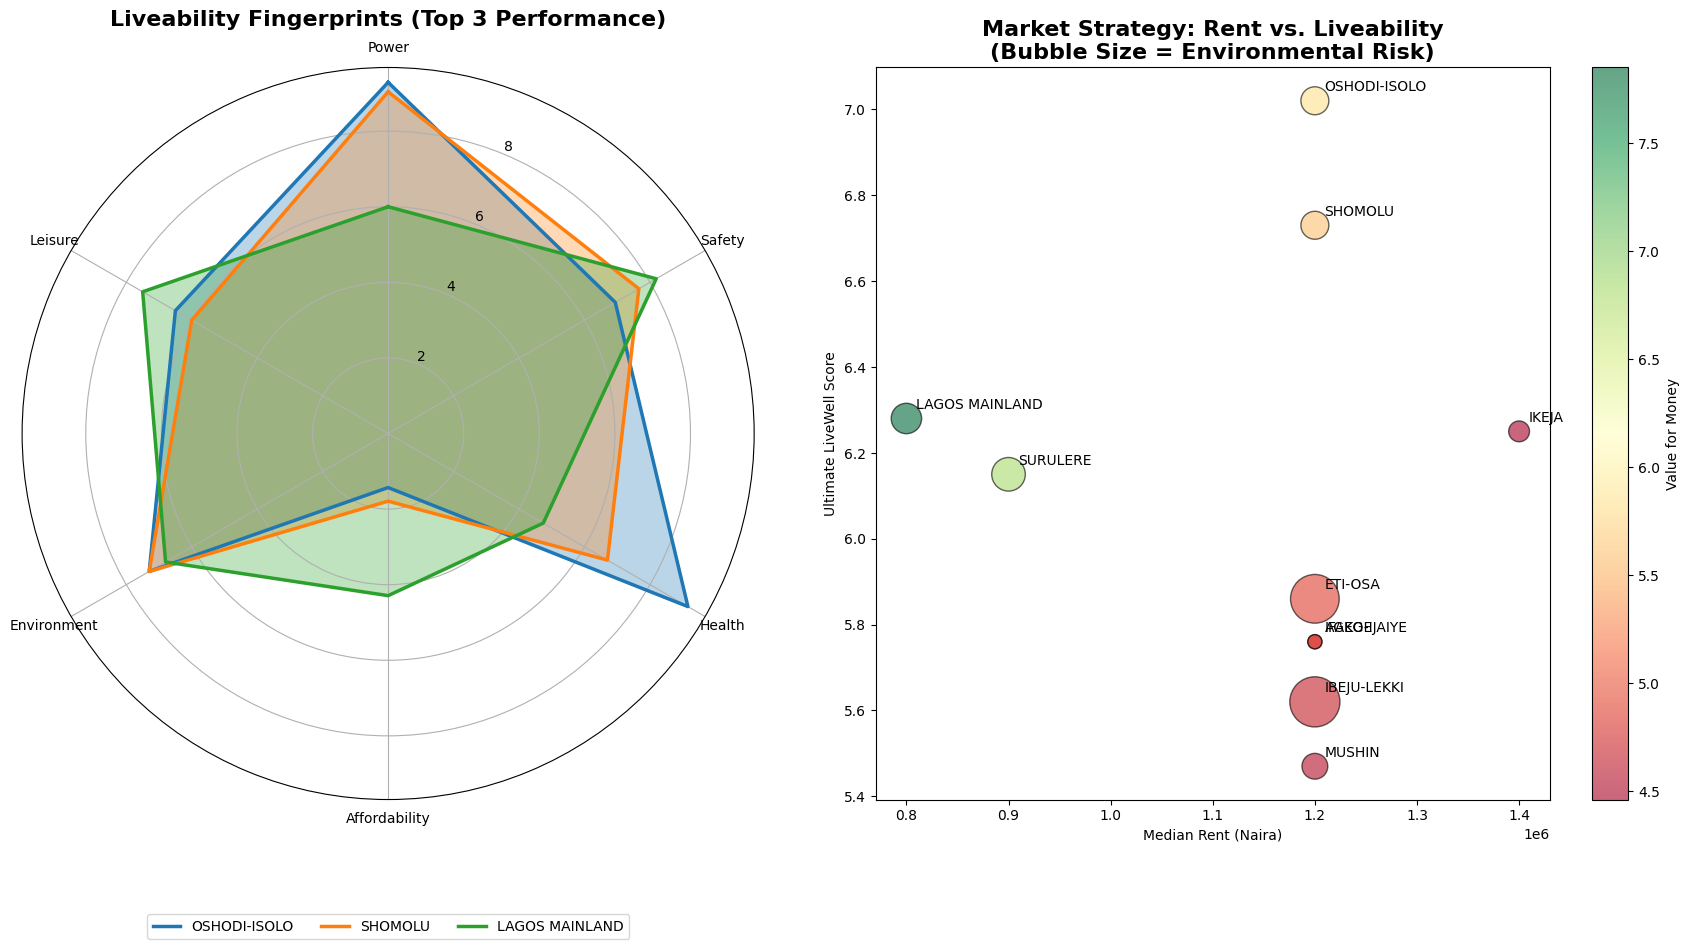
- Radar Charts to visualize the personality of each LGA
- Bubble Charts to map market strategy and risk
Challenges We Ran Into
The biggest hurdle was data normalization. Comparing:
- Average Hours of Power (0–24),
- Crime Statistics, and
- Rent (millions of Naira)
required a robust scaling logic to ensure no single pillar unfairly dominated the final index.
Another challenge was the Safety–Power Paradox. Initially, the data appeared counter-intuitive. However, the model revealed that high-infrastructure hubs act as magnets for vulnerability. This pivot—from data error to social insight—became the project’s most significant finding.
Accomplishments That We’re Proud Of
I moved the needle from “What is the data?” to “So what does it mean?”
Key achievements include:
- Identifying the Hidden Gem Triangle—Oshodi-Isolo, Shomolu, and Lagos Mainland—as the city’s top performers for utility-to-rent value
- Flagging prestigious areas as Fragile Giants (high value but high environmental risk), providing a new lens for urban resilience planning
What We Learned
Building in Hex taught me the power of Iterative Analytics. AI-powered exploration made it possible to test correlations quickly, leading to the discovery of the –0.42 relationship that redefined the project.
I learned that liveability isn’t a single number—it is a delicate balance of trade-offs.
What’s Next for Lagos LiveWell 360
The vision is to evolve this into a Live Semantic Model:
Real-time API Integration
Live traffic data and power grid stability reportsConversational AI
Natural language queries such as:
“Where should I put my office with a ₦2M budget?”Pan-African Scaling
Extending the framework to help residents and investors navigate Nairobi, Accra, and Johannesburg
Project Origin
Built from scratch for the Hex-a-thon, Lagos LiveWell 360 addresses the unique urban challenges of Lagos using previously fragmented datasets.
Data Sources
- Power Reliability: Aggregated LGA-level utility logs (2024)
- Security & Safety: Domestic & Sexual Violence Agency (DSVA) statistics
- Healthcare: Lagos State Health Facility Directory
- Housing Market: Median rental price tracking (2025/2026 projections)
- Environmental Risk: Lagos State Flood Vulnerability Maps

Log in or sign up for Devpost to join the conversation.