Inspiration
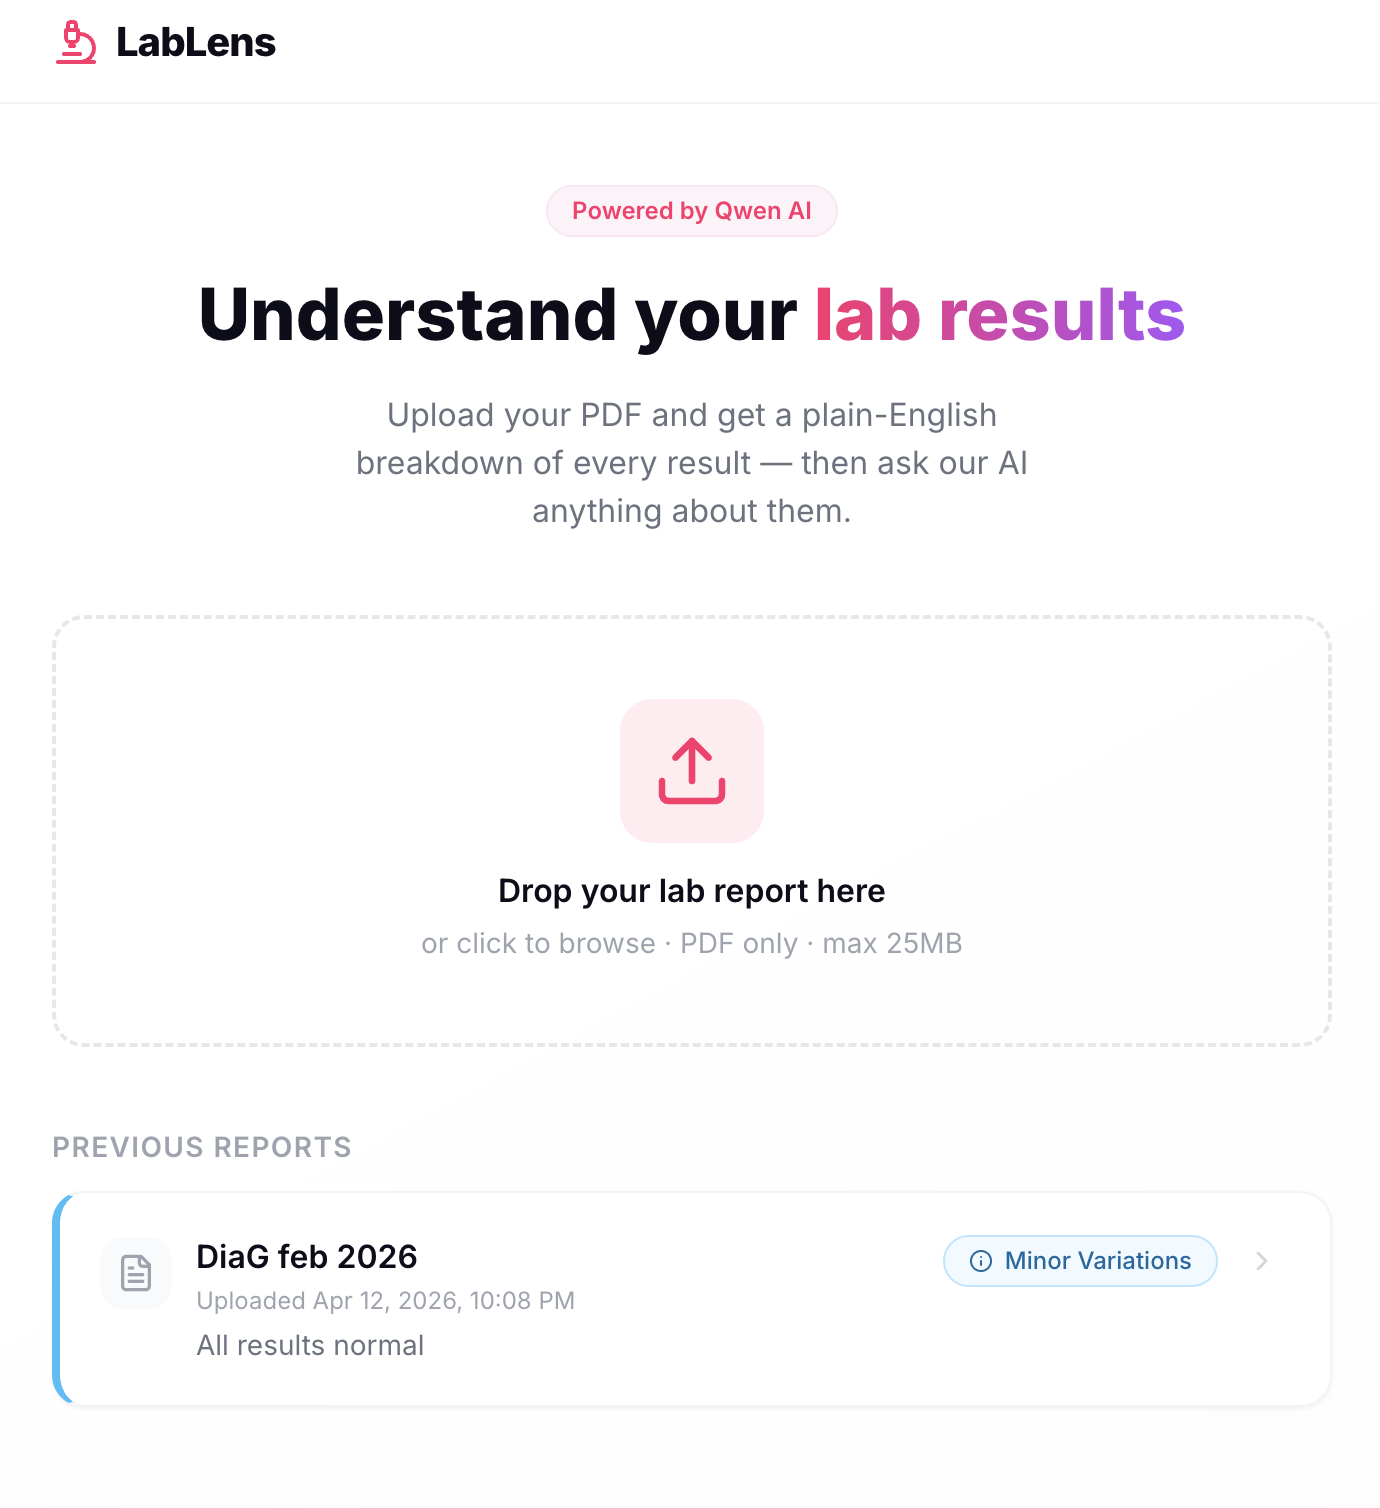
We resonated with Elfie's Healthcare Challenge #3. Reading a lab report is stressful. Not because the results are bad, but because most people have no idea what they mean. Reference ranges, units, acronyms, it's a wall of numbers designed for clinicians, not patients. We wanted to build something that takes that PDF and gives you back one clear answer: here's what needs your attention, and here's why.
We built LabLens for the Elfie Healthcare Track to make lab results genuinely understandable for anyone, regardless of their medical background.
What it does
LabLens takes a patient's lab report PDF (in multi-language), analyzes every test result using Qwen AI, and surfaces only the findings that matter. Upload your PDF, wait a couple of minutes, and you get:
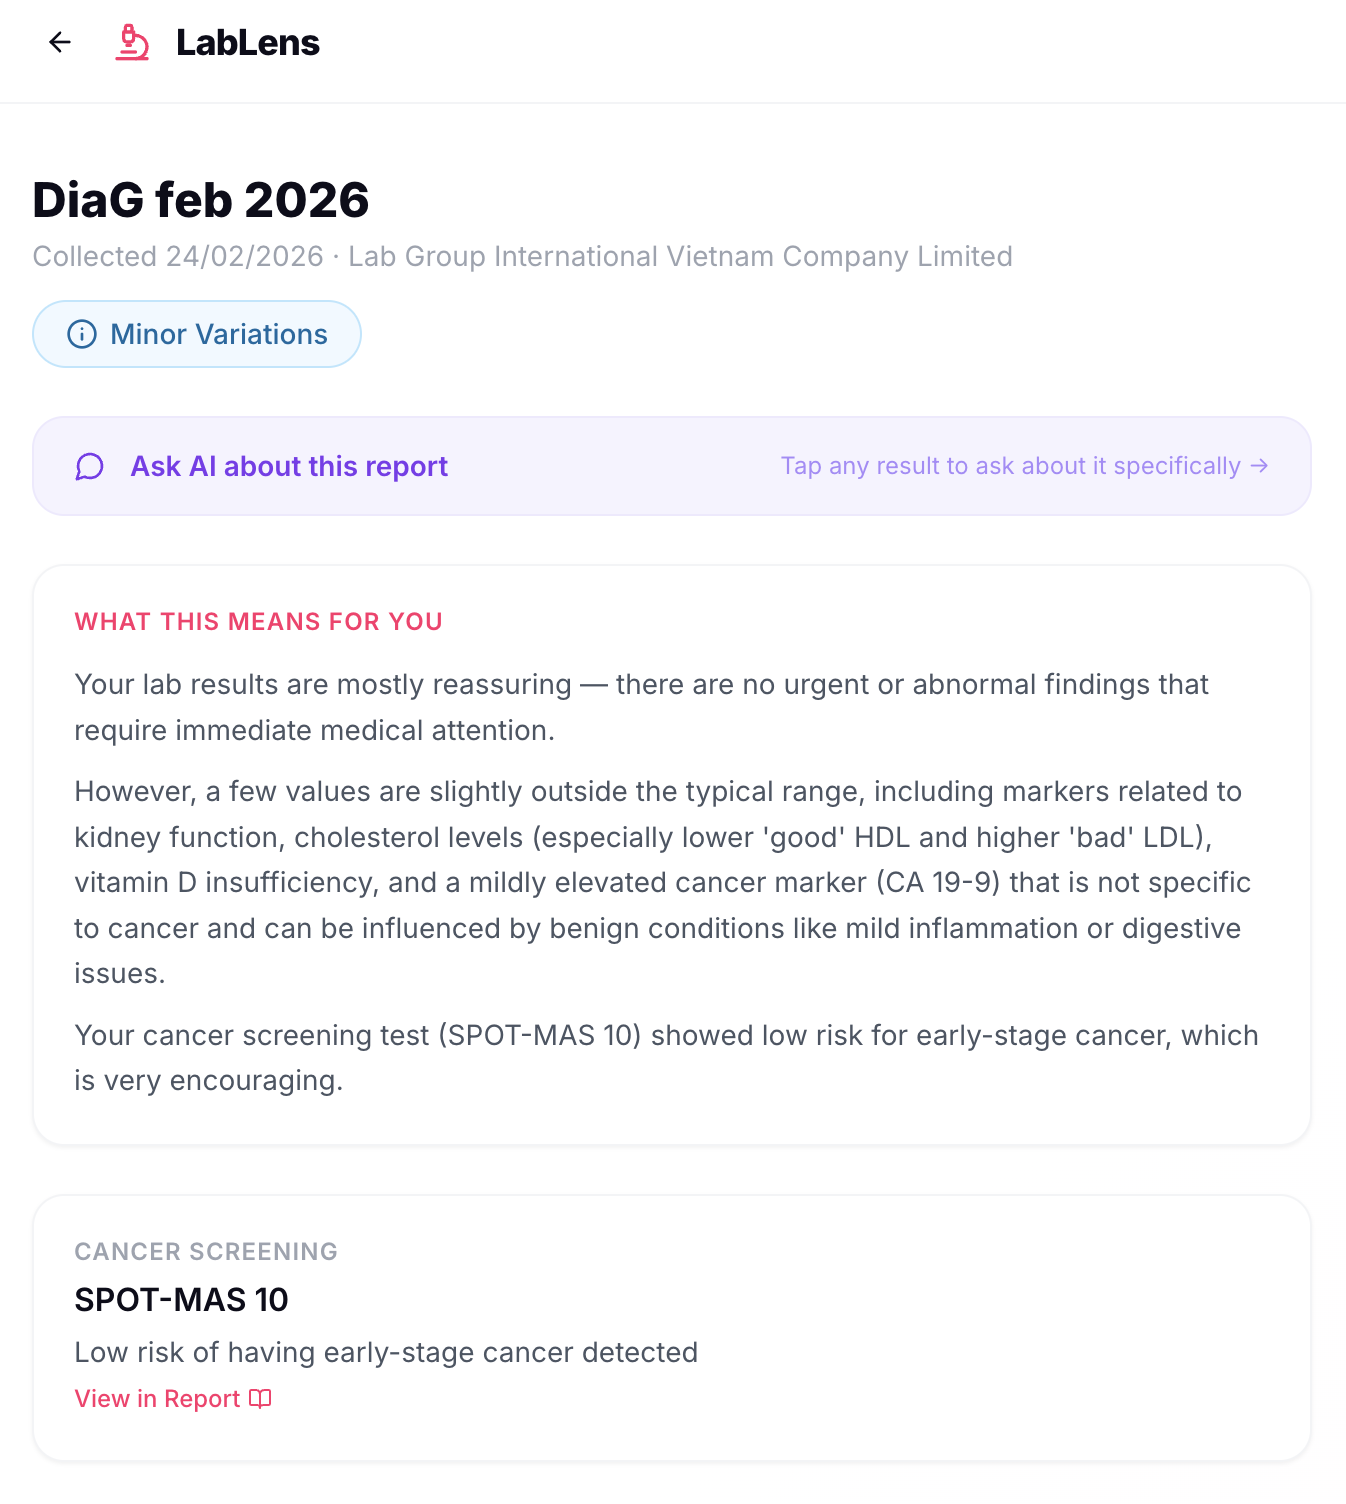
- A list of flagged results (abnormal or critical), grouped by category and severity
- A summary of what those results mean for you
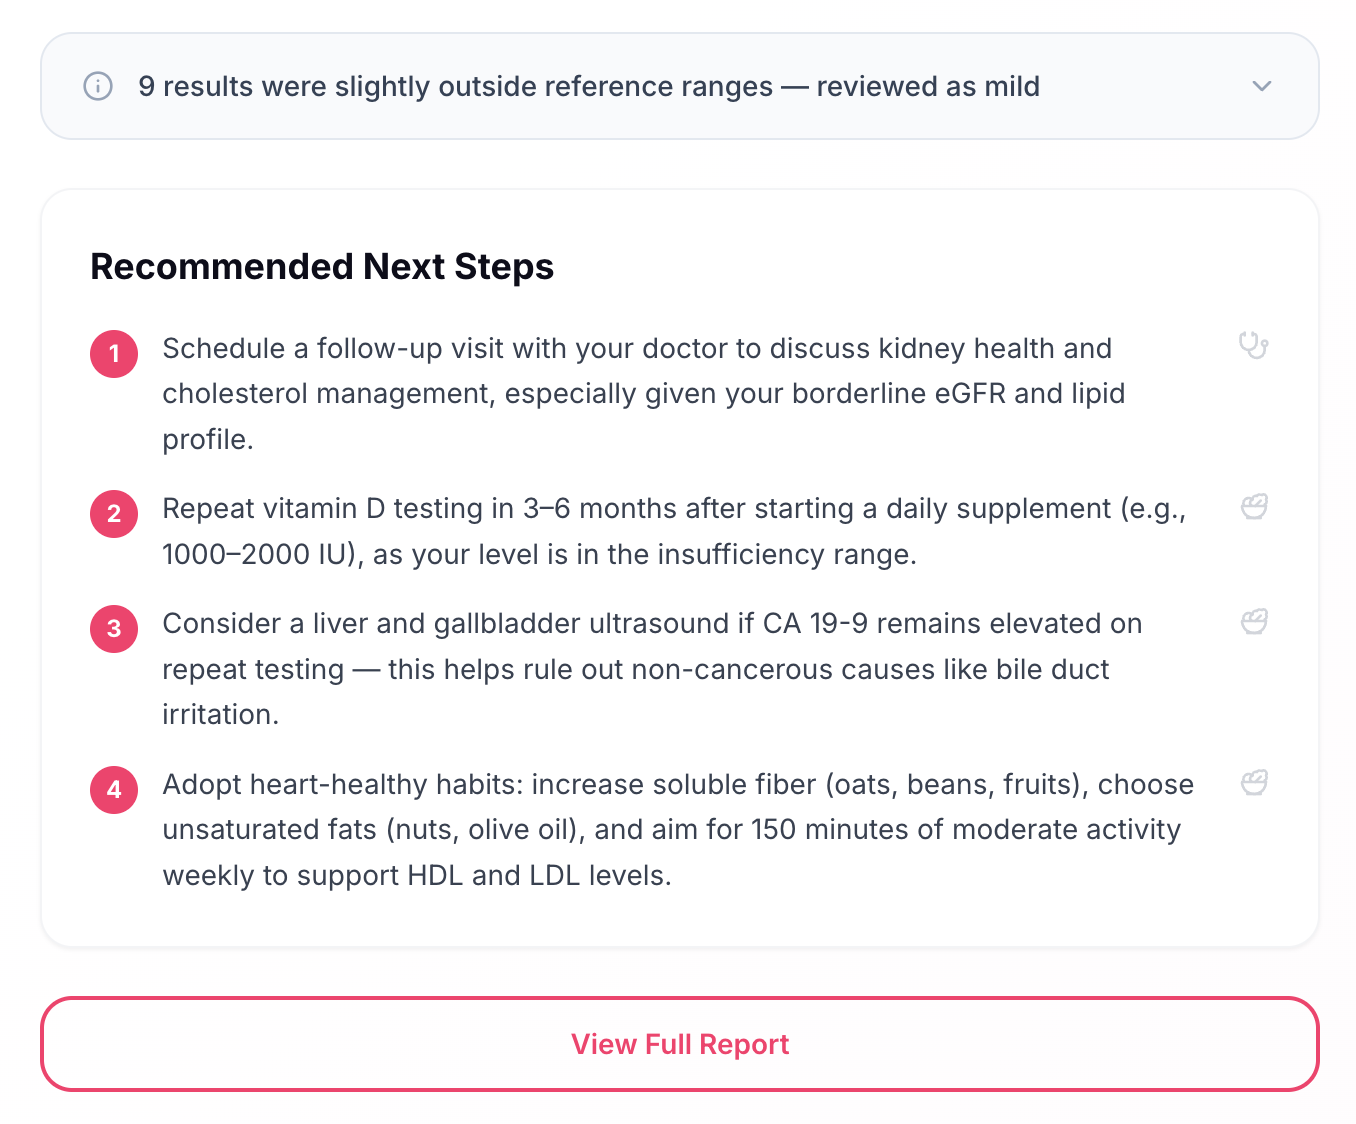
- Recommended next steps
- A cancer screening summary (if present)
- Direct links to the relevant page in the original PDF for every finding
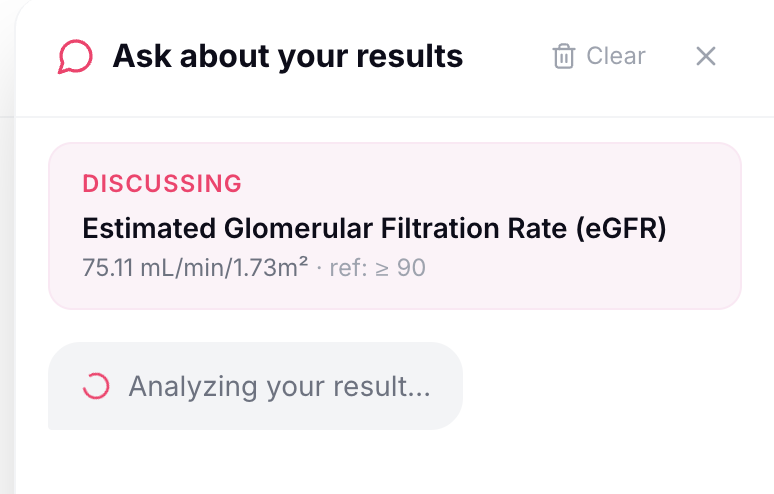
- A built-in AI chat to ask follow-up questions about your results
- Normal results are intentionally hidden, if everything is fine, we tell you that too.
How we built it
Frontend: React + Vite, styled with Tailwind CSS and shadcn/ui. PDF rendering uses PDF.js for in-browser page navigation.
Backend: Python serverless functions on Vercel. PDFs are parsed with PyMuPDF, scanned pages are rendered as high-resolution JPEG images and sent to Qwen's vision model; text-based pages are sent as plain text.
AI pipeline: We use Qwen's multimodal model (qwen-vl-max). Pages are split into overlapping 3-page chunks and processed in parallel, then merged and deduplicated. Every extracted result passes through a deterministic Python range verifier before anything is shown to the user. Ambiguous edge cases trigger a focused secondary qwen-plus call. The patient summary is generated last only after all verification is complete.
Challenges we ran into
Scanned PDFs: The blood panel pages were scanned images, not text (most likely due to redaction of PII). PyMuPDF returned near-zero characters. We solved this by detecting low-text pages and routing them through Qwen's vision model instead.
Dense table structures in scanned images: Lab reports have dozens of test results into tightly formatted tables, small fonts, thin borders, stacked rows, dual-unit columns. All rendered as scanned images rather than selectable text. Early attempts with lower-resolution images caused the model to misread numeric values, confuse adjacent rows, and sometimes skip results entirely. We solved this in two ways: switching to qwen-vl-max (more capable vision model) for significantly better table comprehension, and rendering scanned pages at 3× zoom (~216 DPI) instead of the default resolution to give the model more legible input. Higher resolution directly improved extraction accuracy on dense multi-column tables.
Complex range formats: DiagLab uses stacked dual-unit values (0.92 / 36 mmol/L / mg/dL) and multi-tier risk ranges (Low-risk: ≥ 1.55 / High-risk: < 1.04). We built a custom Python parser to handle every format, with unit conversion as a fallback.
Attention dilution at scale: Sending all pages of a lab report in one call caused the model to miss results. Splitting into overlapping 3-page chunks processed in parallel was ~30% faster and more accurate. Smaller context windows forced more careful attention on each section.
Accomplishments that we're proud of
- A two-layer verification pipeline (deterministic Python + secondary AI call) that makes the output genuinely trustworthy for a medical context
- The chunked parallel architecture that improved both speed and accuracy — a result we didn't expect going in
- Handling real-world lab report complexity: scanned pages, dual-unit values, multi-tier risk ranges, multilingual reports — all from a single PDF upload
- The full product shipping end-to-end: upload, analyze, view, chat, persist — in a clean patient-facing UI
What we learned
We learned that LLMs are great for solving problems where you have lots of unstructured data (like Lab report PDFs), and running it through an LLM to generate structured data.
What's next for LabLens
Trend tracking: Compare results across multiple reports over time — show whether your cholesterol is improving or your kidney function is declining

Log in or sign up for Devpost to join the conversation.