-
-
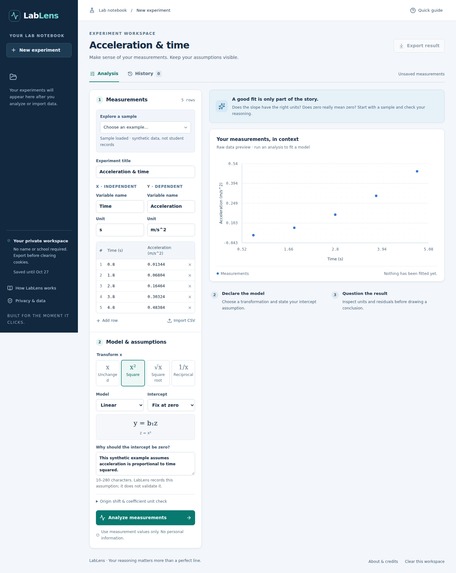
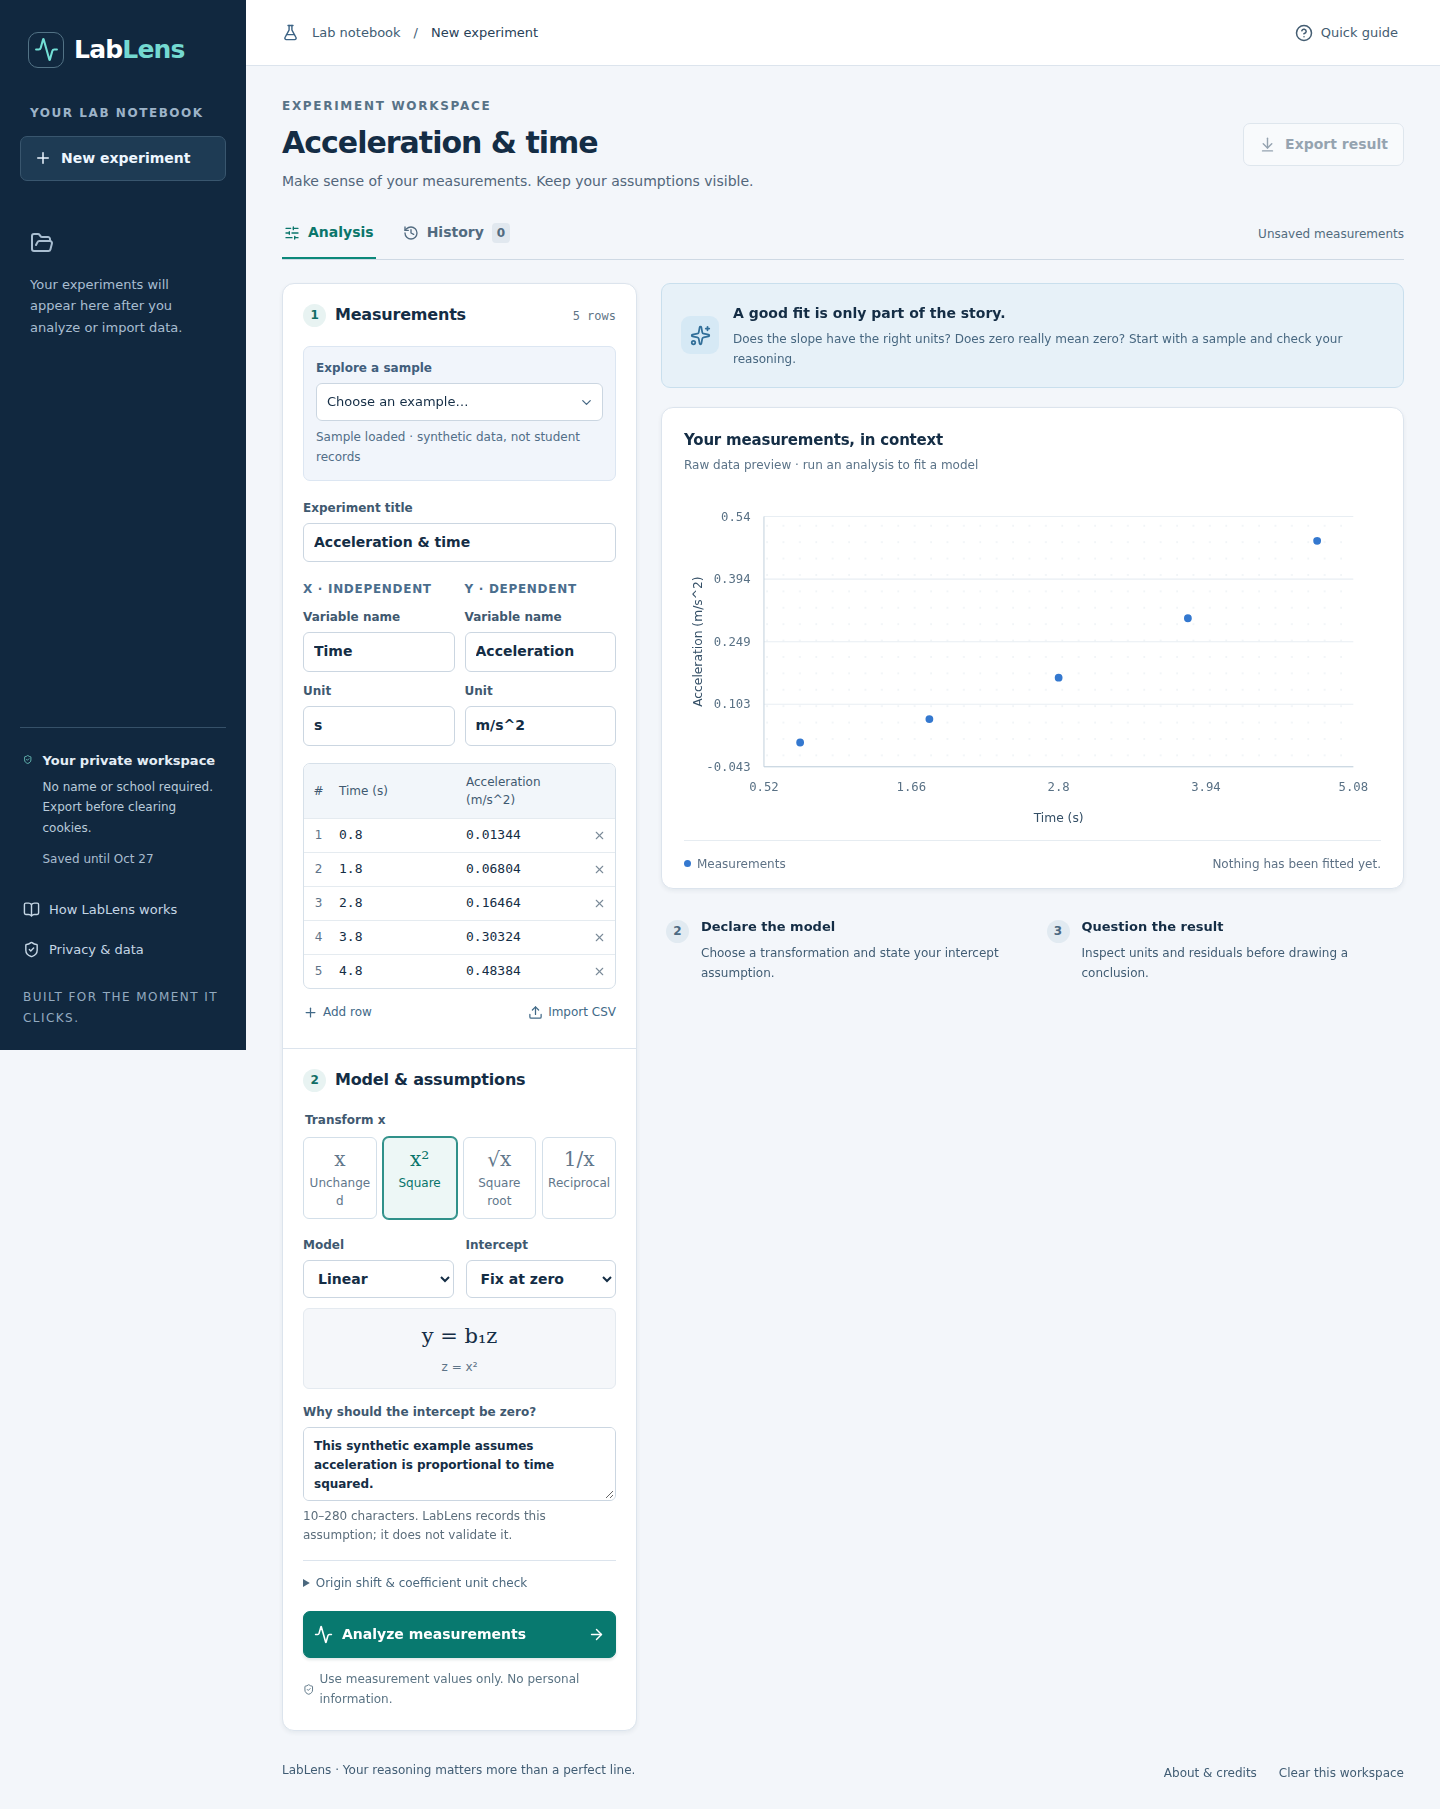
A student enters synthetic measurements, units, and a model before analyzing a lab graph.
-
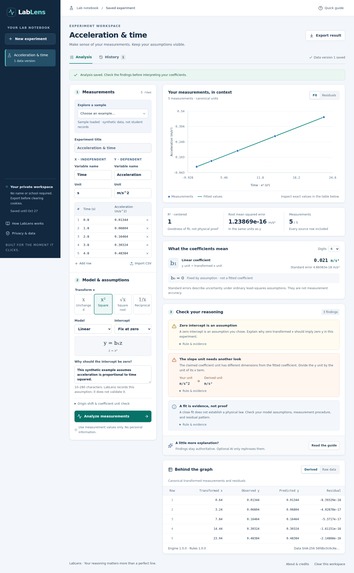
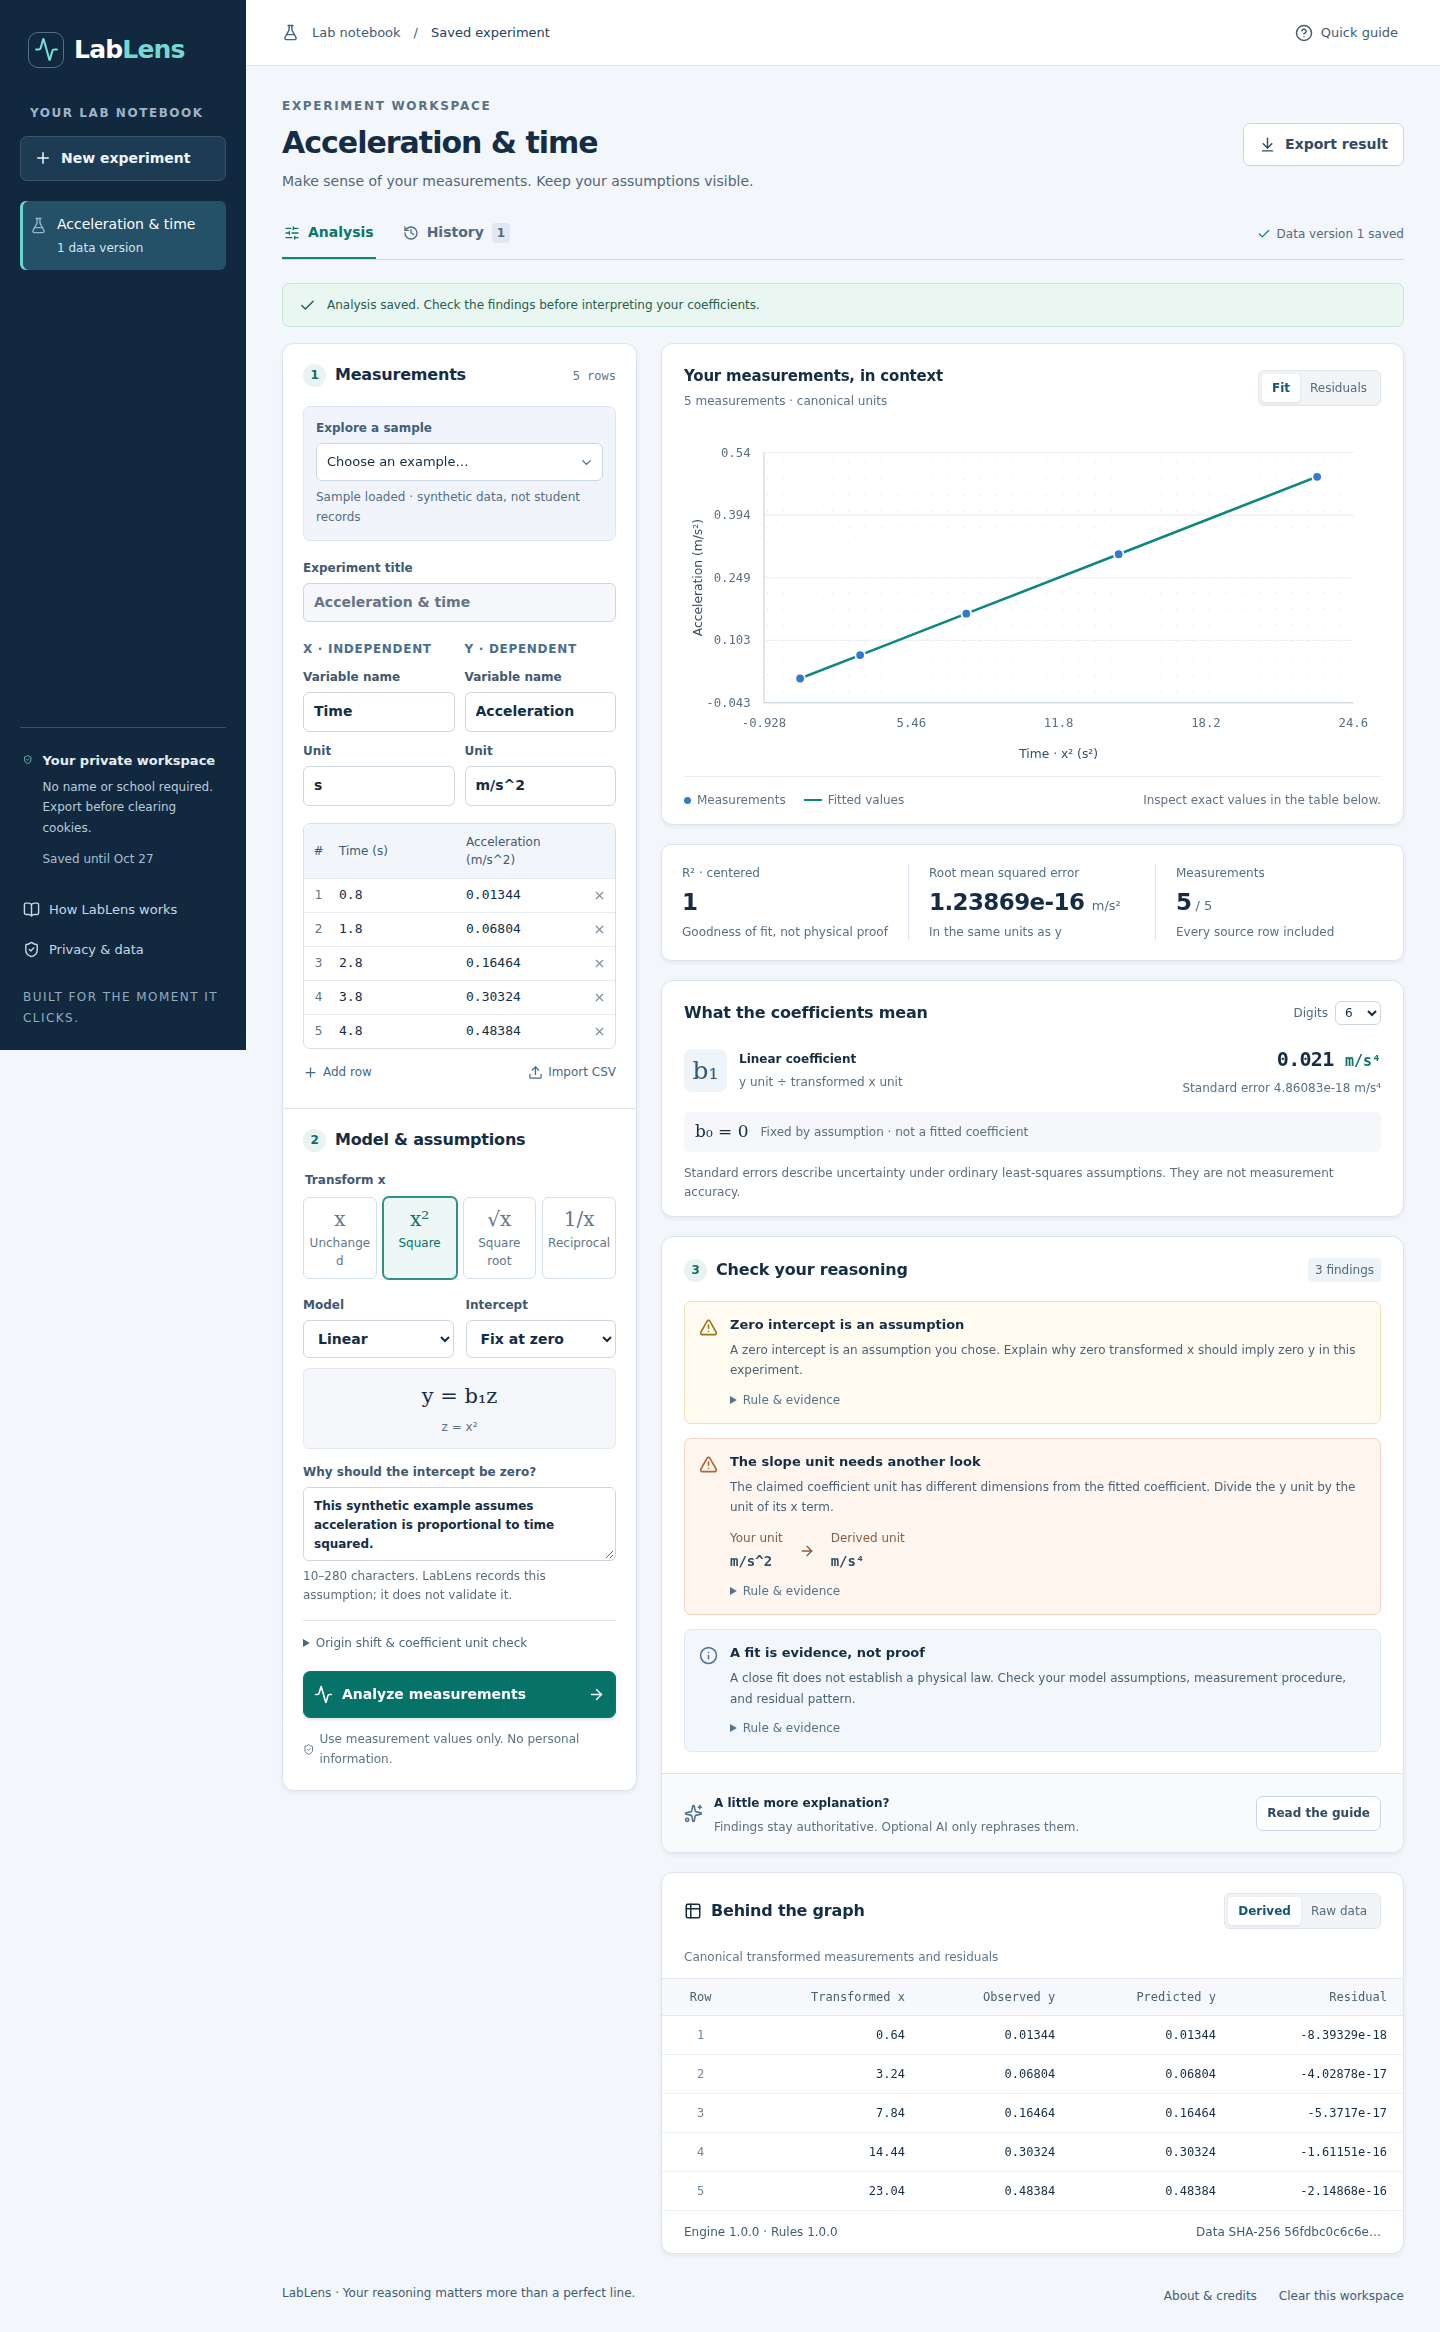
LabLens fits transformed data, derives a 0.021 m/s⁴ coefficient, and flags assumptions and unit mismatches.
-

The same analysis and reasoning checks remain accessible on a narrow mobile screen.
-
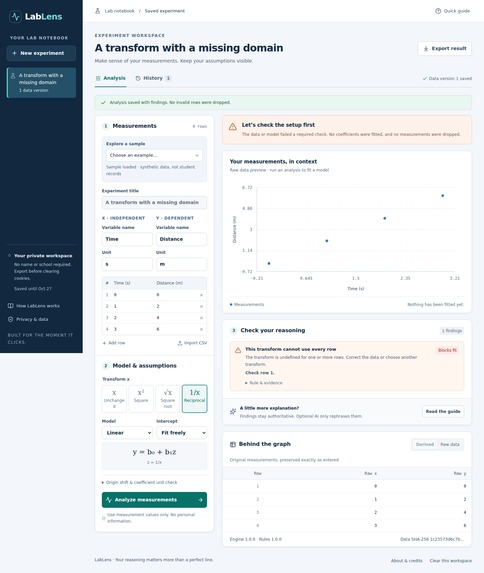
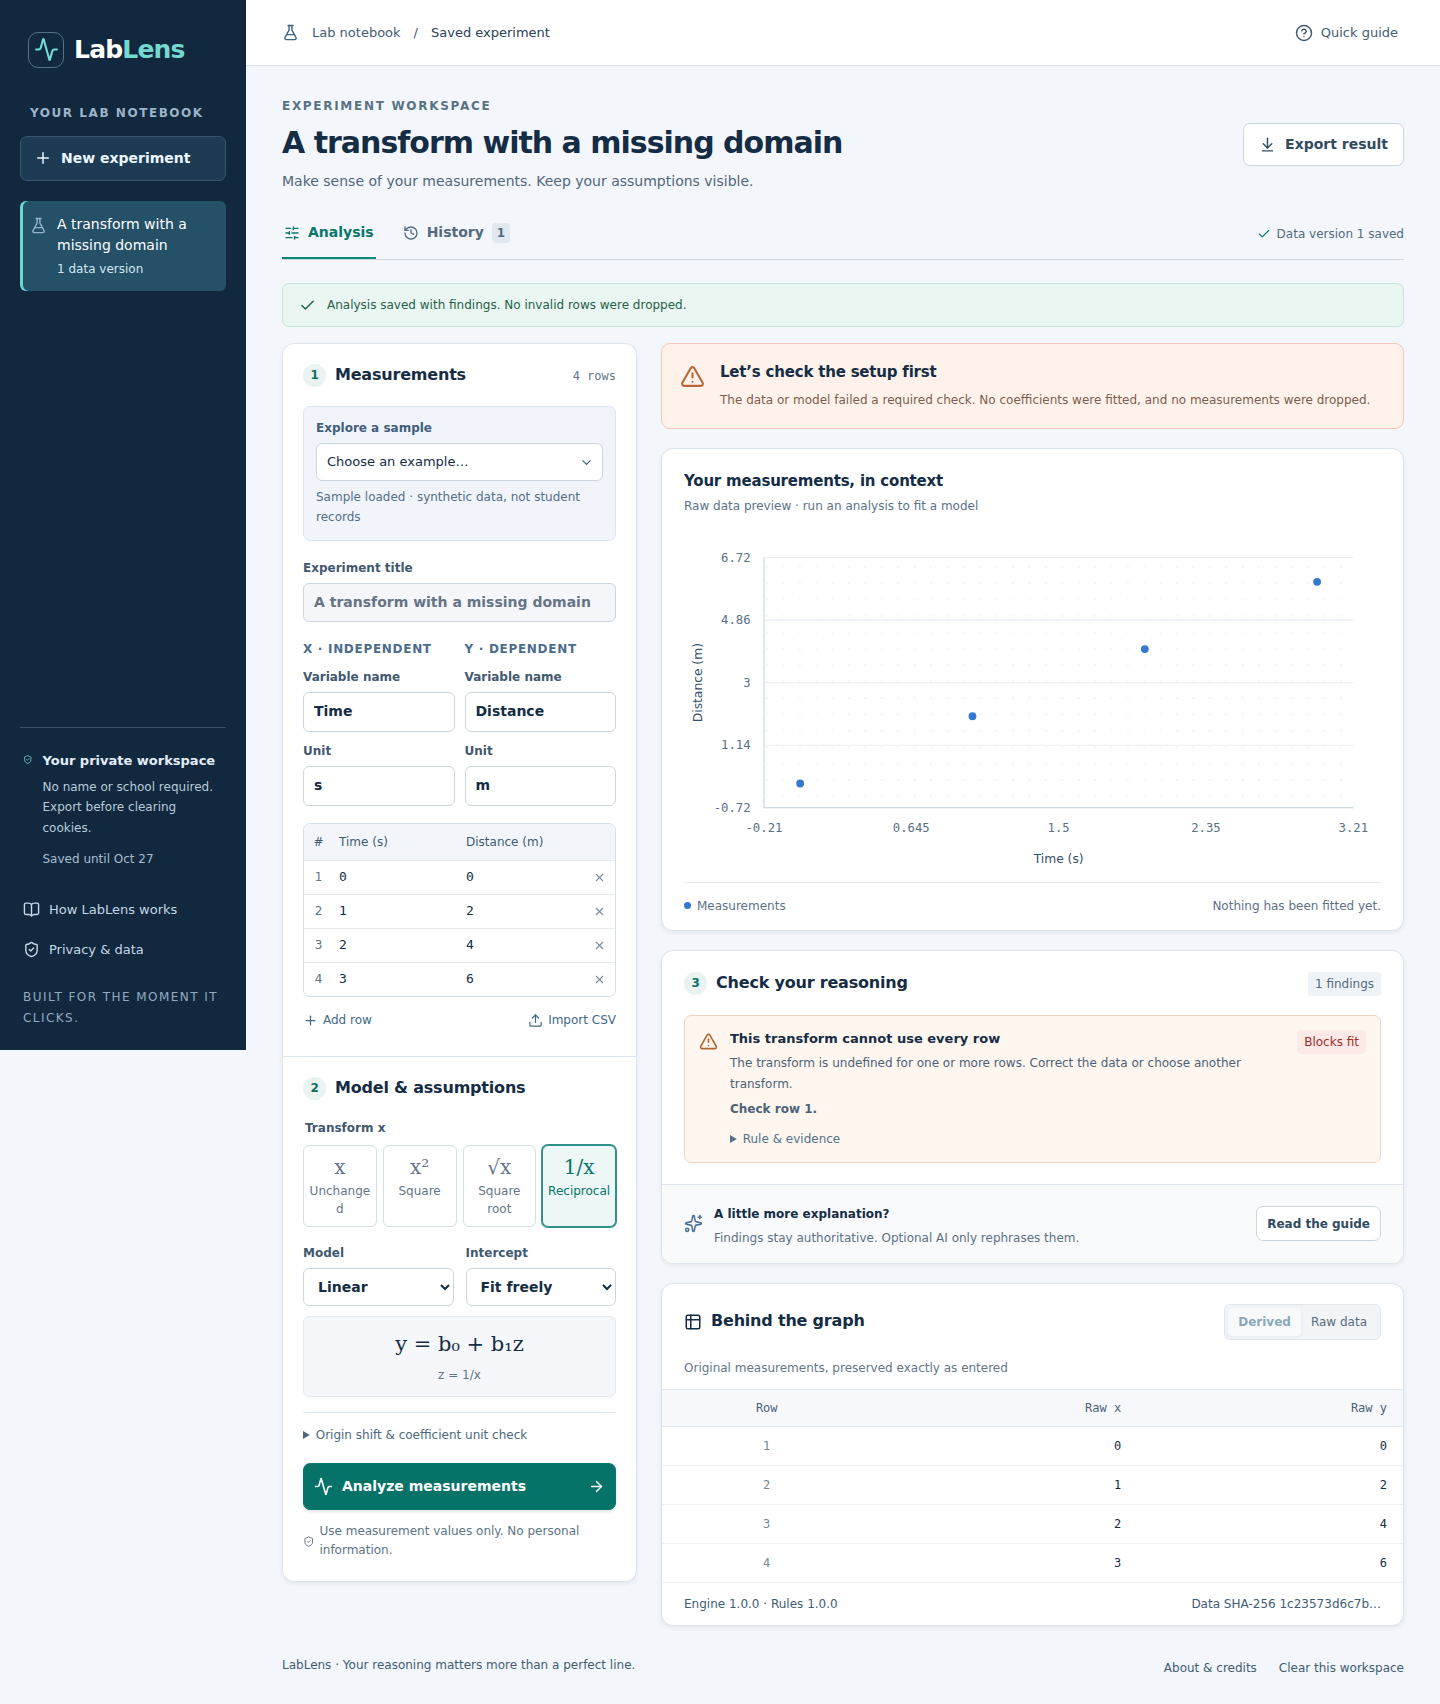
A reciprocal transform at x = 0 is undefined, so LabLens blocks the fit without dropping or changing data.
-
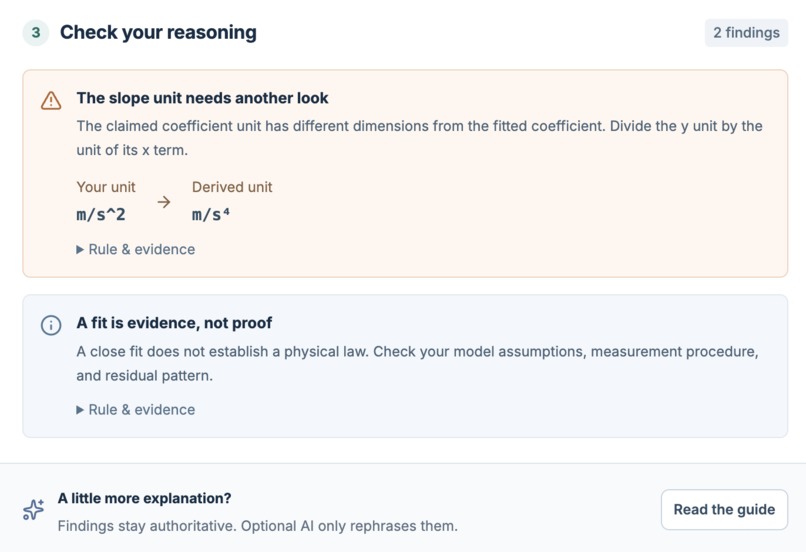
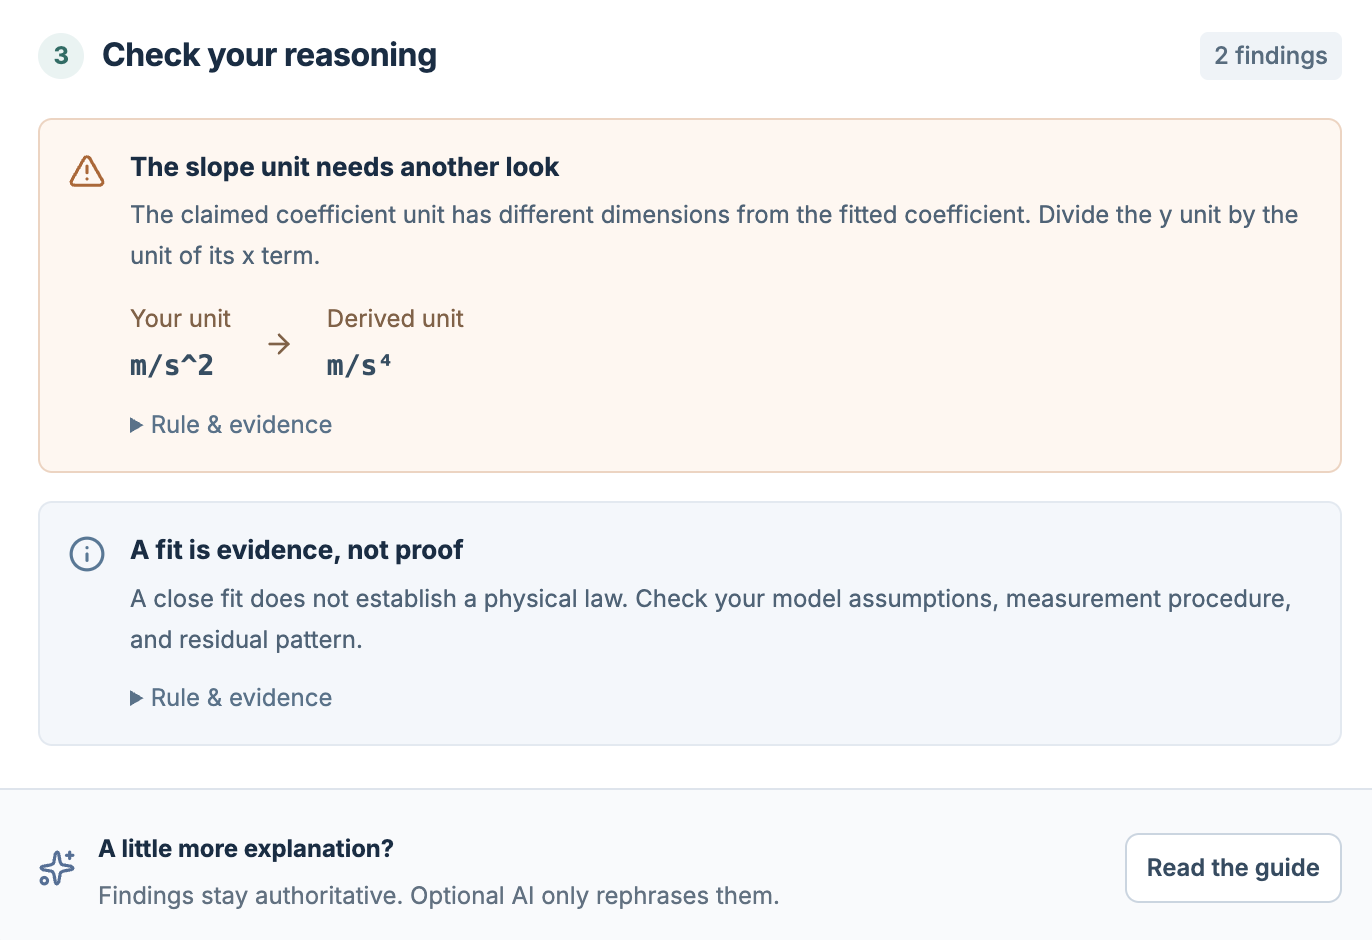
LabLens spots a claimed m/s² slope unit where the coefficient requires m/s⁴; a good fit is not proof.
-
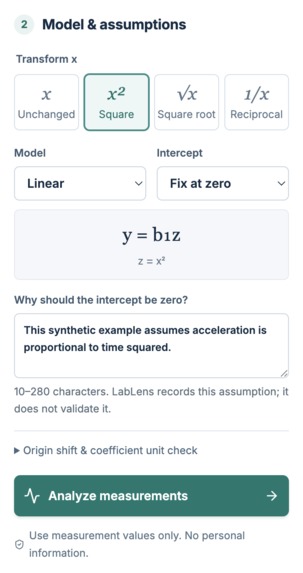
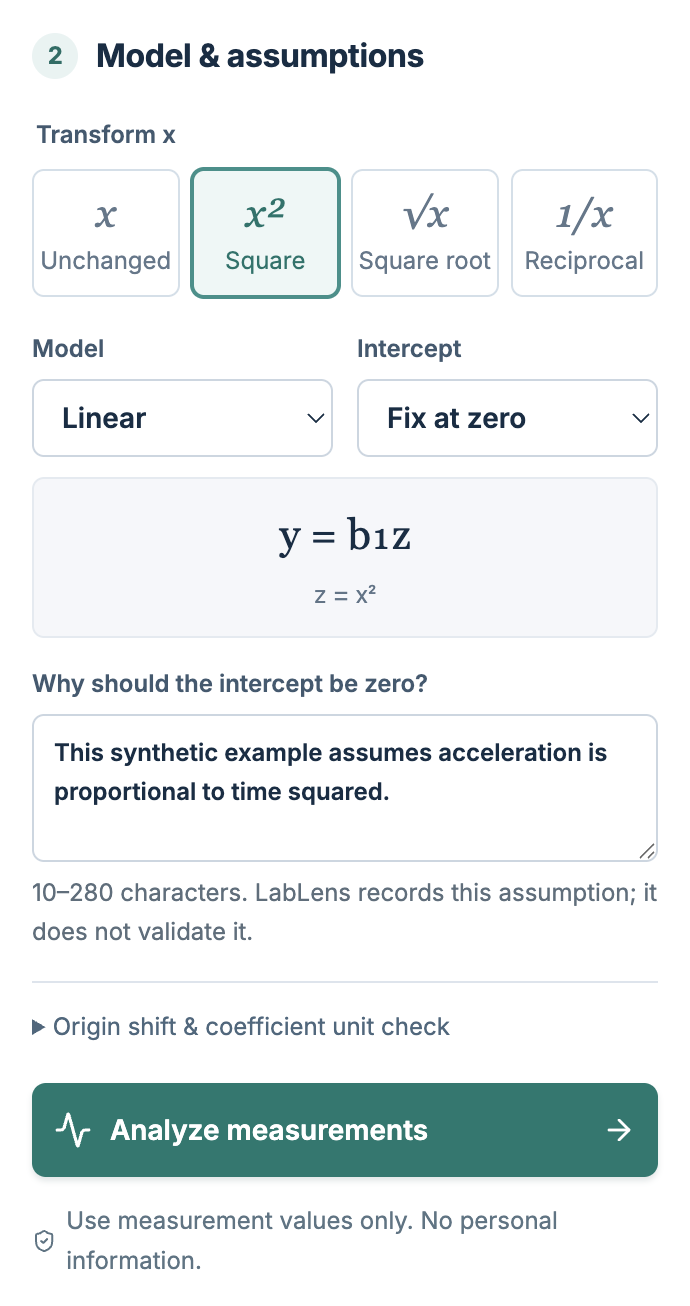
Students select a transformation and intercept, record an assumption, then run the analysis.
-
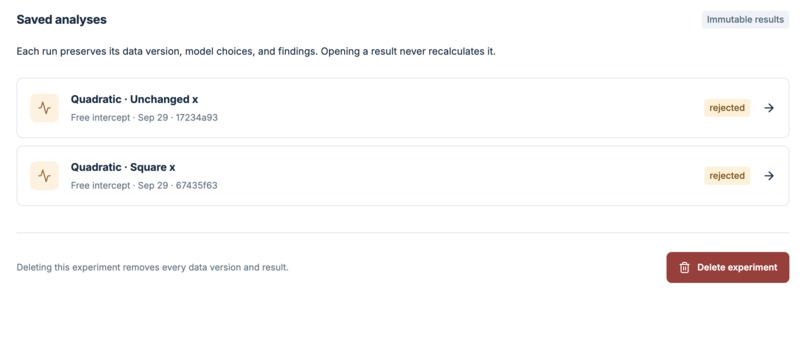
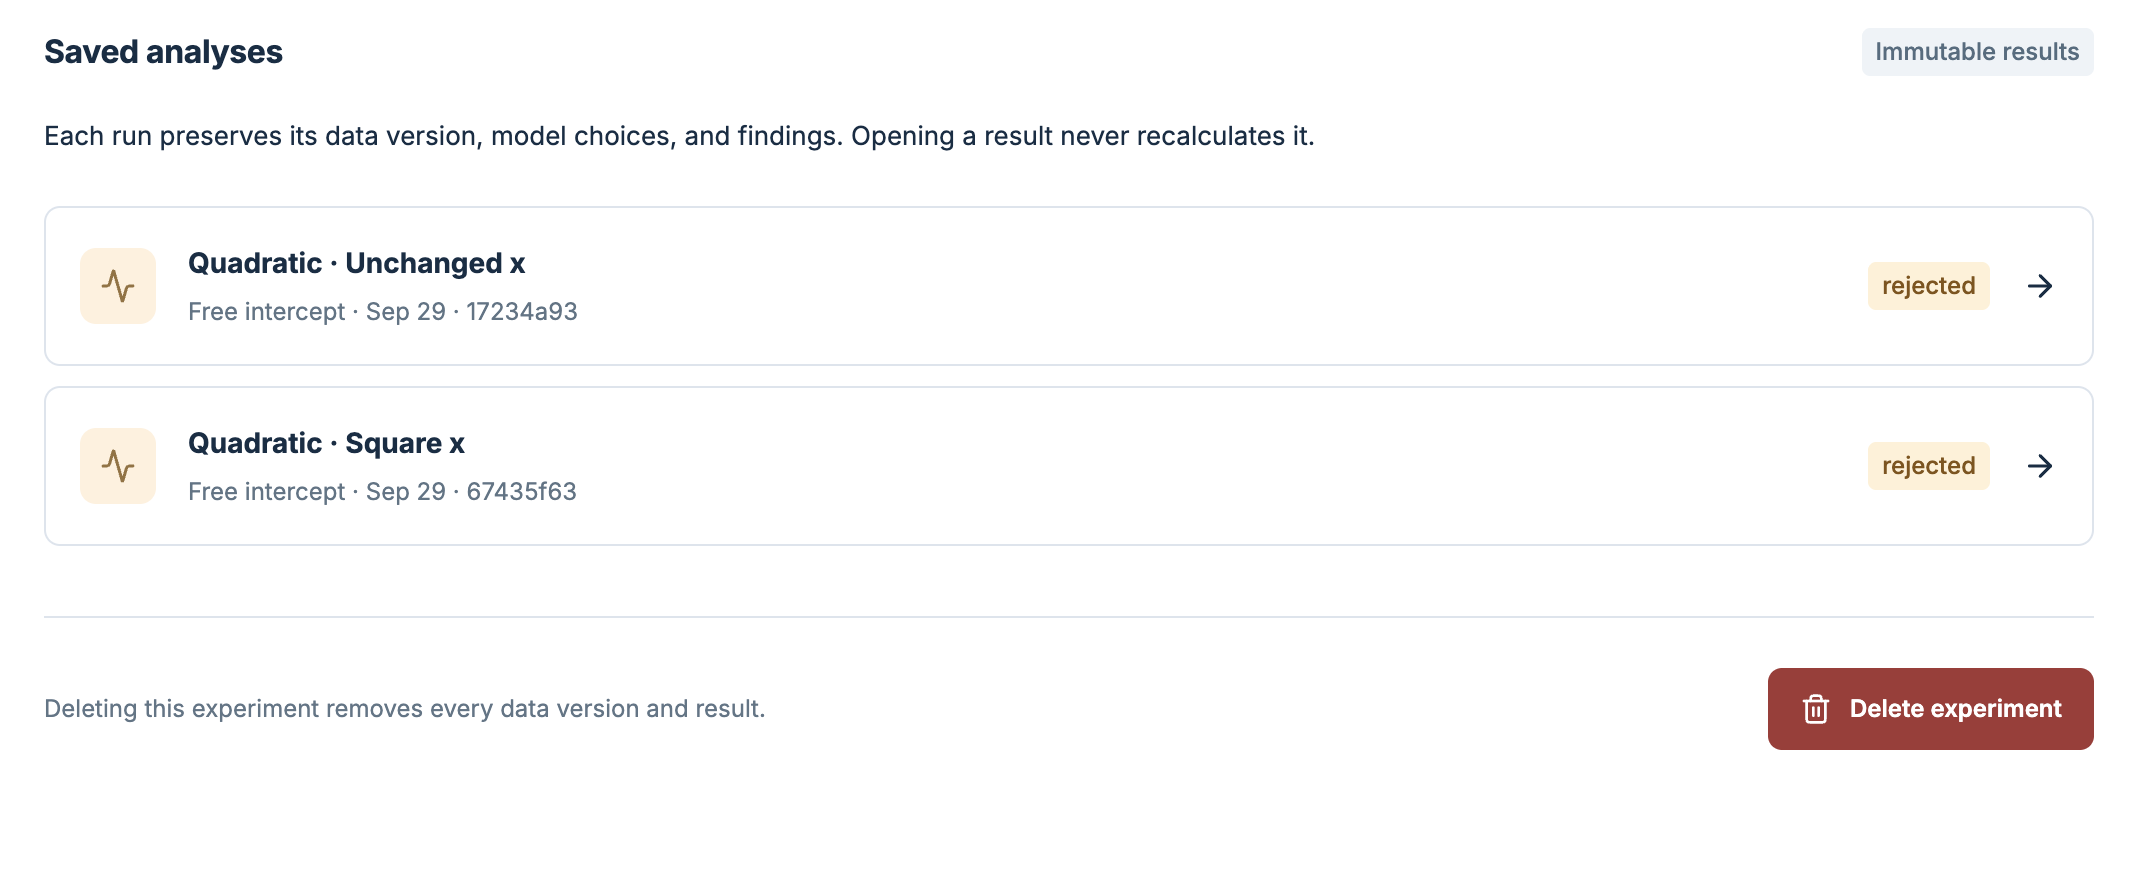
History preserves each attempt’s data version, model choices, findings, and rejected status.
-
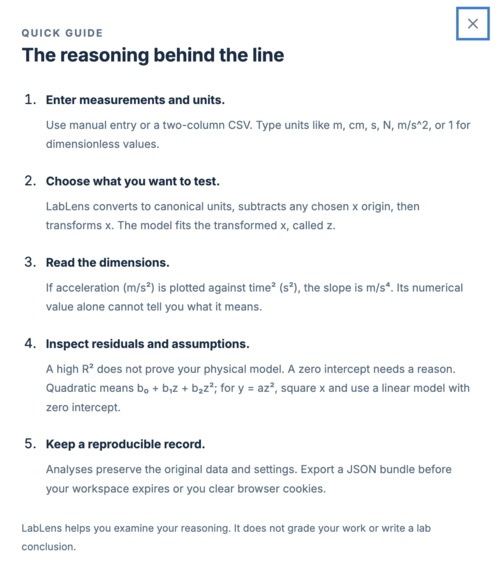
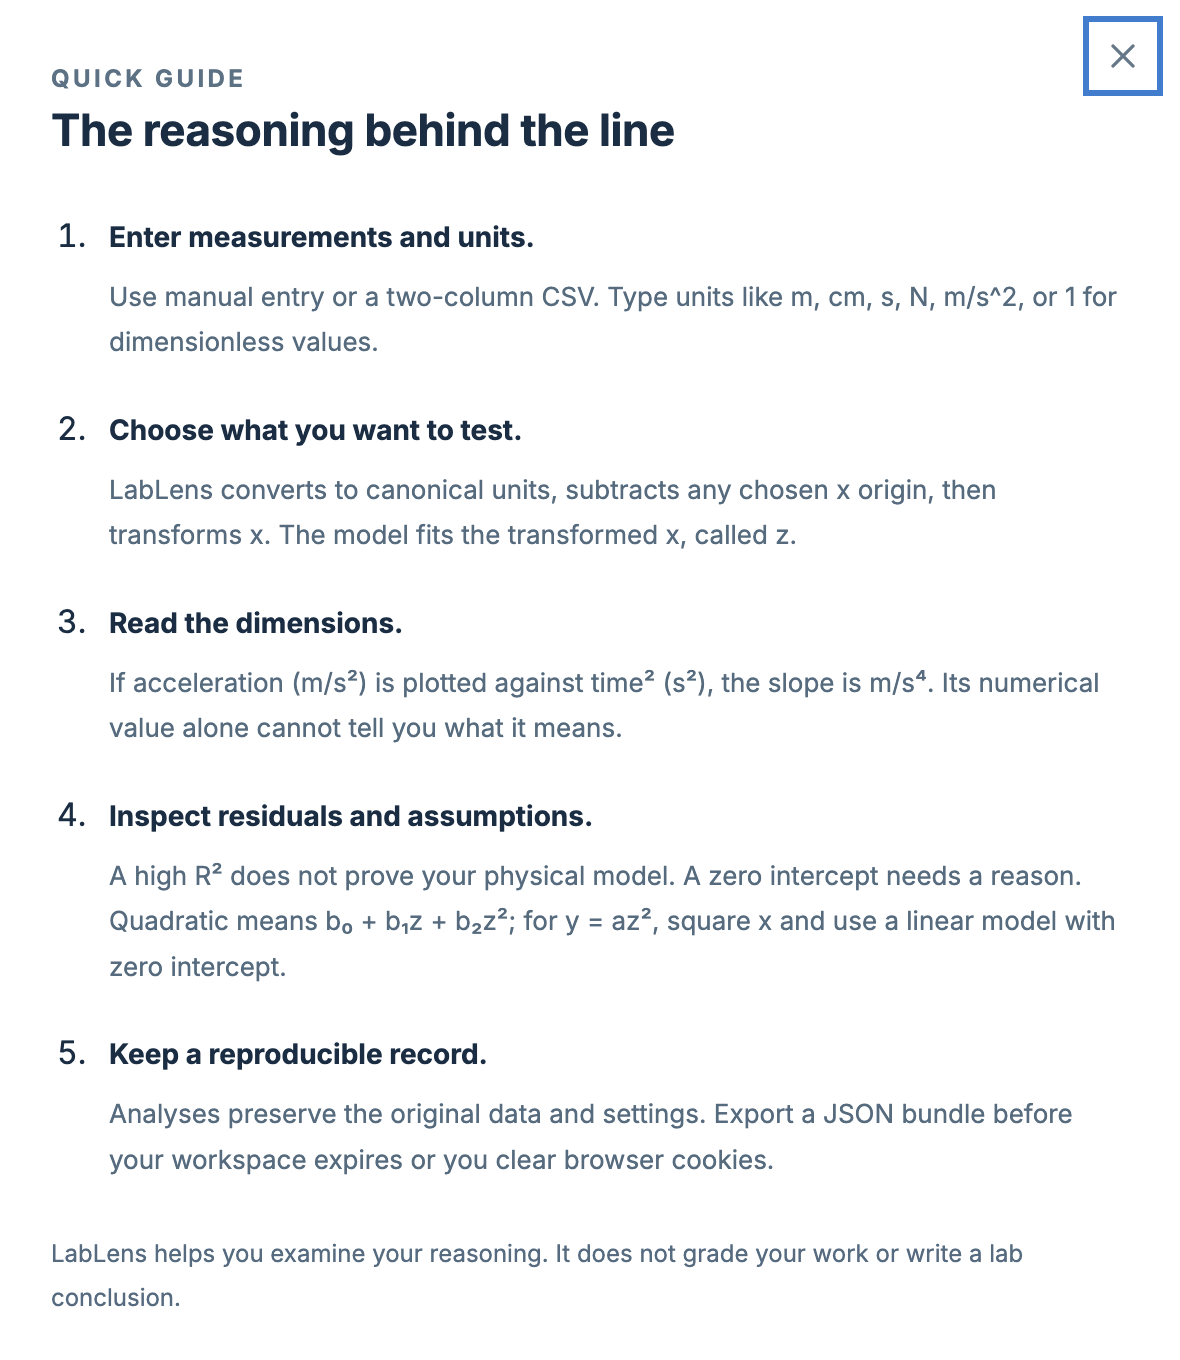
The in-app guide explains units, transformed axes, residuals, assumptions, and reproducible exports.
-
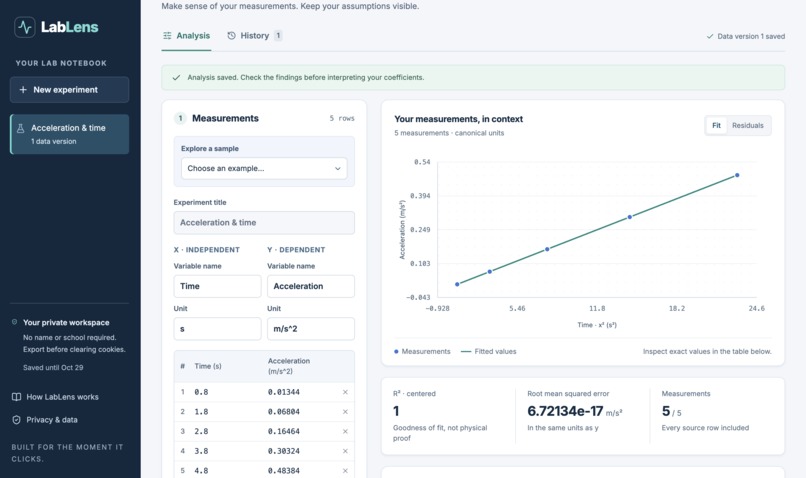
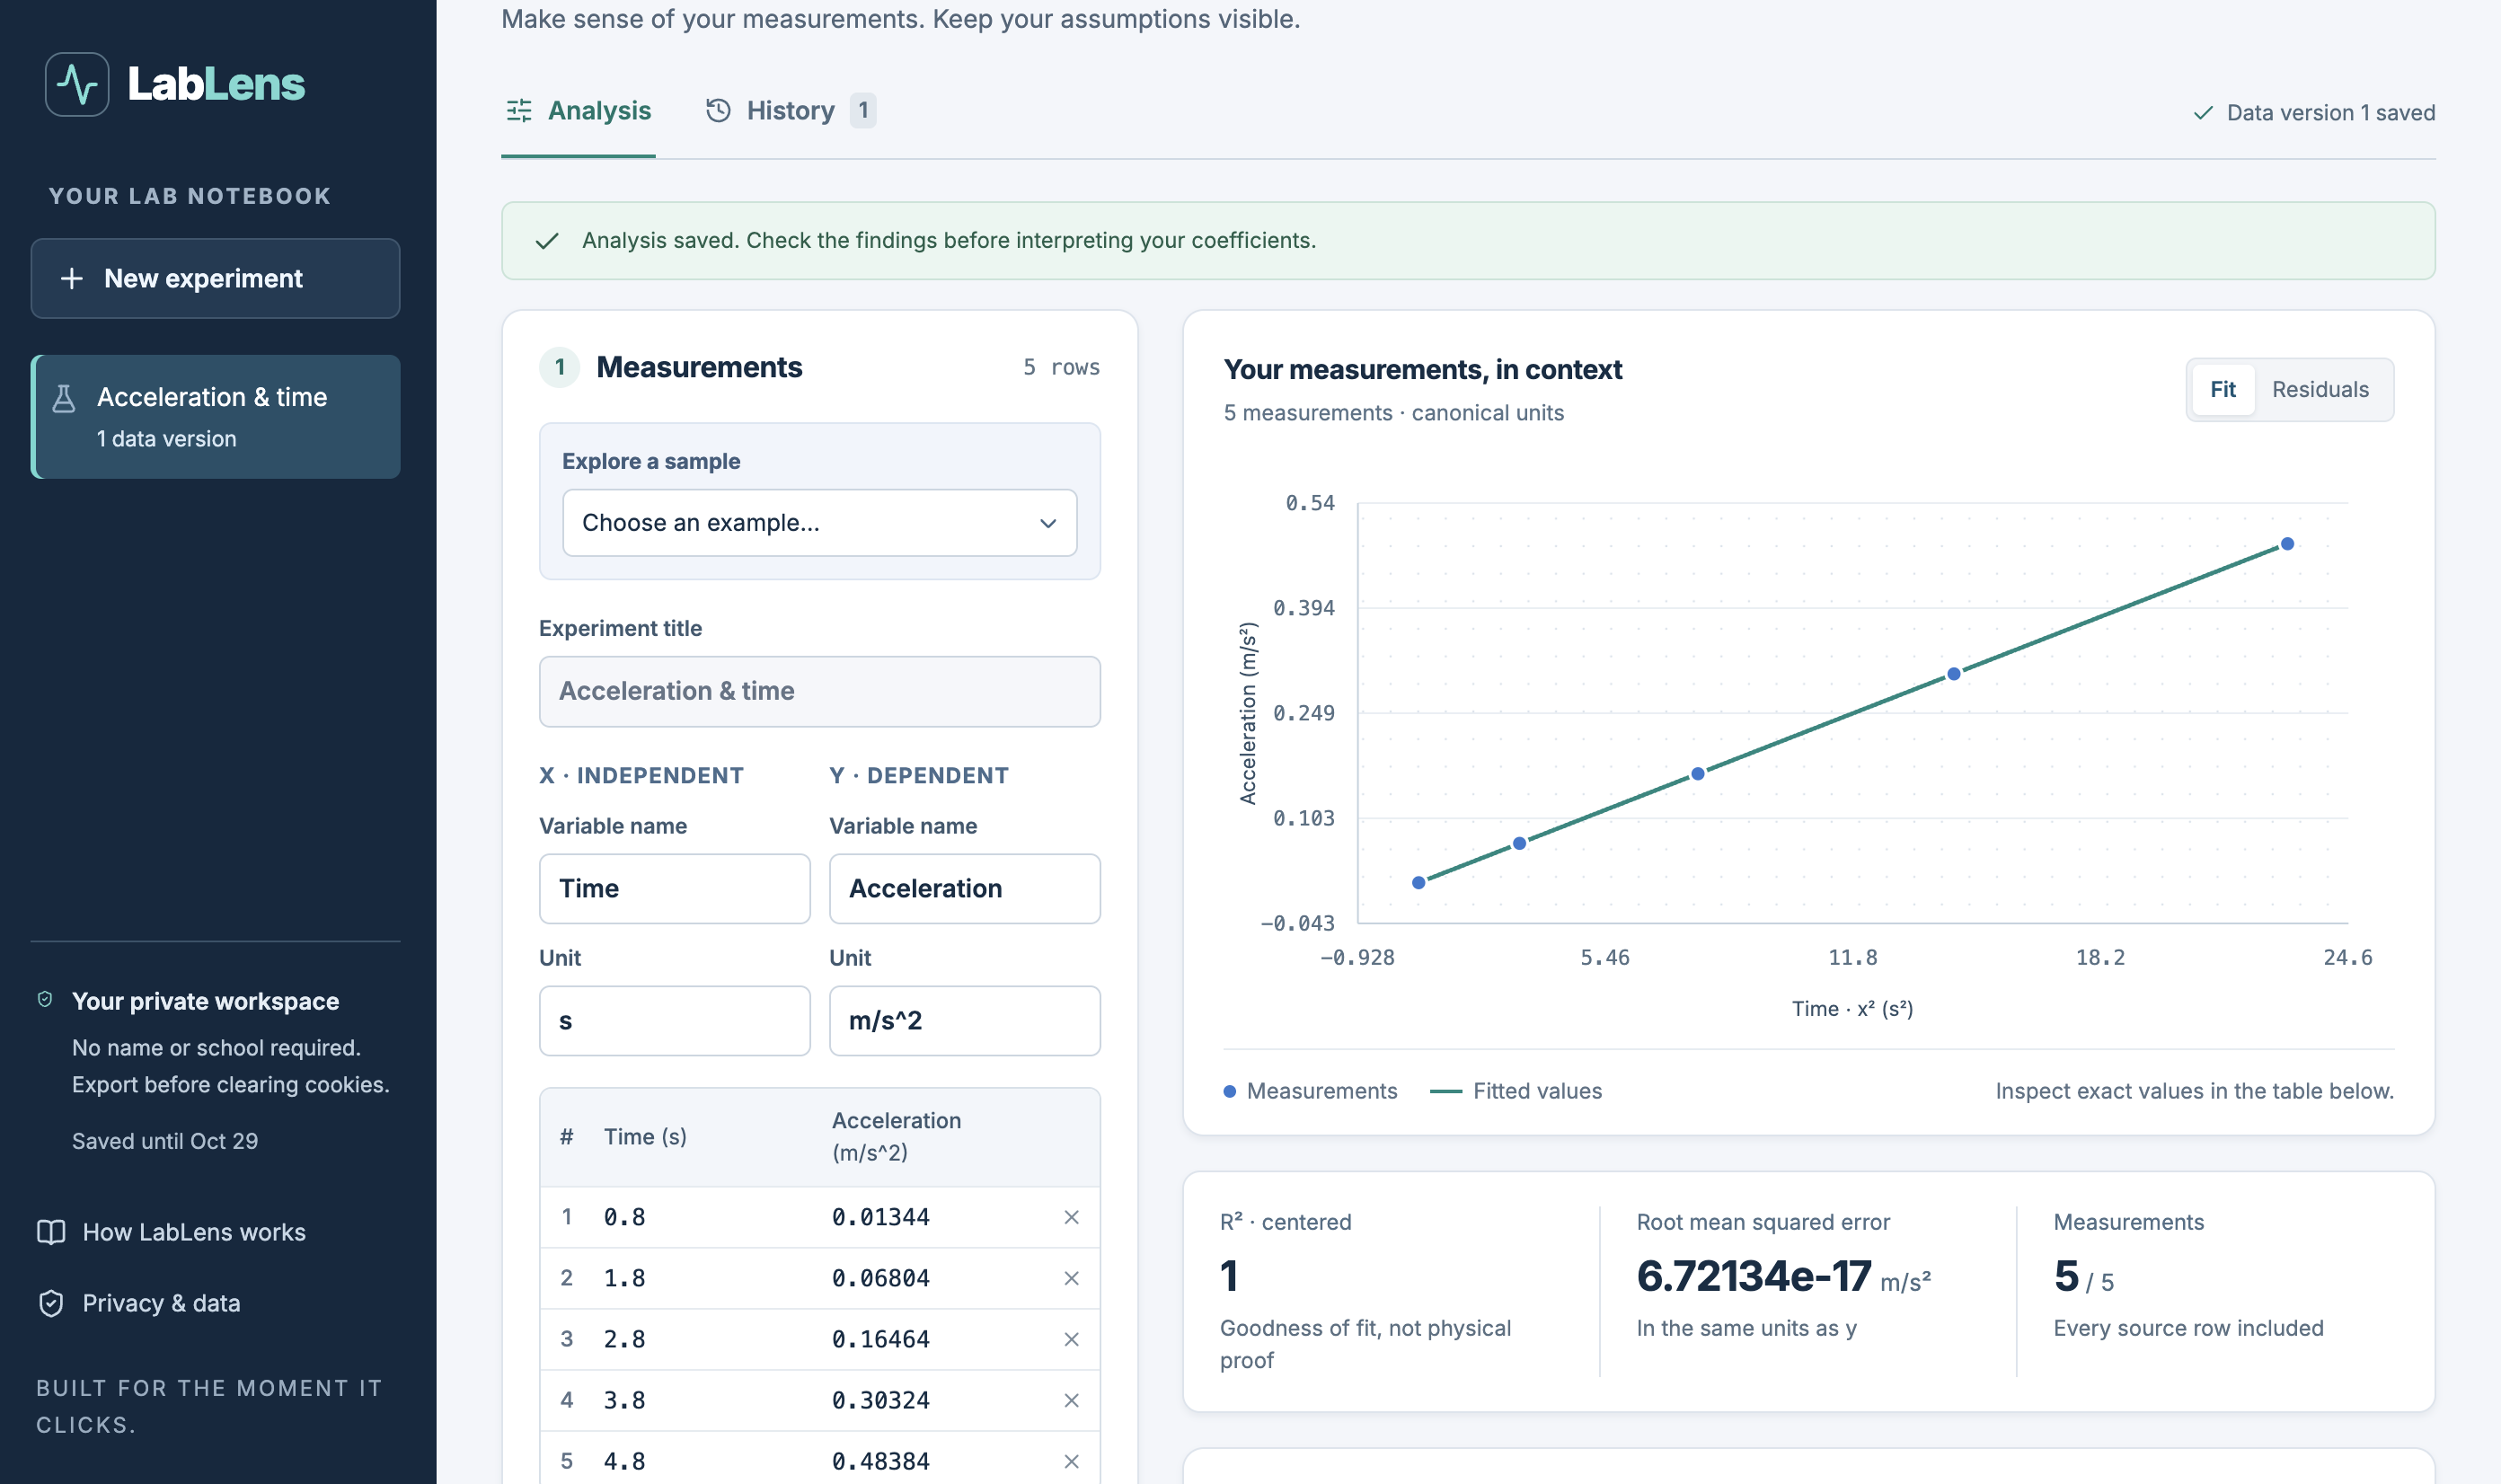
Five synthetic measurements and their fitted acceleration-versus-time² graph.
-
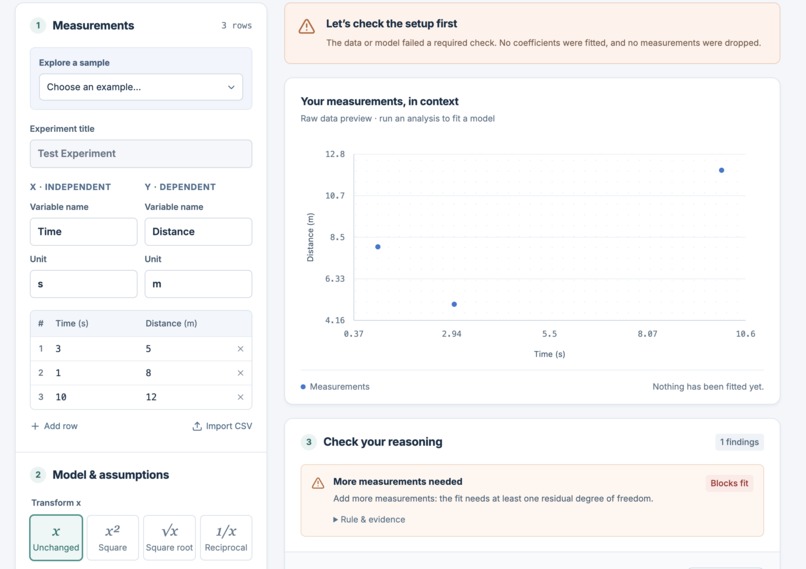
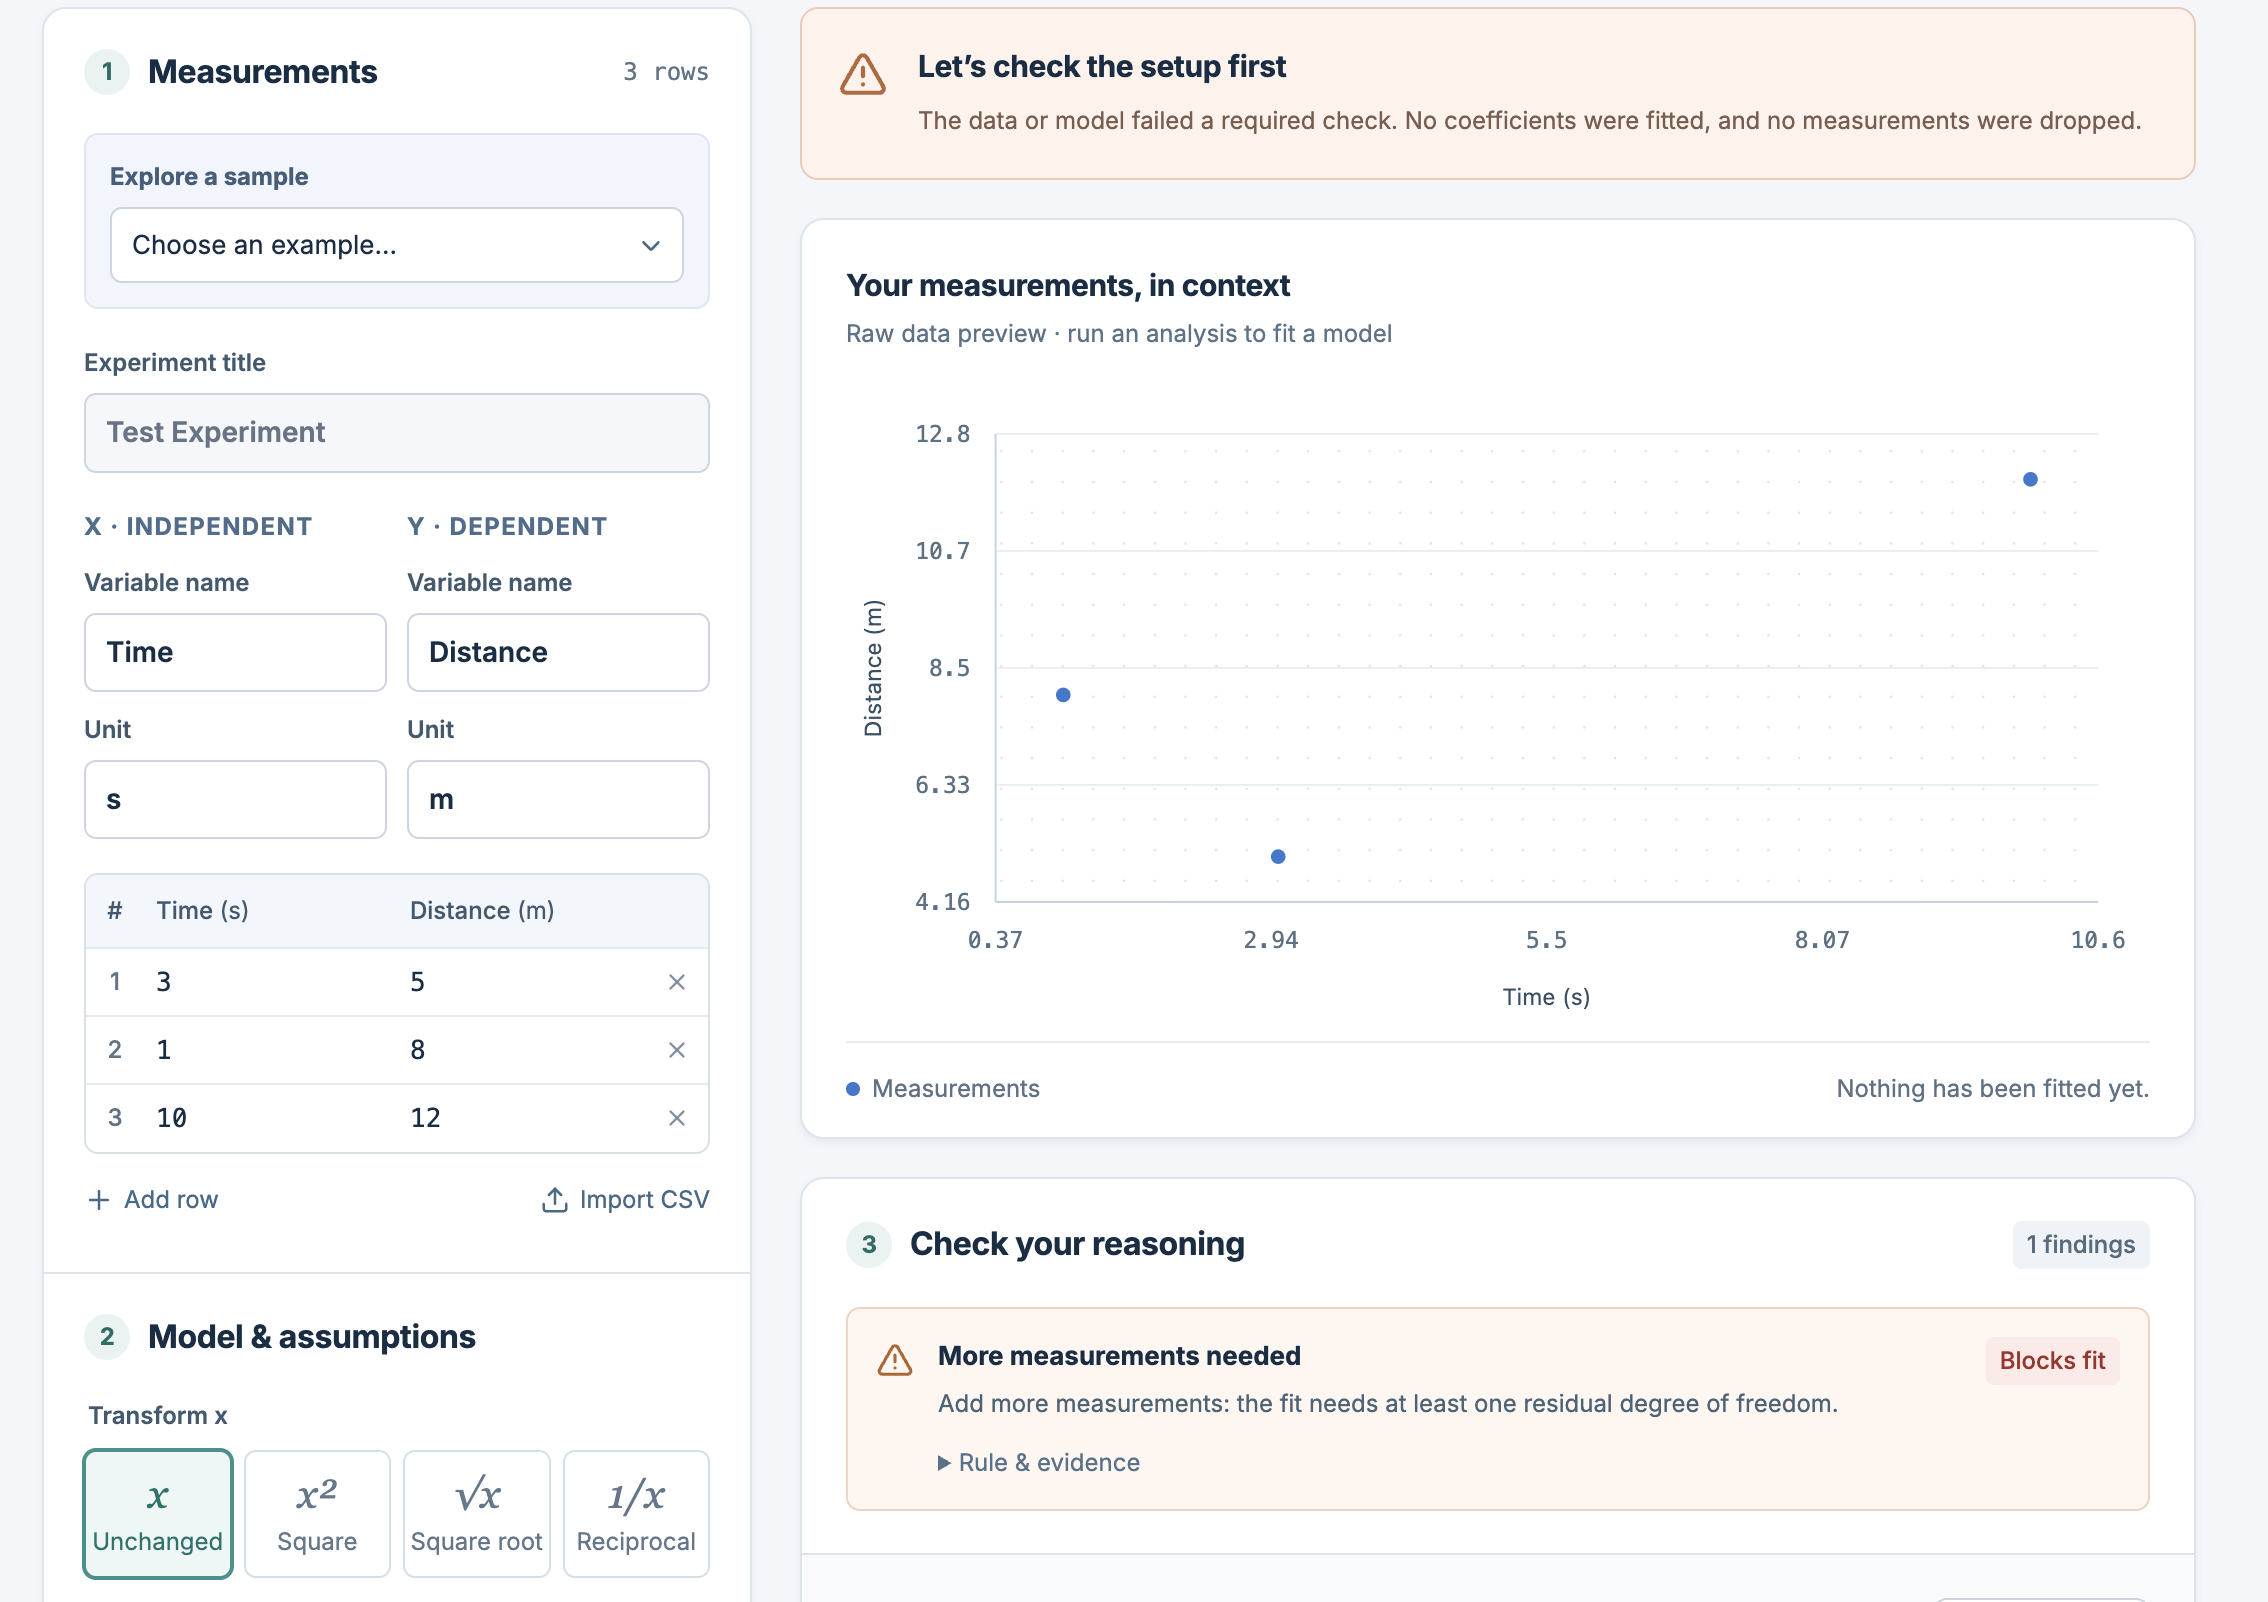
With too few measurements for the chosen model, LabLens rejects the fit and explains why.
-
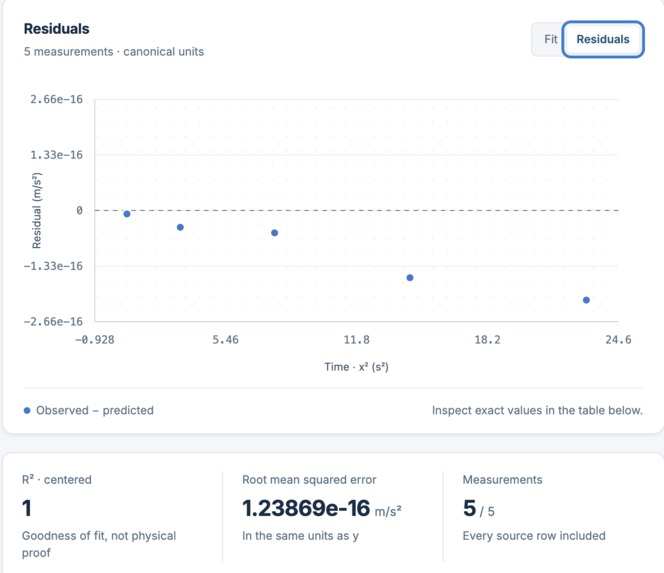
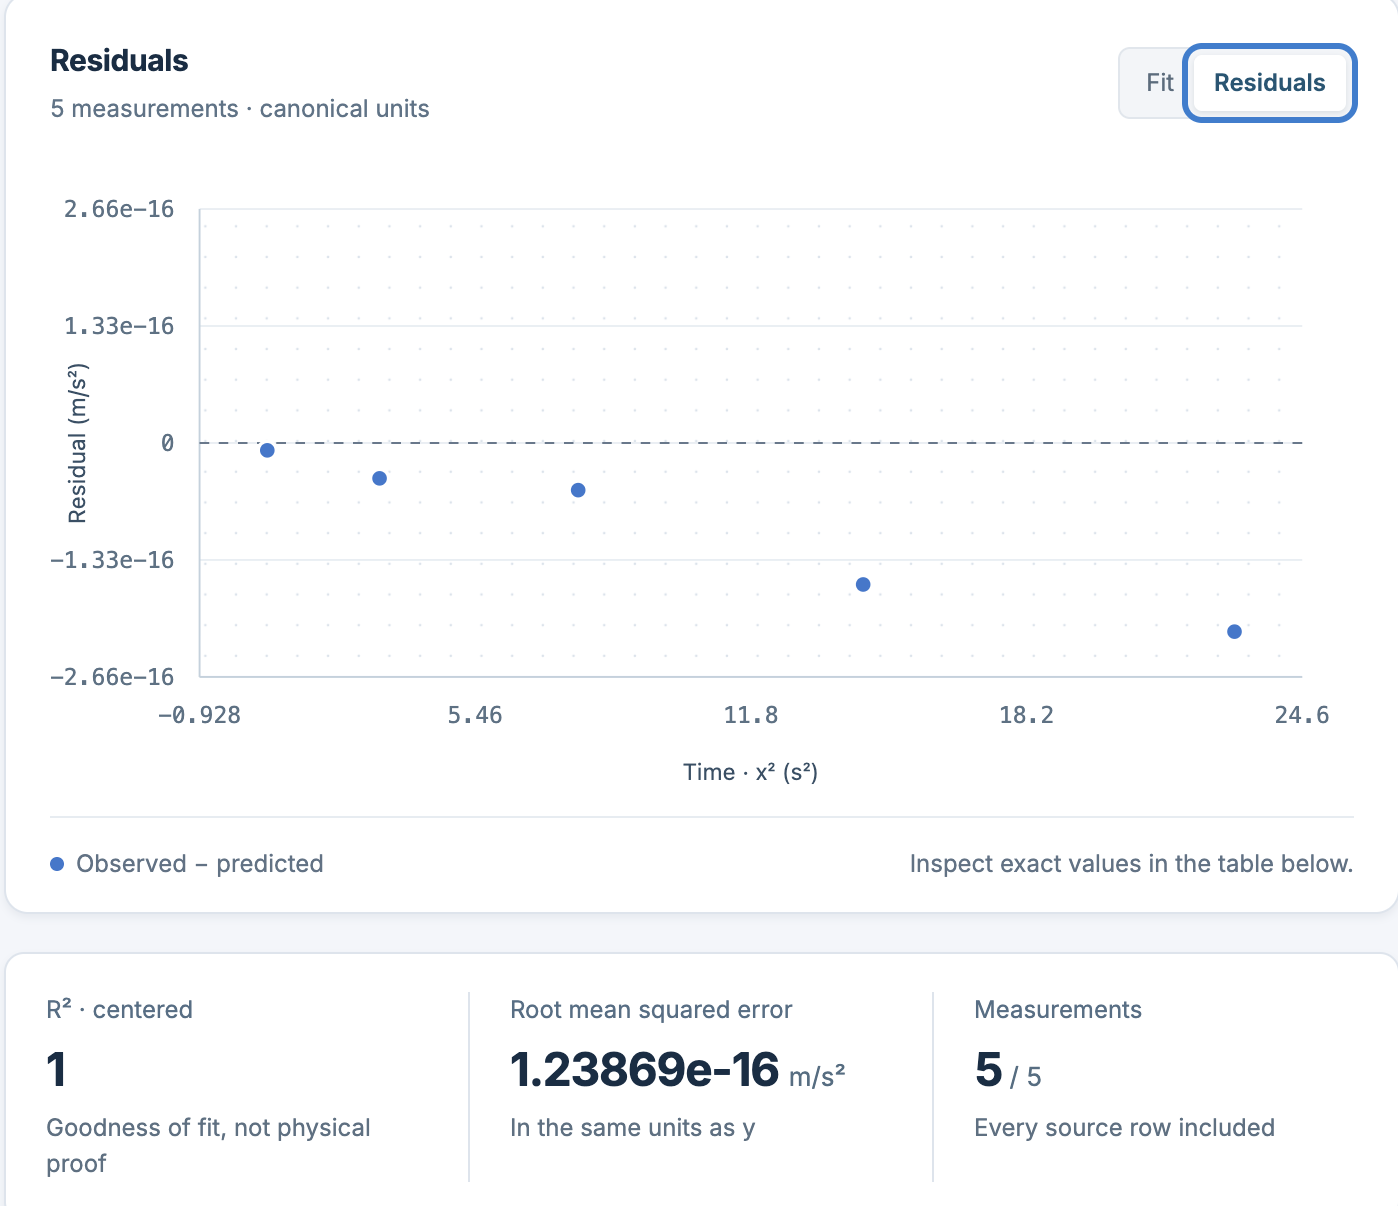
LabLens plots observed minus predicted values for all five measurements, helping students inspect errors beyond R².

Inspiration
While working with linearized physics graphs, I saw how a graph can look convincing even when its interpretation is off. Squaring the x-variable changes the slope’s units, and fixing a line through zero adds an assumption. I built LabLens to help students catch those issues while they analyze their data.
What I Learned
I learned that fitting a line is only one part of analyzing an experiment. Students also need to understand which variables were transformed, what units the coefficients should have, and which assumptions shaped the model. A strong fit can support a model, but it does not prove a physical law.
For example, if acceleration is plotted against time squared, the slope’s units should be ( (\mathrm{m/s^2})/\mathrm{s^2} = \mathrm{m/s^4} ). LabLens uses this example to show why checking dimensions matters.
How I Built It
LabLens lets students enter measurements or import a CSV, choose units and a model, and inspect the fitted coefficients, residuals, and reasoning checks. The web app uses Next.js, React, and TypeScript; a Python API validates requests and runs the analysis. Pint handles unit conversions, SciPy fits the model, and PostgreSQL stores saved data and results.
The calculations and checks are deterministic. Optional AI can rephrase existing findings, but it is not needed to analyze data.
Challenges
One challenge was deciding when the app should reject an analysis instead of producing a misleading graph. For example, a reciprocal transformation is undefined at zero. LabLens flags that row rather than silently dropping it. I also worked through unit conversions, numerical edge cases, preserving saved results, and making exported results checkable.
I tested the app with synthetic examples, automated tests, and browser checks on desktop and mobile. I have not yet tested it in a classroom, so its effect on student learning remains to be measured.
AI Use
OpenAI's ChatGPT/Codex was utilized for project research, aiding in code generation, tests, documentation, and debugging. LabLens's numerical calculations and findings use deterministic code, not AI-generated answers. Its optional AI explanation feature requires a provider key; the submitted demo does not rely on one. All AI generated content was reviewed before submission in order to ensure accuracy, relevance, and consistency with the final project.
Built With
- alembic
- axe-core
- codex
- docker-compose
- fastapi
- next.js
- numpy
- pint
- playwright
- postgresql
- python
- react
- scipy
- sqlalchemy
- typescript

Log in or sign up for Devpost to join the conversation.