-
-
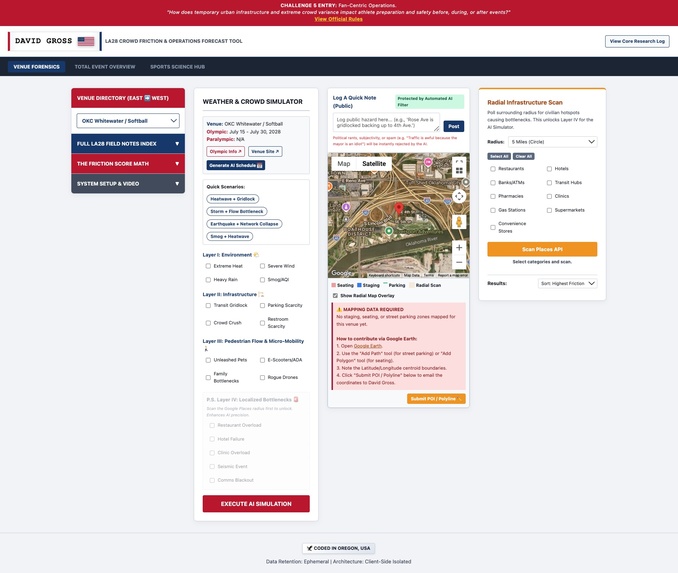
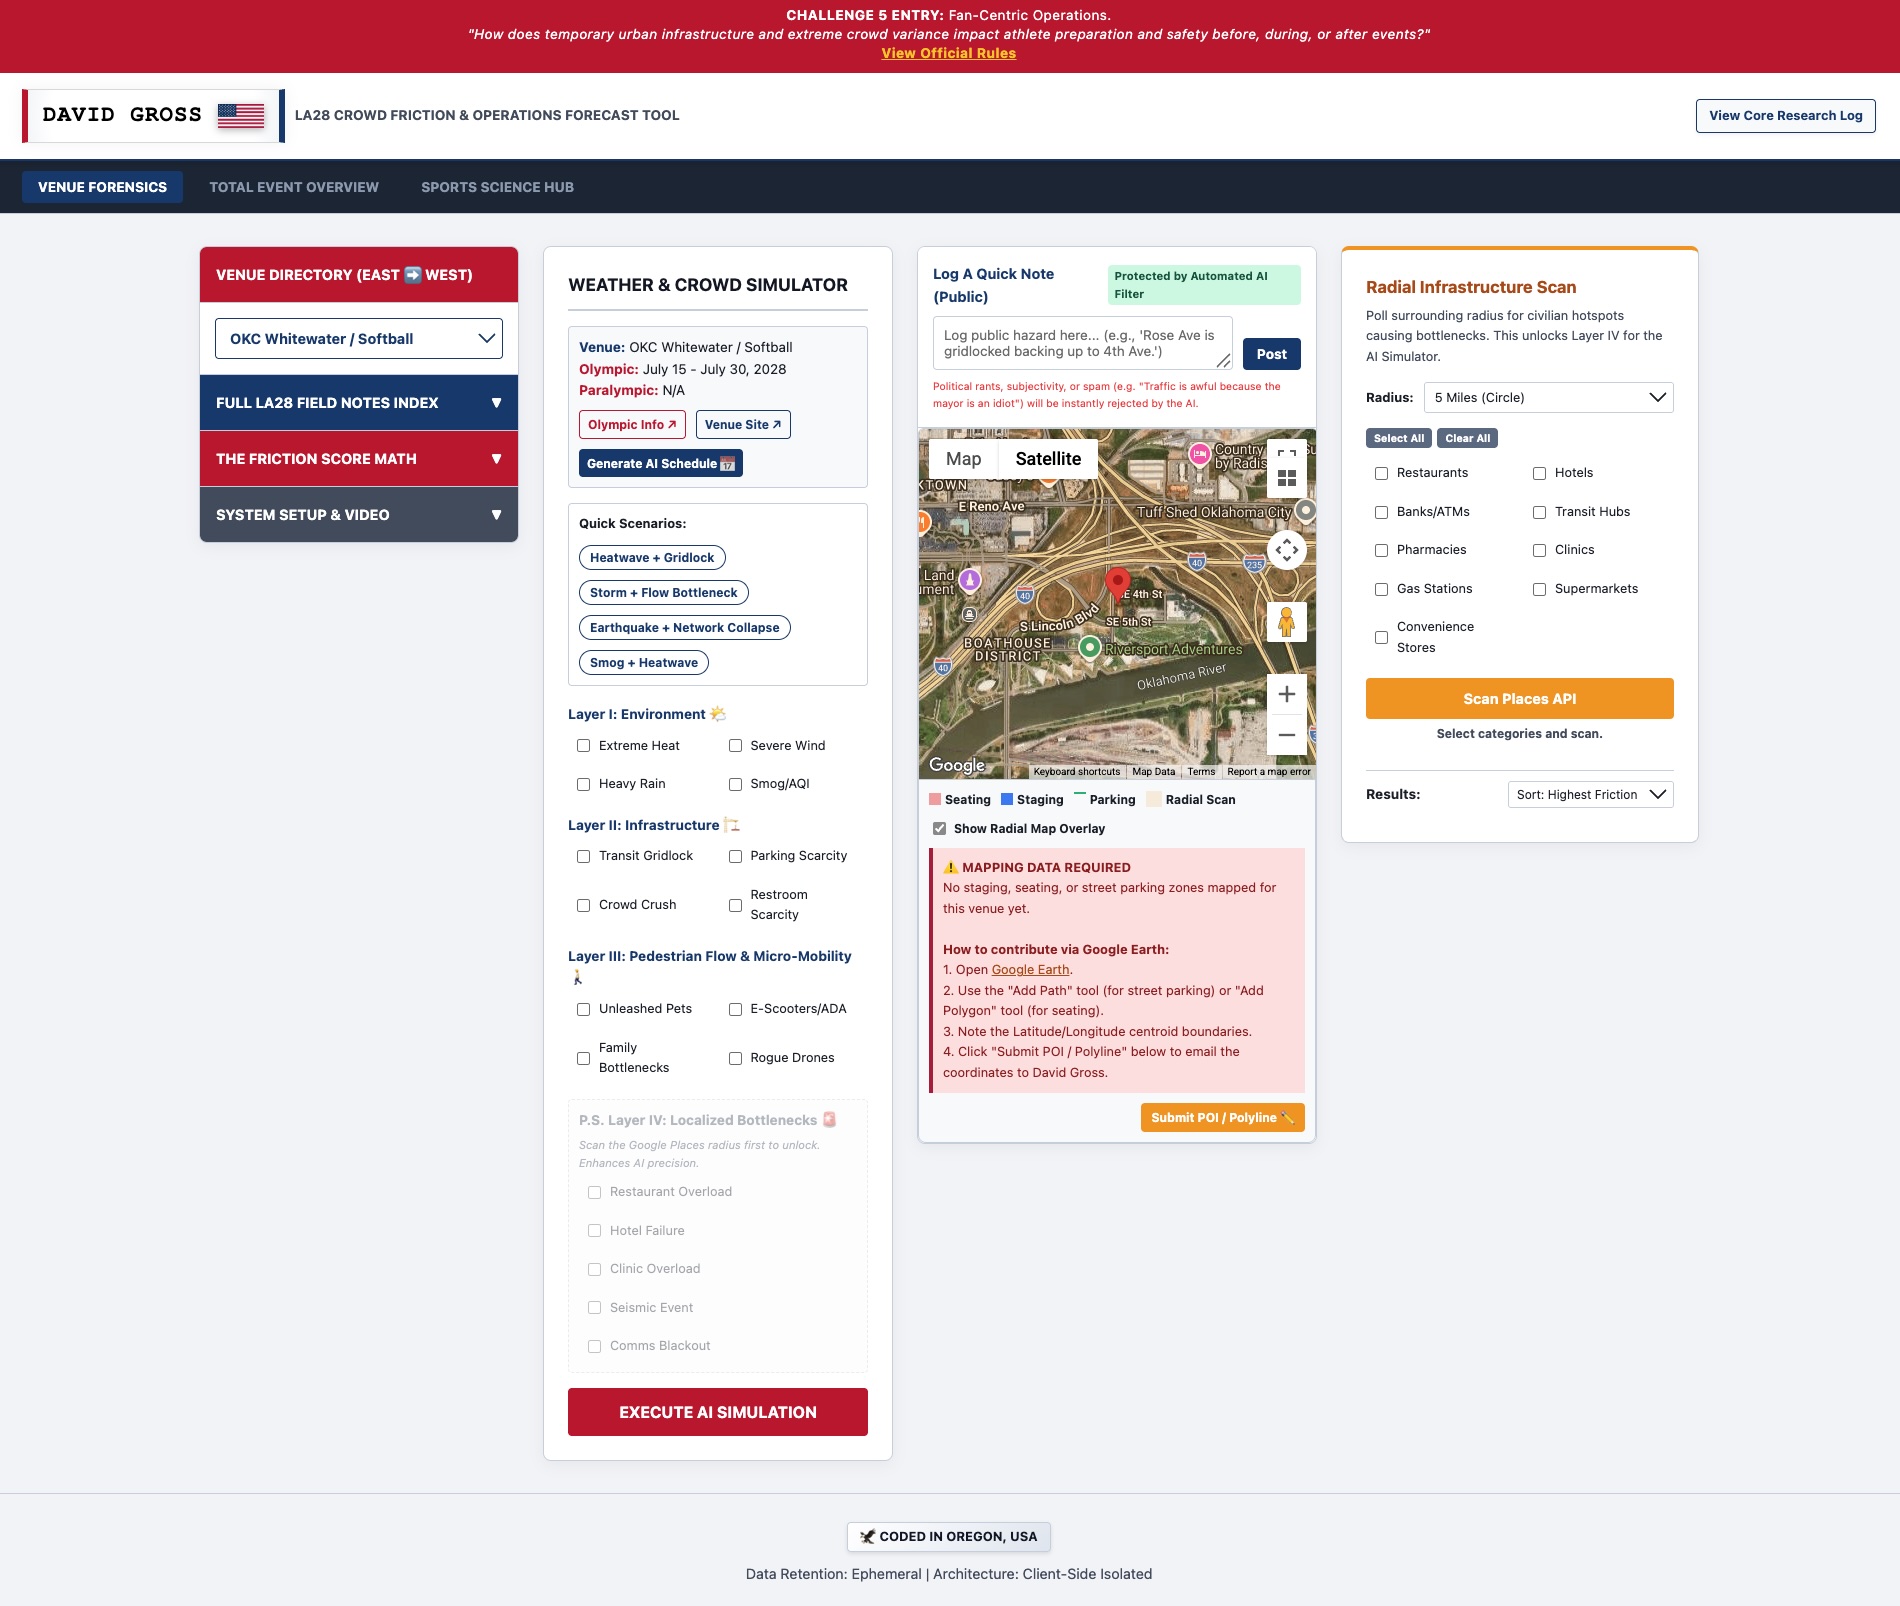
The main layout with the "Venue Directory" sidebar on the left, the "Weather & Crowd Simulator" toggles in the middle, and the Google Map.
Inspiration
A key LA28 logistical test is the 1-3 hour pre-event window. I wanted to analyze urban bottlenecks while ensuring absolute Olympic and Paralympic analytical parity.
What it does
An AI dashboard combining Google Places with Gemini 2.5. It calculates a "Friction Score" for local infrastructure and generates briefs detailing how hazards impact anonymized "Athlete Archetypes."
How I built it
I built a containerized Python (Flask) backend deployed on Google Cloud Run, leveraging the Google Gemini SDK and a Google Maps frontend.
Challenges I ran into
Engineering the AI prompt to strictly obey hackathon legal rules—preventing Name, Image, Likeness (NIL) violations and enforcing conditional phrasing—without losing analytical depth.
Accomplishments that I'm proud of
Developing the mathematical Friction Score proxy and a Gemini-powered moderation engine to filter subjective rants from the public hazard ledger.
What I learned
How to use agentic AI architectures to synthesize geospatial arrays into structured HTML, and securing ephemeral Docker deployments on Cloud Run.
What's next for LA28 Logistical Friction Tracker (Challenge 5)
I want to transition the tactical infrastructure mapping to PMTiles (like my architecture on wildfiremap.net) and incorporate highly detailed, live weather overlays like active radar and wind shear to give Gemini hyper-local meteorological context.
Built With
- browser-local-storage
- css3
- docker
- flask
- google-cloud-run
- google-gemini-api
- google-maps-geometry-library
- google-maps-javascript-api
- google-places
- gunicorn
- html5
- javascript
- json-local-file
- python-3.11
- python-dotenv

Log in or sign up for Devpost to join the conversation.