Inspiration
We all live in Santa Barbara, which is near LA, so we had a vague familiarity with LA, and all of us heard that Central LA was the area of LA that has the most crime. However, since none of us lived in LA, we couldn't verify this. Therefore we endeavored in this project to either verify or deny this piece of "common wisdom" we all had heard.
What it does
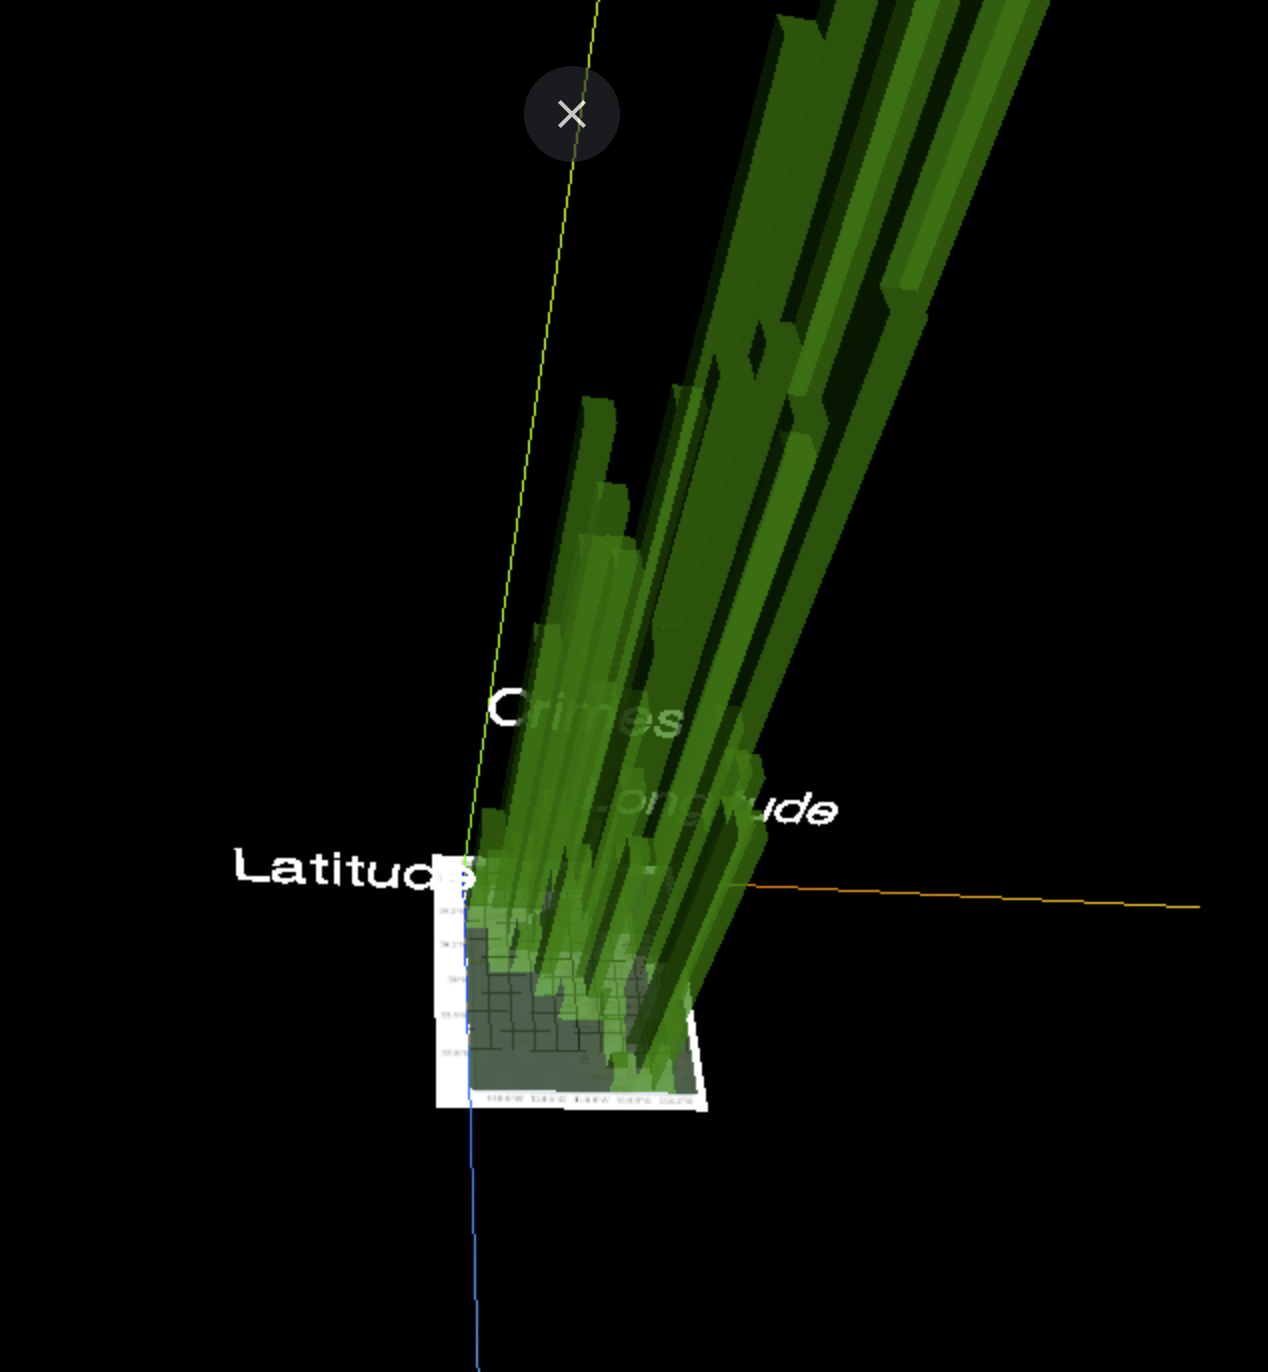
We analyzed the crime data in LA using a 2d scatter plot, a 3d histogram, and a height map.
How we built it
We built the 2d scatter plot and 3d histogram using R and Rstudio. We built the height map using Javascript, three.js, python, and polars.
Challenges we ran into
We had significant time constraints. In addition to this, out-attempted population adjusted graph became significantly misleading because we didn't consider zoning meaning certain areas had high numbers of visitors and low numbers of residents, leading to us not providing it in fears that it would be misleading.
Accomplishments that we're proud of
We are proud of accomplishing our goal of verifying if central LA was the area which had the highest amount of crime in LA.
What we learned
We learnt how to use three.js and got significant experience using it.
What's next for LA Crime 3D
If we had more time, we would try to make a non-misleading population-adjusted graph by comparing crime rate to the number of visitors of certain areas.
Built With
- ggplot
- javascript
- polars
- r
- rstudio
- three.js

Log in or sign up for Devpost to join the conversation.