-
-
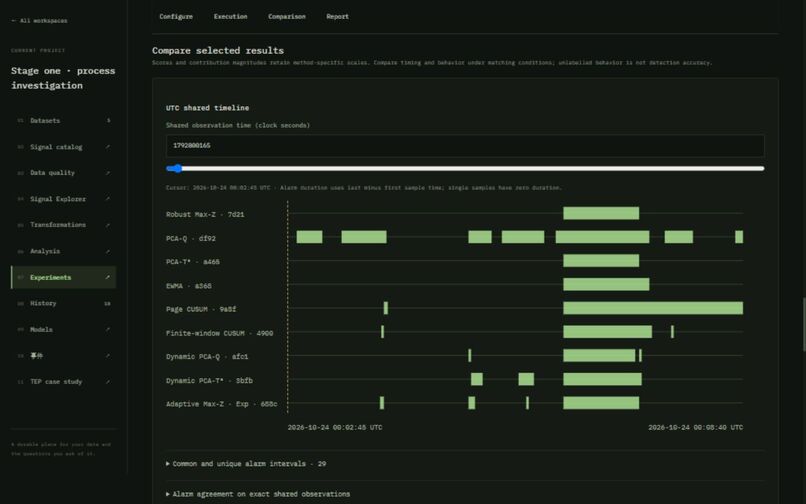
Experiment Workspace
-
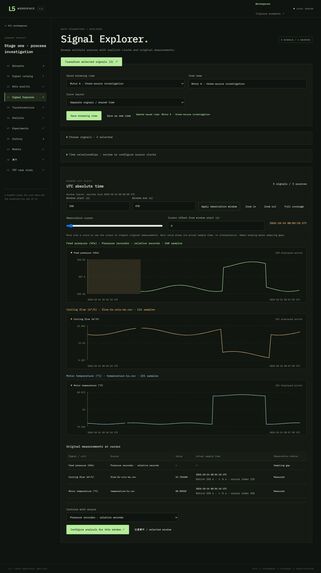
Signal Explorer
-
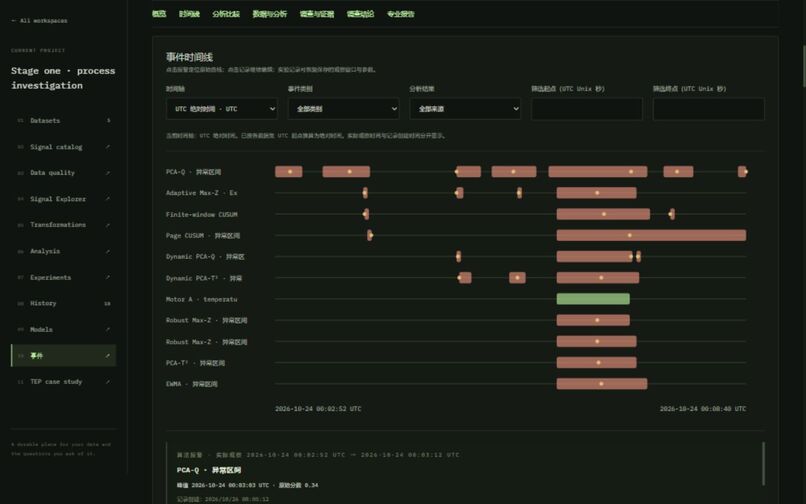
Incident Investigation
-
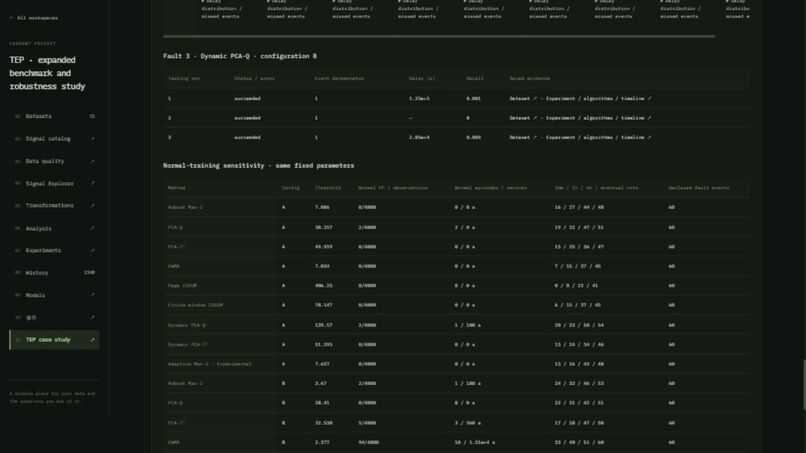
Tennessee Eastman
Inspiration — When an alarm is not enough
Imagine an industrial process with dozens of sensors.
A pressure sensor freezes. Other measurements continue changing. The monitoring system starts generating alarms, but the person investigating the problem still has several unanswered questions:
Is the process actually becoming unsafe? Is a sensor malfunctioning? Which measurements can be trusted? What evidence should be checked before responding?
An alarm can draw attention to a problem, but it cannot explain the problem by itself.
As an automation engineering student, I wanted to build a tool that makes industrial anomalies easier to understand, investigate, and document.
That became L5 — Know Why the Alarm Matters, an open-source workspace for industrial process monitoring and evidence-based fault investigation.
Who it helps
L5 is designed for engineering students, process-monitoring researchers, and technical users analyzing industrial time-series data.
It addresses a specific problem: making sense of potentially misleading or incomplete industrial alarms before drawing conclusions.
The project brings raw measurements, anomaly detection results, candidate explanations, and investigation records into one connected workflow.
What it does
1. Understand what changed
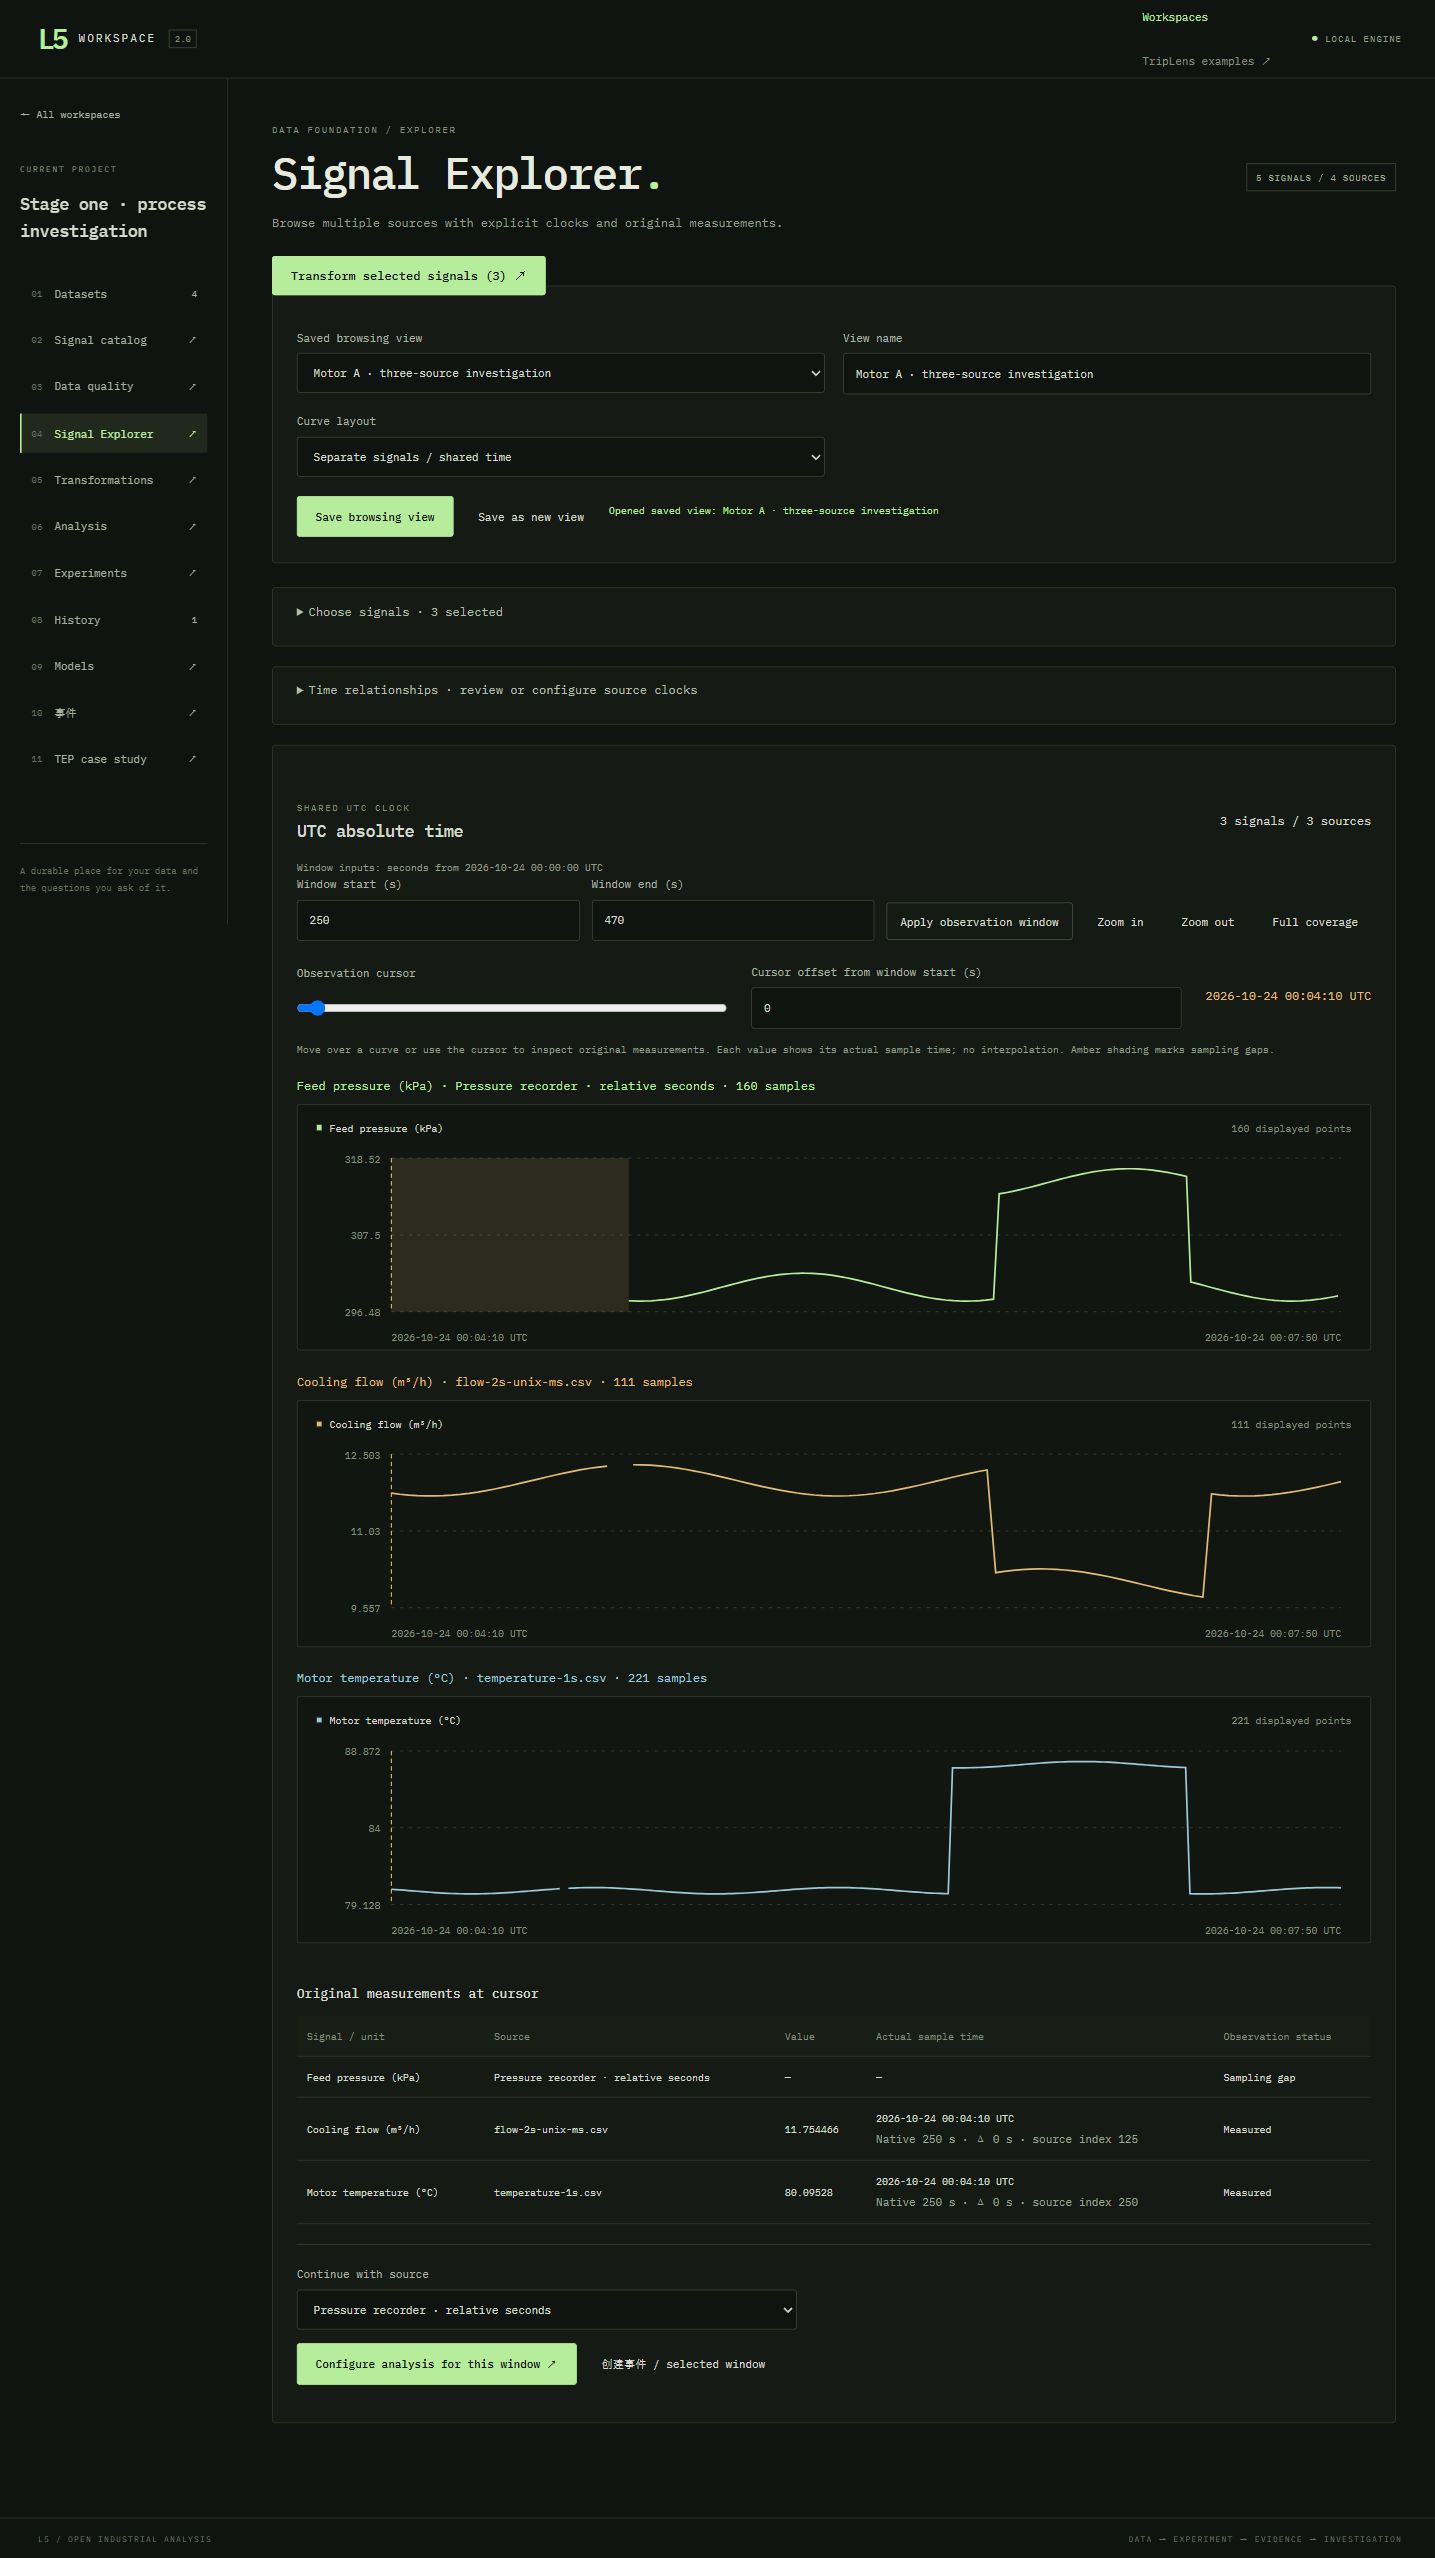
Users can import industrial sensor datasets, explore synchronized signals, inspect missing observations, and compare measurements from different sources.
L5 supports time alignment, resampling, engineering-unit conversion, data-quality inspection, and derived signal generation.
This helps users distinguish an observed process change from potential measurement or data-quality issues.
2. Compare alarms instead of trusting one detector
L5 implements nine anomaly detection methods, including PCA, Dynamic PCA, EWMA, CUSUM, and Robust Max-Z.
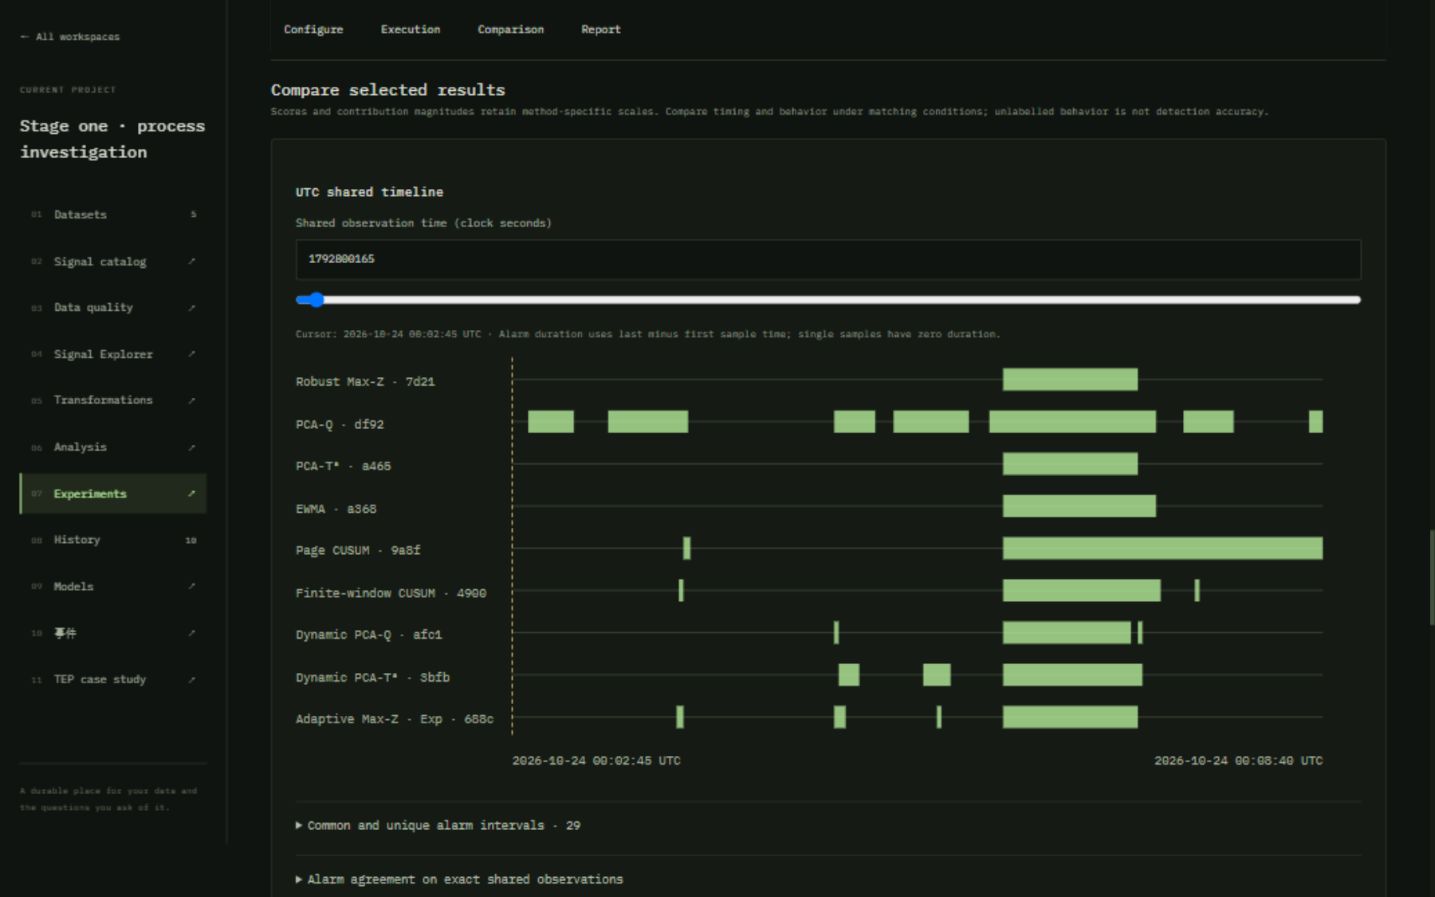
Users can compare their scores, thresholds, alarm intervals, and contributing variables on shared timelines.
Different detectors may disagree or react at different times. L5 makes these differences visible so users can investigate the evidence behind a warning.
3. Investigate the evidence
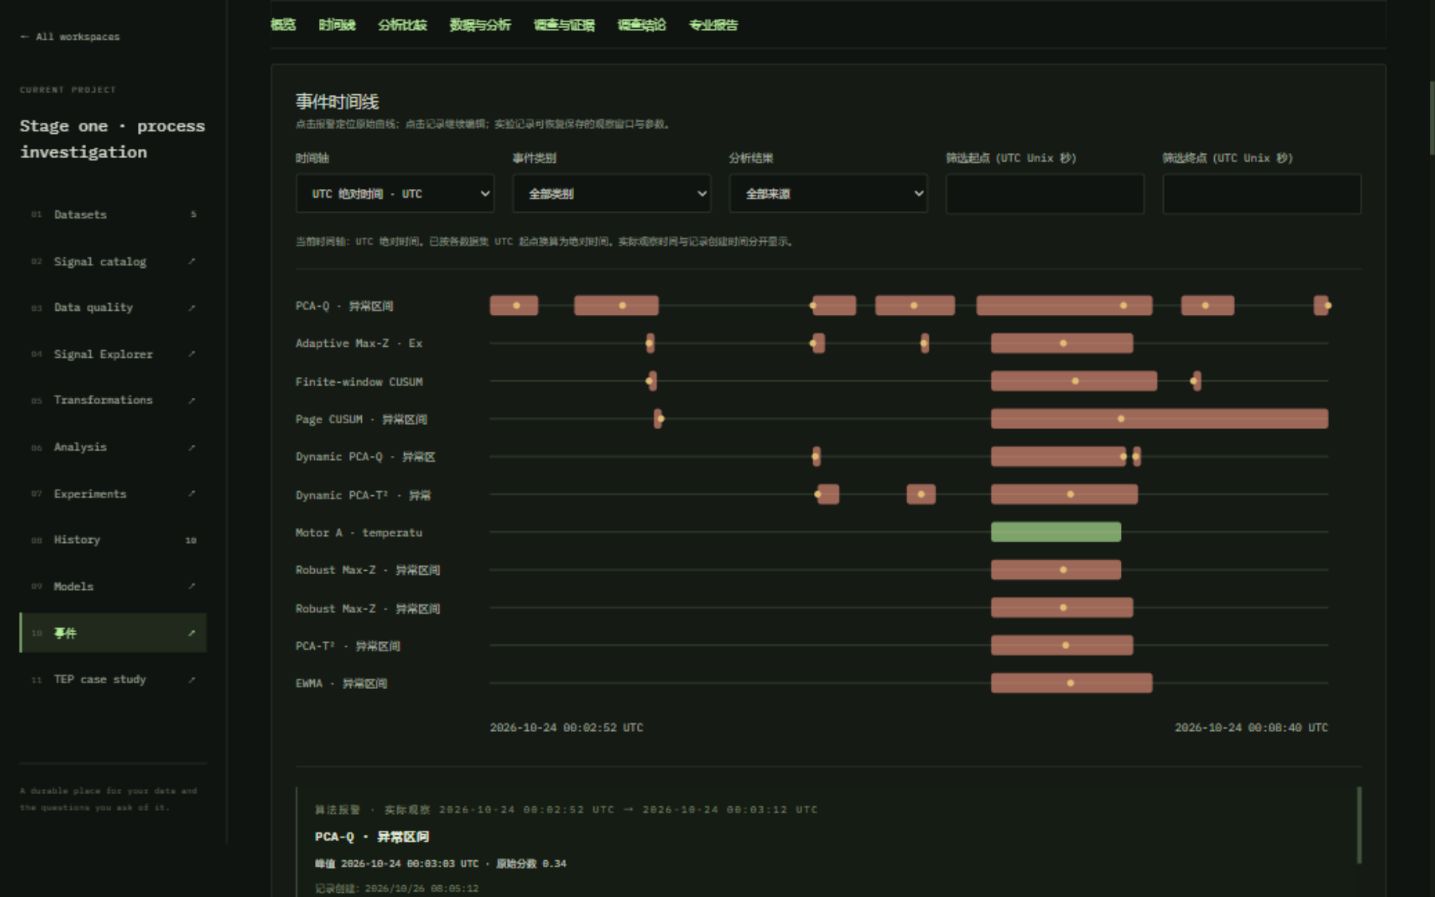
Users can create persistent incident records from detected anomalies.
An investigation connects:
- Original sensor measurements and analysis results.
- Alarm intervals and synchronized timelines.
- Candidate explanations and supporting or contradicting evidence.
- Investigation notes, findings, and exported reports.
This creates a traceable path from an initial warning to a documented conclusion.
4. Explore failures through simulation
L5 includes TripLens, an industrial process investigation simulator with 18 signals and 12 fault scenarios, and a coupled-tank model for examining physical process disturbances.
Users can observe fault propagation, compare measurements, test modeled interventions, and review the resulting evidence.
The simulation environment supports experimentation without interacting with actual industrial equipment.
A concrete example: A frozen pressure sensor
One of the bundled TripLens scenarios involves a frozen pressure measurement and an accumulation of process alarms.
The demonstration presents 312 alarm events, summarized into six conditions and three process groups.
Rather than treating hundreds of alarms as independent emergencies, the investigation workflow helps users examine competing explanations, compare available measurements, and trace the evidence associated with a suspected fault.
Users can also explore how different intervention timings affect the simulated process.
The practical safety benefit is clearer, more reviewable interpretation of an uncertain situation. The user can examine what is known, what remains uncertain, and why a particular explanation is being considered.
Testing whether alarms can be trusted
To examine the reliability of industrial monitoring algorithms, L5 was evaluated using the public Tennessee Eastman Process simulation dataset.
The benchmark covers:
- 52 process variables.
- 20 industrial fault types.
- Nine detection algorithms.
- Three normal-training configurations.
- 2,340 successful experimental executions.
The results highlight an important difficulty in industrial monitoring: an alarm does not necessarily indicate the presence of a specific fault.
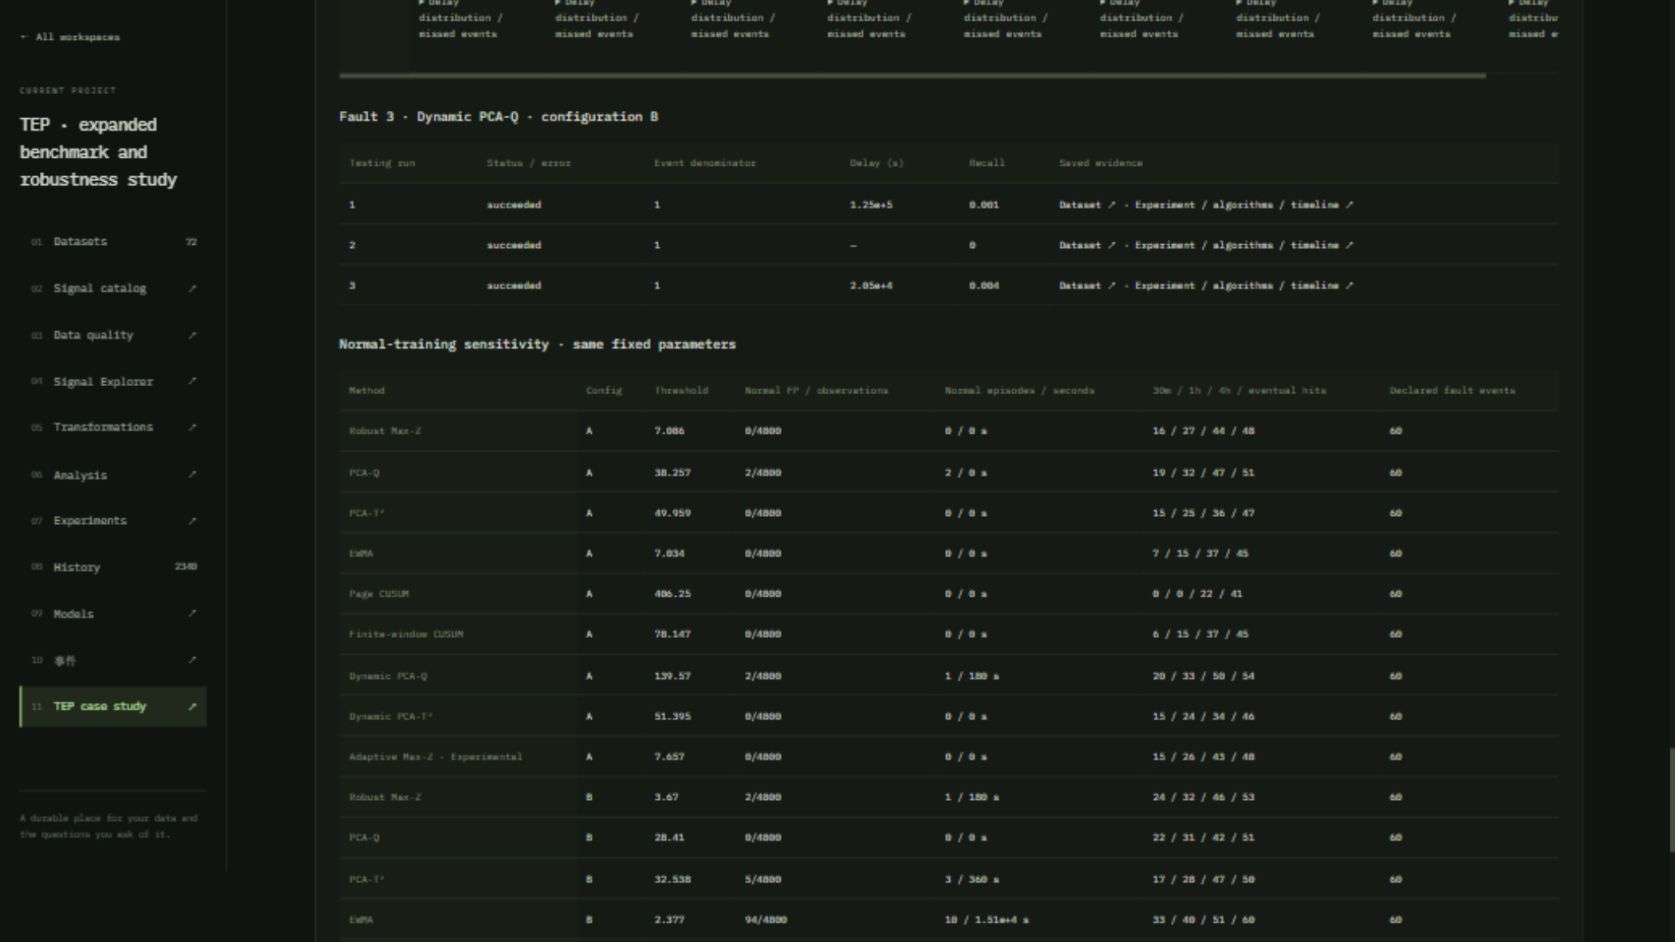
For example, under three different normal-training configurations, Page CUSUM generated 0, 739, and 1,833 alarm samples on the same set of 4,800 normal test samples.
The study also identified late nominal fault detections that coincided with alarms in normal-background trajectories.
These findings motivated L5's emphasis on detection timing, false-alarm analysis, and supporting evidence.
The platform gives users the ability to compare monitoring methods and investigate results instead of relying exclusively on an apparently successful detection count.
Trust and responsible design
L5 is designed around transparent analysis and user review.
Traceable evidence: Investigation records connect conclusions with the underlying measurements, saved analyses, and observation windows.
Visible uncertainty: Users can inspect disagreements between monitoring methods, examine false alarms, and record competing hypotheses.
Local-first operation: The core application runs locally, using SQLite and local numerical storage. Industrial datasets do not require a paid cloud service for analysis.
Safe experimentation: Bundled fault scenarios use simulation models, and published research evaluations use publicly available benchmark data.
Human interpretation: L5 provides analytical information and modeled interventions while leaving operational decisions to the user.
An important limitation
L5 is currently a research and investigation prototype evaluated using simulation and public benchmark data. Its monitoring results have not been validated for autonomous safety-critical operation at a real industrial facility.
It supports investigation and technical learning rather than directly controlling industrial equipment.
How I built it
The frontend uses React 19, TypeScript, and Vite to create interactive signal views, experiment dashboards, and investigation timelines.
The computational backend uses Python, NumPy, and pandas for numerical processing, anomaly detection, and process simulation.
SQLite provides persistent storage for workspaces, experiments, incidents, and investigation records.
The system also supports structured JSON exports, standalone HTML reports, and browser-based PDF generation.
A major design objective was connecting these components through one persistent workspace, allowing users to move between sensor measurements, analytical results, simulated scenarios, and incident records.
What I built during SafeSpace Hacks
L5 began before the SafeSpace Hacks development window opened on October 17, 2026.
Earlier work included the original TripLens simulator, alarm investigation interface, synthetic fault scenarios, evidence exploration, and intervention experiments.
During the hackathon development window, the project underwent substantial expansion. GitHub records document the following additions during October 23–26:
- Persistent workspaces supporting imported industrial datasets.
- Multisource signal exploration and data-quality inspection.
- Signal resampling, unit conversion, and derived-variable generation.
- Unified nine-algorithm anomaly detection and experimental comparison.
- Persistent incident investigation, shared timelines, and evidence-based reporting.
- Versioned process models and scenario experimentation.
- Expanded Tennessee Eastman benchmarking and normal-training sensitivity analysis.
- Interface and workflow consolidation, including multilingual support.
These additions connected the earlier process simulator with a general-purpose industrial analysis and investigation environment.
The development history is available in the public repository.
Challenges I faced
Making evidence understandable
Industrial sensor data contain different timestamps, measurement units, missing observations, and sampling intervals.
Developing a consistent data-processing workflow was essential for making comparisons meaningful.
Handling unreliable alarms
The Tennessee Eastman experiments showed how detector behavior can change depending on normal-training data.
Some apparent successes were late or coincided with normal-background alarms. Evaluating these cases required examining timing, false positives, and fault-specific evidence.
Preserving investigation context
An investigation often spans multiple datasets, monitoring methods, and observation windows.
Keeping the original data, analysis settings, hypotheses, and conclusions connected was a major software design challenge.
What I learned
The most important lesson was that detecting an anomaly and understanding a risk are different tasks.
More alarms do not automatically produce better information.
A useful monitoring environment should help users inspect evidence, compare interpretations, and understand the uncertainty behind its results.
I also learned that building trustworthy engineering software requires careful integration of numerical algorithms, data processing, experimental evaluation, and understandable interfaces.
What's next?
Future work will focus on expanding industrial benchmark coverage, improving diagnostic comparisons, incorporating additional process models, and evaluating the platform with industrial collaborators.
I also plan to make the investigation workflow more accessible for engineering education and practical research.
The long-term goal is to help technical users make better-informed decisions when industrial monitoring systems produce uncertain or conflicting warnings.
Open source and credits
L5 is released under the MIT License.
The project uses open-source development libraries and publicly available Tennessee Eastman Process simulation data. AI coding assistants, including Codex, supported software development, testing, and documentation.
The public GitHub history distinguishes earlier components from development during the hackathon window.
Source code: https://github.com/dongxuelian2/L5
Research benchmark: https://github.com/dongxuelian2/L5/blob/main/docs/tep-benchmark-expanded.md
Video demonstration: https://www.youtube.com/watch?v=CpWqTTaBvnQ
Built With
- anomaly-detection
- cusum
- fault-detection
- industrial-safety
- javascript
- numpy
- pandas
- pca
- python
- react
- simulation
- sqlite
- time-series
- typescript
- vite

Log in or sign up for Devpost to join the conversation.