-
-
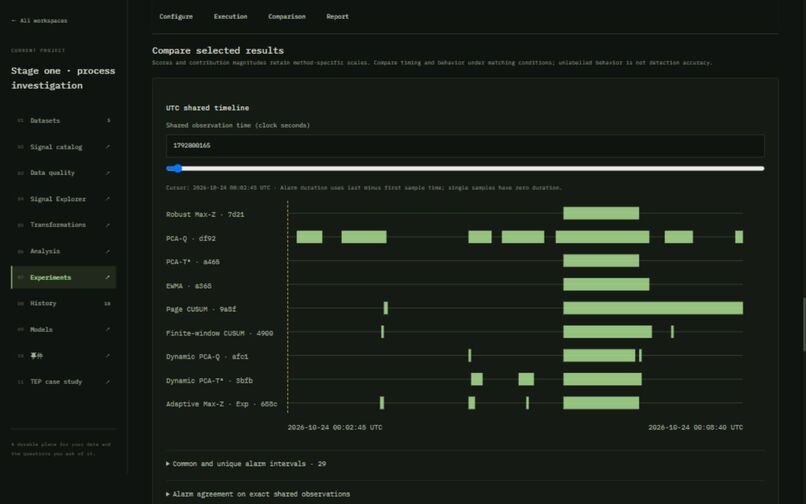
Experiment Workspace
-
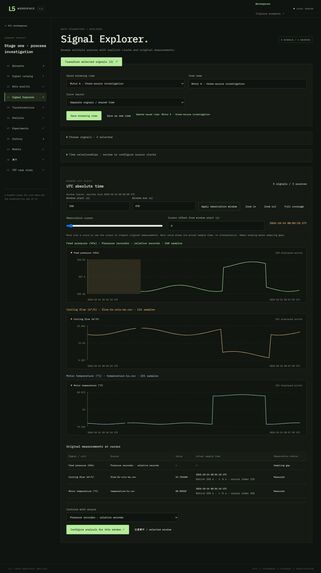
Signal Explorer
-
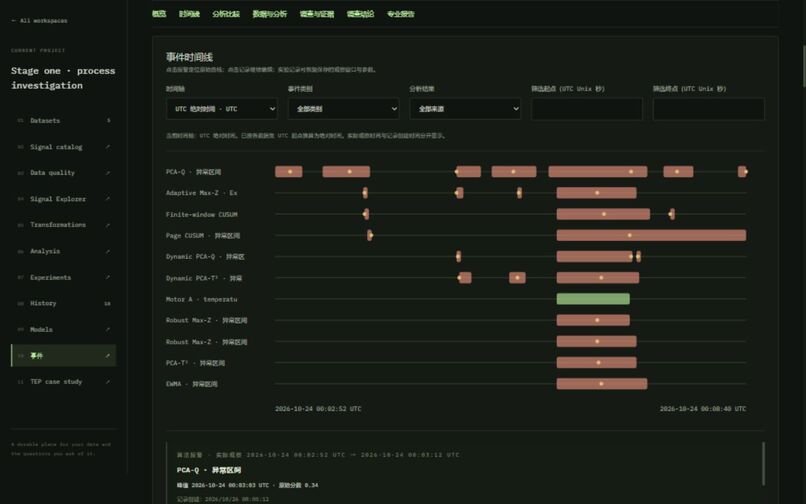
Incident Investigation
-
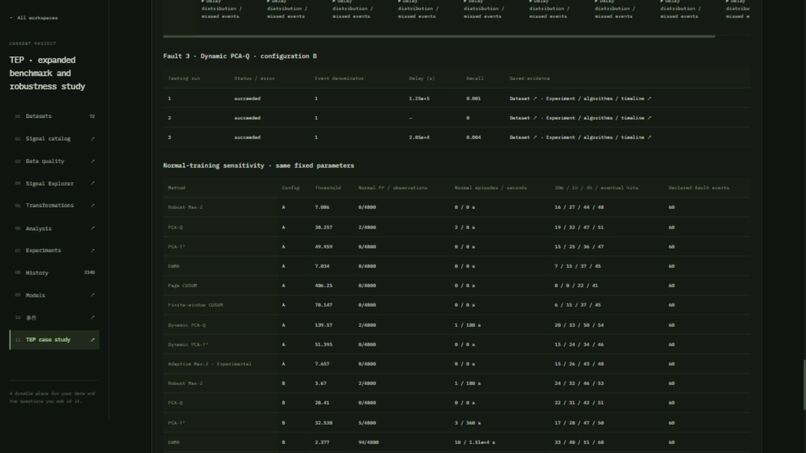
Tennessee Eastman
Inspiration
Industrial processes generate enormous amounts of sensor data, but detecting an anomaly is only the beginning. Engineers still need to determine which signals changed, compare different detection methods, investigate possible causes, and turn observations into actionable evidence.
I started L5 with a simple question: What if the entire journey from raw industrial data to a documented fault investigation could happen in one workspace?
L5 grew from a process monitoring experiment into an integrated platform for industrial time-series analysis, anomaly detection, simulation, and incident investigation.
What it does
L5 is an open-source industrial process analysis and investigation workspace.
It connects the complete analytical workflow:
Import Data → Explore Signals → Transform Data → Detect Anomalies → Compare Algorithms → Investigate Incidents → Generate Reports
Its main capabilities include:
- Industrial data management: Import CSV/TSV datasets, manage multiple data sources, inspect signal quality, and preserve analysis history.
- Signal processing: Synchronize time-series data, convert engineering units, resample measurements, handle missing values, and generate derived variables.
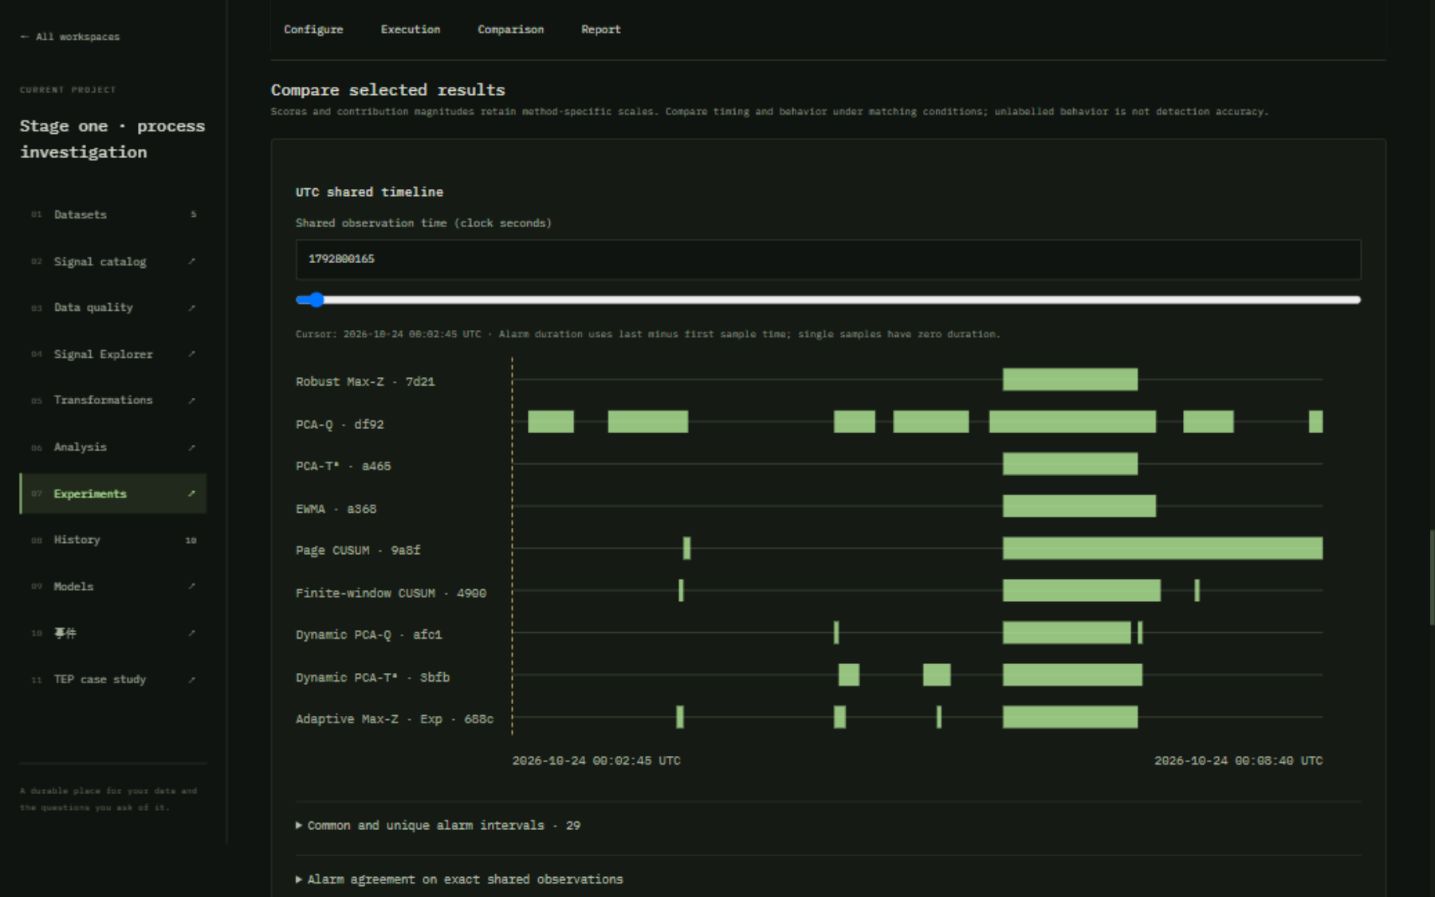
- Nine anomaly detection methods: Robust Max-Z, PCA-Q, PCA-T², EWMA, Page CUSUM, Window CUSUM, DPCA-Q, DPCA-T², and experimental Adaptive Max-Z.
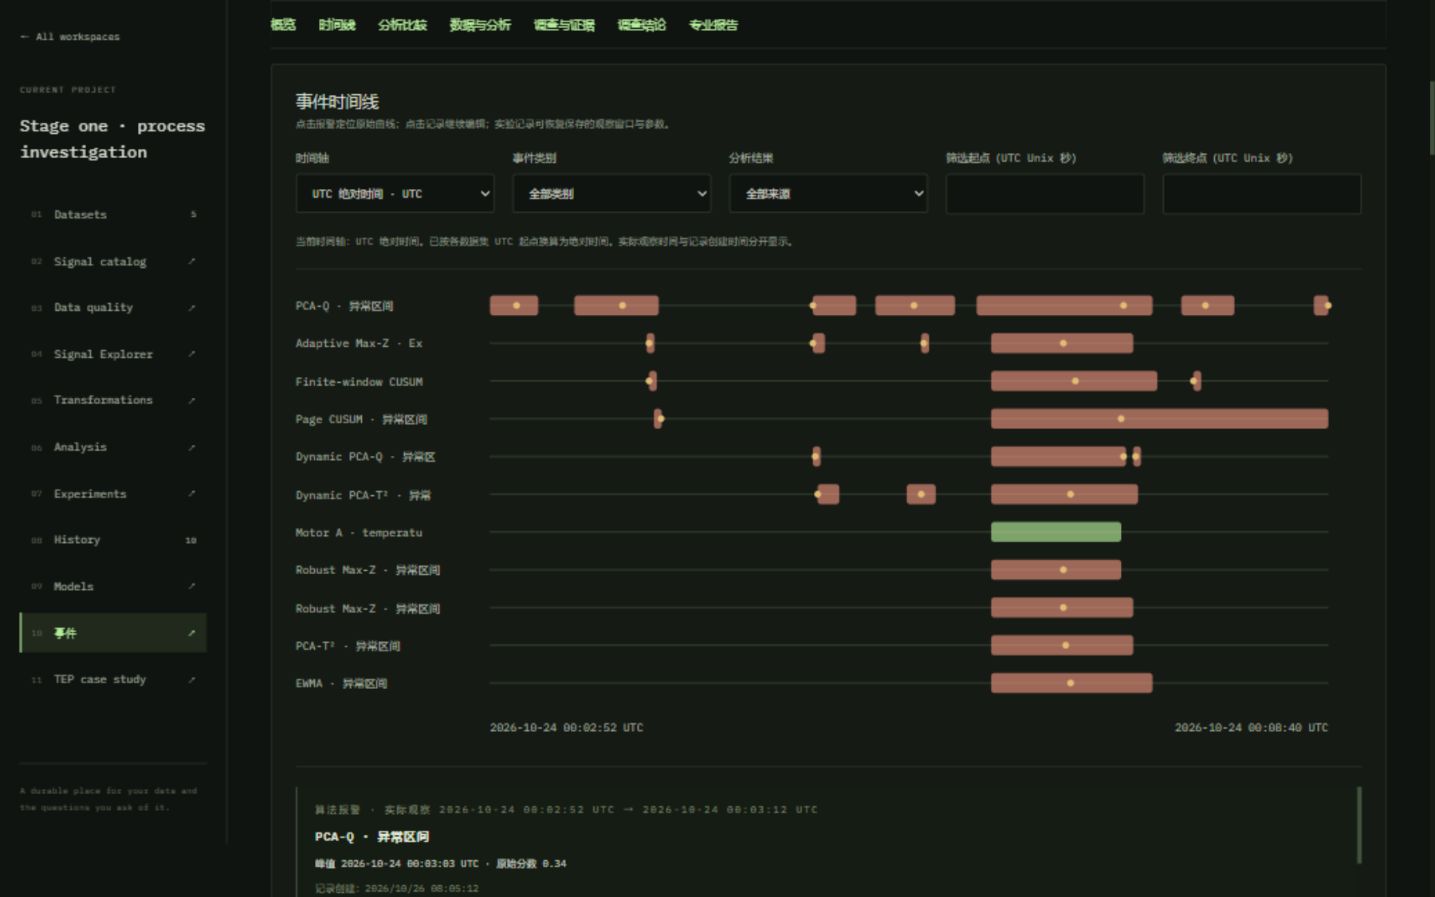
- Interactive investigations: Explore synchronized timelines, compare detector outputs, examine variable contributions, record hypotheses, and organize supporting or contradictory evidence.
- Process simulation: Experiment with fault scenarios using TripLens and a coupled-tank process model, including intervention comparisons.
- Experiment management: Run comparative studies across algorithms, parameters, and datasets, with persistent results and evaluation metrics.
- Reporting: Generate standalone HTML investigation reports with actual curves, evidence, parameters, and conclusions, with PDF export through the browser.
The application runs locally and maintains persistent workspaces, making it possible to resume an investigation across multiple sessions.
How I built it
L5 combines a modern web interface with a Python-based numerical analysis engine.
The frontend uses React 19, TypeScript, and Vite to provide interactive signal visualization, experiment dashboards, and investigation tools.
The backend uses Python, NumPy, and pandas for numerical computation and time-series processing, while SQLite manages persistent workspaces, experiments, incidents, and associated metadata.
The architecture connects signal processing, anomaly detection, model simulation, experimental evaluation, and investigation reporting through a shared data workflow.
Rather than treating every detector as a separate demonstration, L5 allows multiple algorithms to analyze the same data and presents their results within a common investigation environment.
Real-world benchmark: Tennessee Eastman Process
To evaluate L5 beyond simple demonstration scenarios, I integrated the publicly available Tennessee Eastman Process (TEP) simulation dataset, a widely used benchmark for industrial fault detection research.
The study covers:
- 52 industrial process variables
- 20 fault types
- 9 detection algorithms
- 3 normal-training configurations
- 2,340 successful experimental executions
The expanded benchmark and training-stability study cover 1,755 distinct combinations of training configuration, detector, and test run.
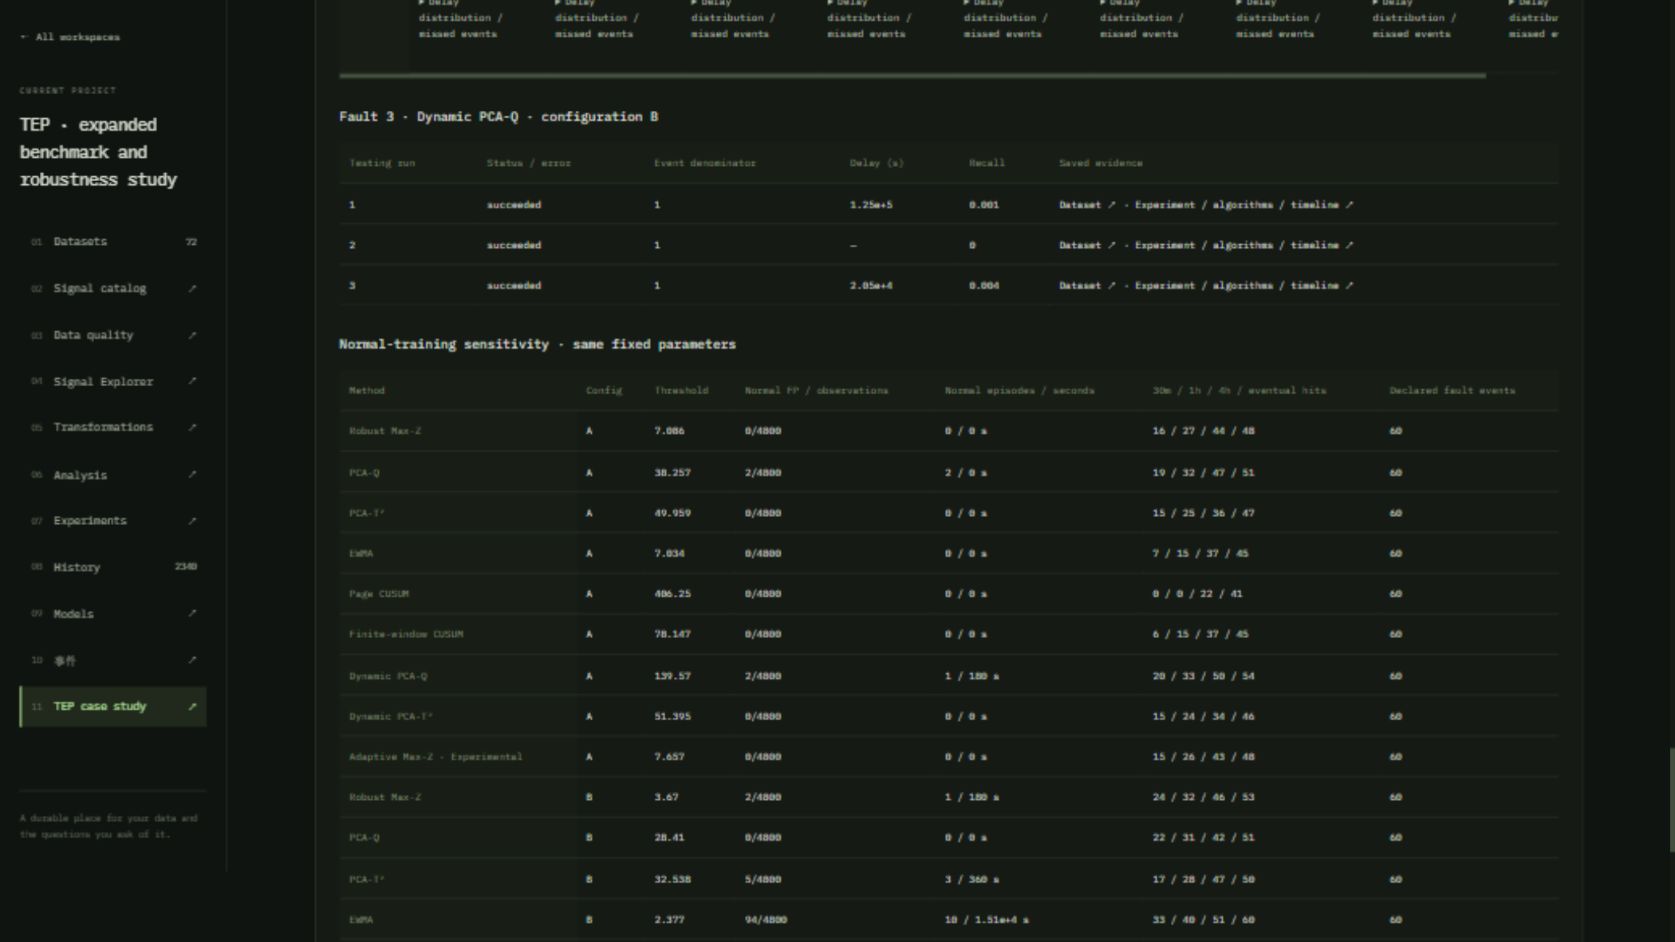
Under one fixed training configuration, DPCA-Q produced eventual nominal detections for 54 out of 60 fault events, including 20 detections within 30 minutes, with only 2 alarm samples across 4,800 normal samples.
The experiments also revealed an important result: detector performance can change substantially depending on the normal data used for training. For example, Page CUSUM generated 0, 739, and 1,833 normal-data alarm samples across three training configurations.
These findings demonstrate why industrial monitoring requires more than simply reporting detection accuracy. Detection delay, false alarms, training sensitivity, and fault-specific evidence all matter.
Challenges I faced
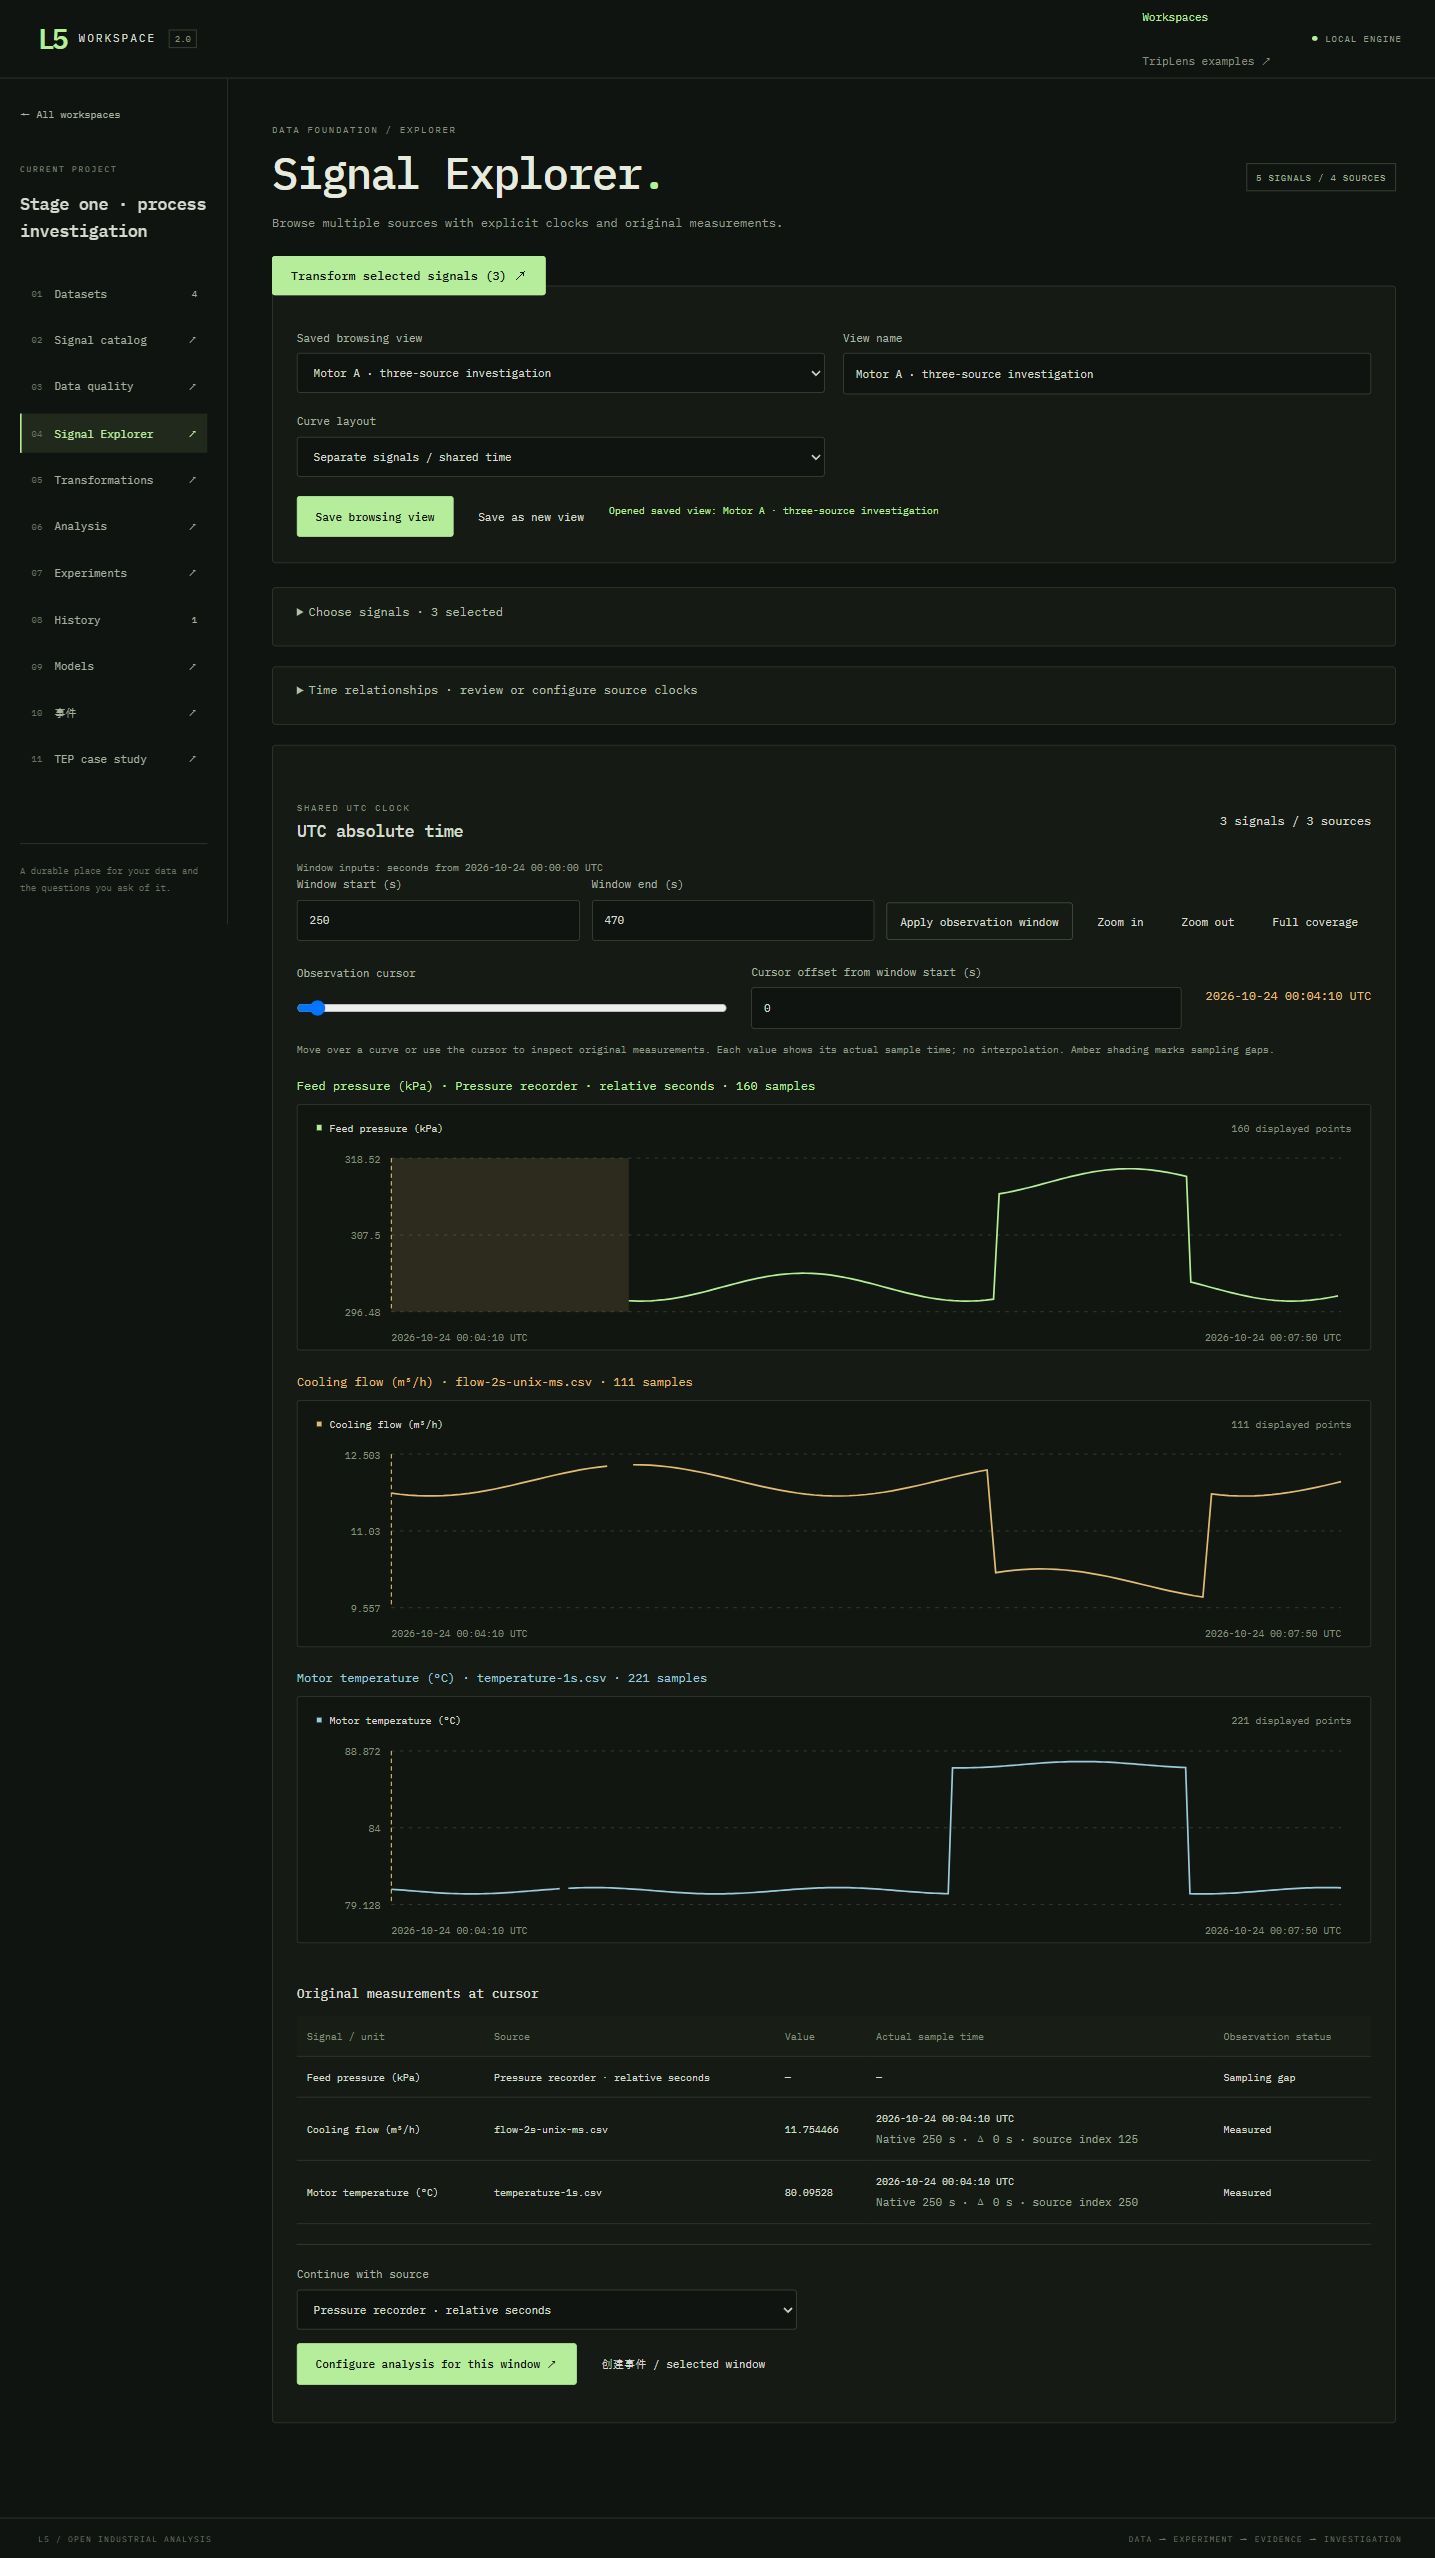
One major challenge was making different sources of industrial data work together. Signals may have different timestamps, units, sampling intervals, and missing observations. Building a consistent transformation pipeline was essential before meaningful comparisons could be made.
Another challenge was experimental evaluation. A detector may eventually raise an alarm without providing timely or fault-specific information. The Tennessee Eastman experiments showed how late alarms and normal-background behavior can complicate apparently successful detection results.
Connecting the research workflow to a usable application was equally important. Experimental results needed to remain accessible through signal exploration, investigation timelines, saved evidence, and reports.
What I learned
Building L5 reinforced an important lesson: an anomaly score is not an investigation.
Industrial process
Built With
- anomaly-detection
- cusum
- ewma
- industrial-monitoring
- javascript
- node.js
- numpy
- pandas
- pca
- python
- react
- sqlite
- time-series
- typescript
- vite

Log in or sign up for Devpost to join the conversation.