-
-
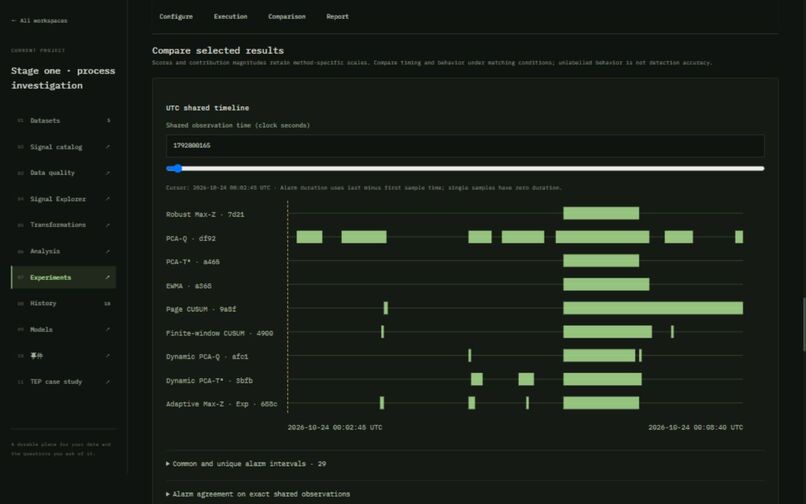
Experiment Workspace
-
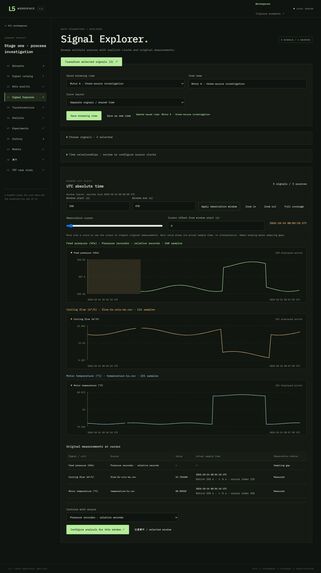
Signal Explorer
-
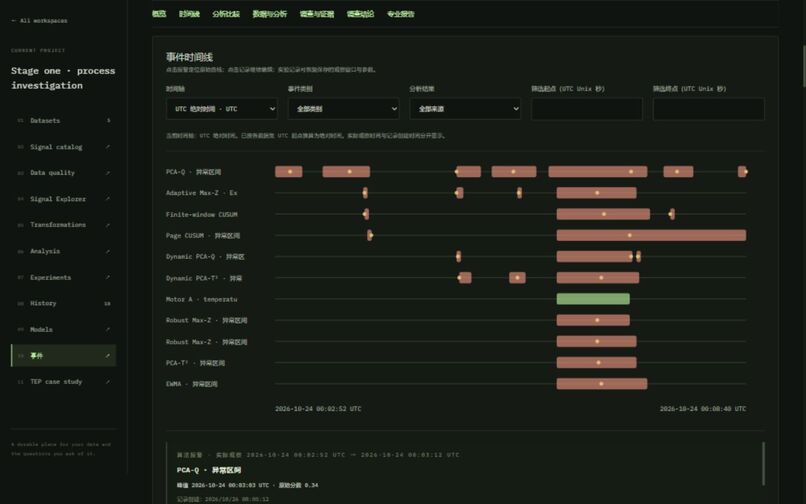
Incident Investigation
-
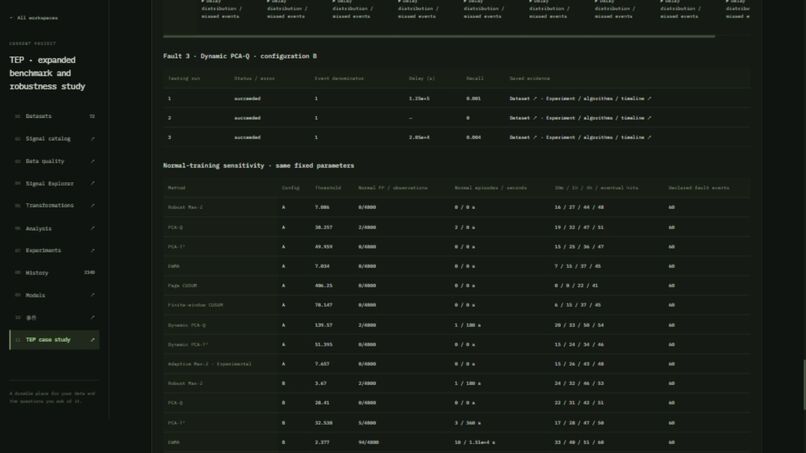
Tennessee Eastman
Inspiration — What happens after an alarm?
Imagine monitoring an industrial process with dozens of sensors. One sensor suddenly behaves abnormally. Then another. Soon, the monitoring system is producing multiple alarms.
But which alarm matters? What actually changed? Which measurements support a possible explanation? And how do you turn all of this into a useful investigation?
I am an undergraduate student studying automation engineering, and I wanted to build a tool that connects these steps.
That became L5 — From Alarm to Evidence, an open-source workspace for exploring industrial sensor data, detecting anomalies, investigating faults, and documenting findings.
The central idea is simple:
An alarm tells you something changed. L5 helps you investigate what happened.
What it does
L5 provides an interactive investigation workflow for engineering students and process-monitoring researchers.
1. Start with real data
Import CSV or TSV files containing time-series measurements such as temperature, pressure, and flow.
L5 organizes multiple sources, aligns their timestamps, handles missing measurements, converts engineering units, and generates derived signals.
2. Find anomalies
Run and compare nine anomaly detection methods, including PCA-Q, PCA-T², Dynamic PCA, EWMA, CUSUM, and Robust Max-Z.
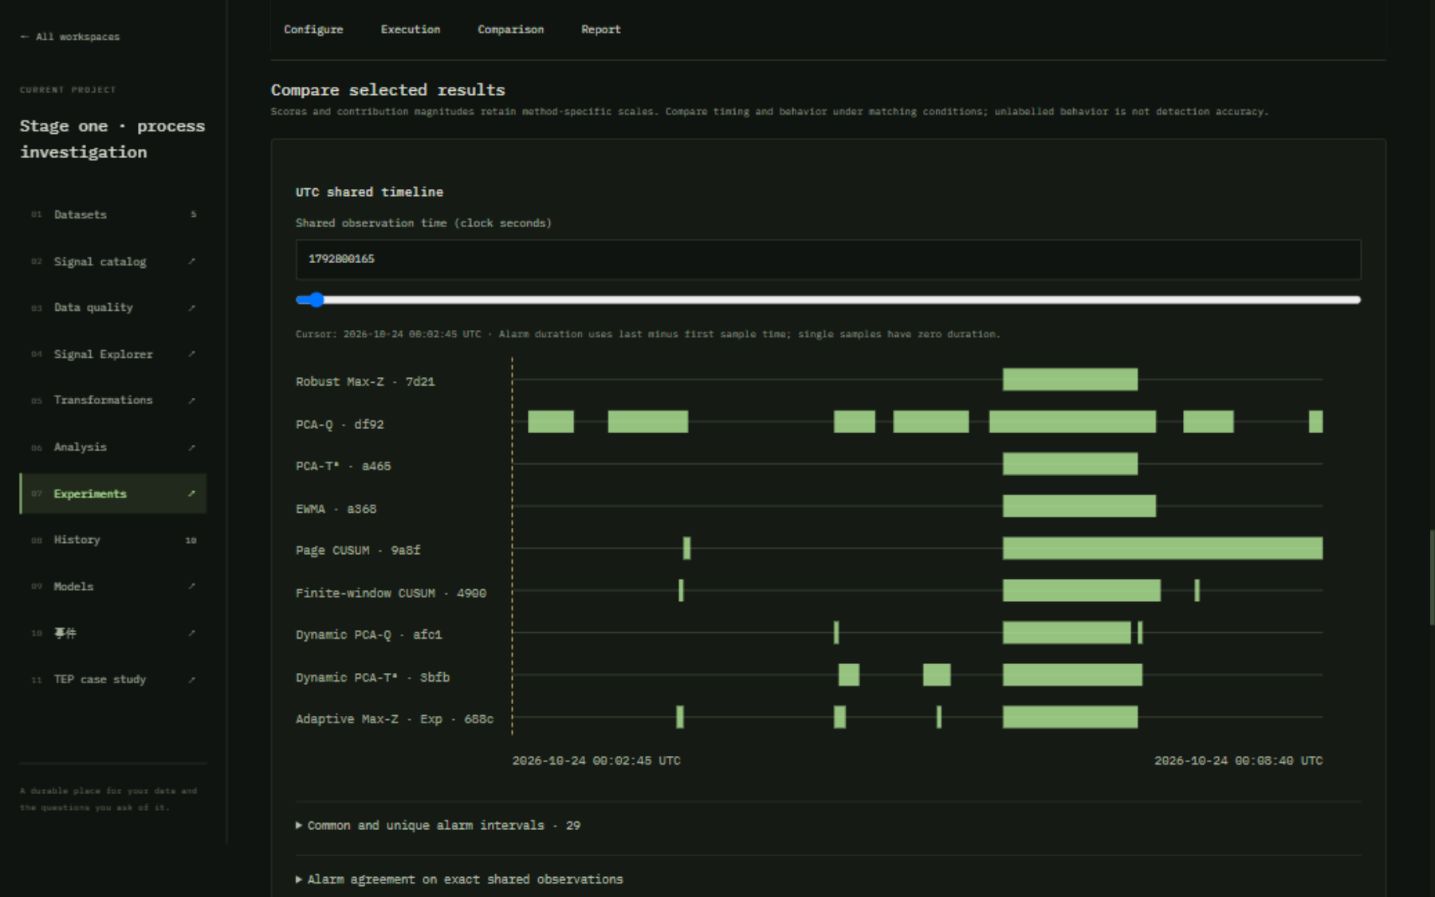
The interface shows monitoring scores, thresholds, abnormal intervals, and contributing variables.
Instead of viewing each method separately, users can compare their outputs on a shared timeline.
3. Investigate the evidence
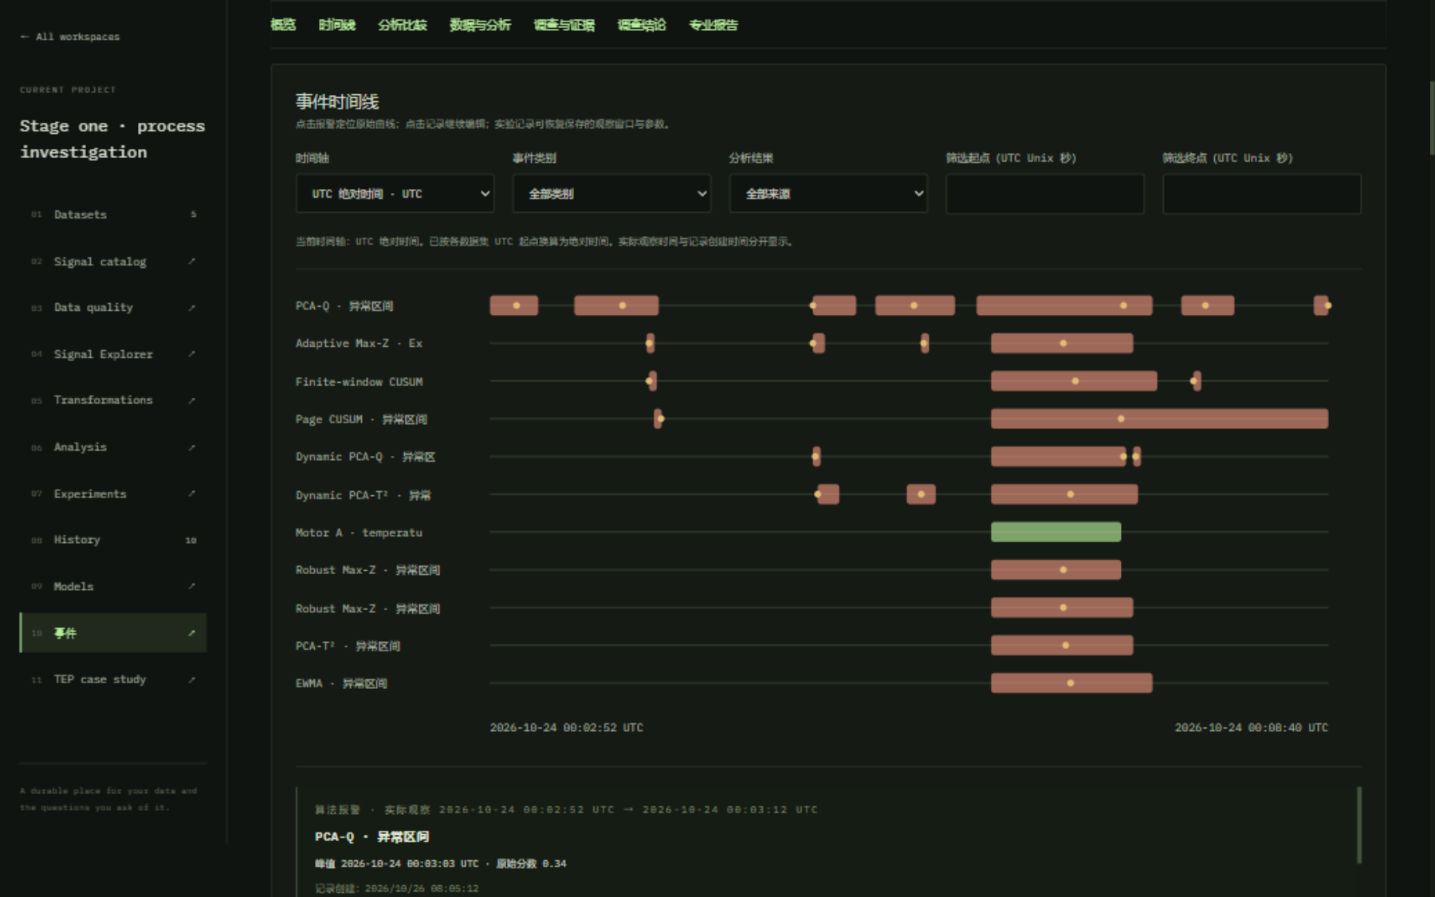
When an abnormal interval appears, users can create a persistent incident record.
The investigation workspace connects original measurements, detector outputs, candidate explanations, supporting and contradicting evidence, and investigation notes.
Users can return to previously saved investigations and examine how different algorithms responded to the same event.
4. Experiment with faults
L5 includes process simulation tools for generating and investigating faults.
TripLens supports 18 process signals and 12 fault scenarios, while the coupled-tank model simulates liquid-level dynamics, pump degradation, leaks, and other disturbances.
Users can explore how simulated faults propagate through measurements and compare modeled interventions.
5. Generate a report
Finally, L5 converts the investigation into a standalone HTML report containing actual measurements, monitoring results, evidence, analysis parameters, and conclusions.
The report can also be saved as a PDF through the browser.
The entire journey happens inside one persistent workspace.
How I built it
L5 combines a modern web interface with a local numerical analysis engine.
Frontend
- React 19
- TypeScript
- Vite
- Interactive time-series charts and investigation dashboards
Backend and computation
- Python
- NumPy and pandas
- Statistical monitoring algorithms
- Process simulation and numerical computation
Data and persistence
- SQLite for workspaces, experiments, and incident records
- CSV and NumPy-based numerical storage
- Structured JSON and HTML reporting
The application runs locally, without requiring a paid cloud API.
A key architectural decision was to make data exploration, analysis, simulation, and investigation share a consistent workspace. This allows users to move from a detected anomaly back to its original measurements, or from a simulated fault directly into a comparative experiment.
What was built during LaunchPad Hacks?
L5 began before the October 16, 2026 hackathon start date. Its earlier work included the TripLens process simulator, investigation interface, alarm analysis, and intervention experiments.
During the October 16–November 20 event window, development significantly expanded the original research prototype.
The GitHub history documents the following completed additions from October 23–26:
- A persistent, general-purpose Workspace for imported industrial datasets.
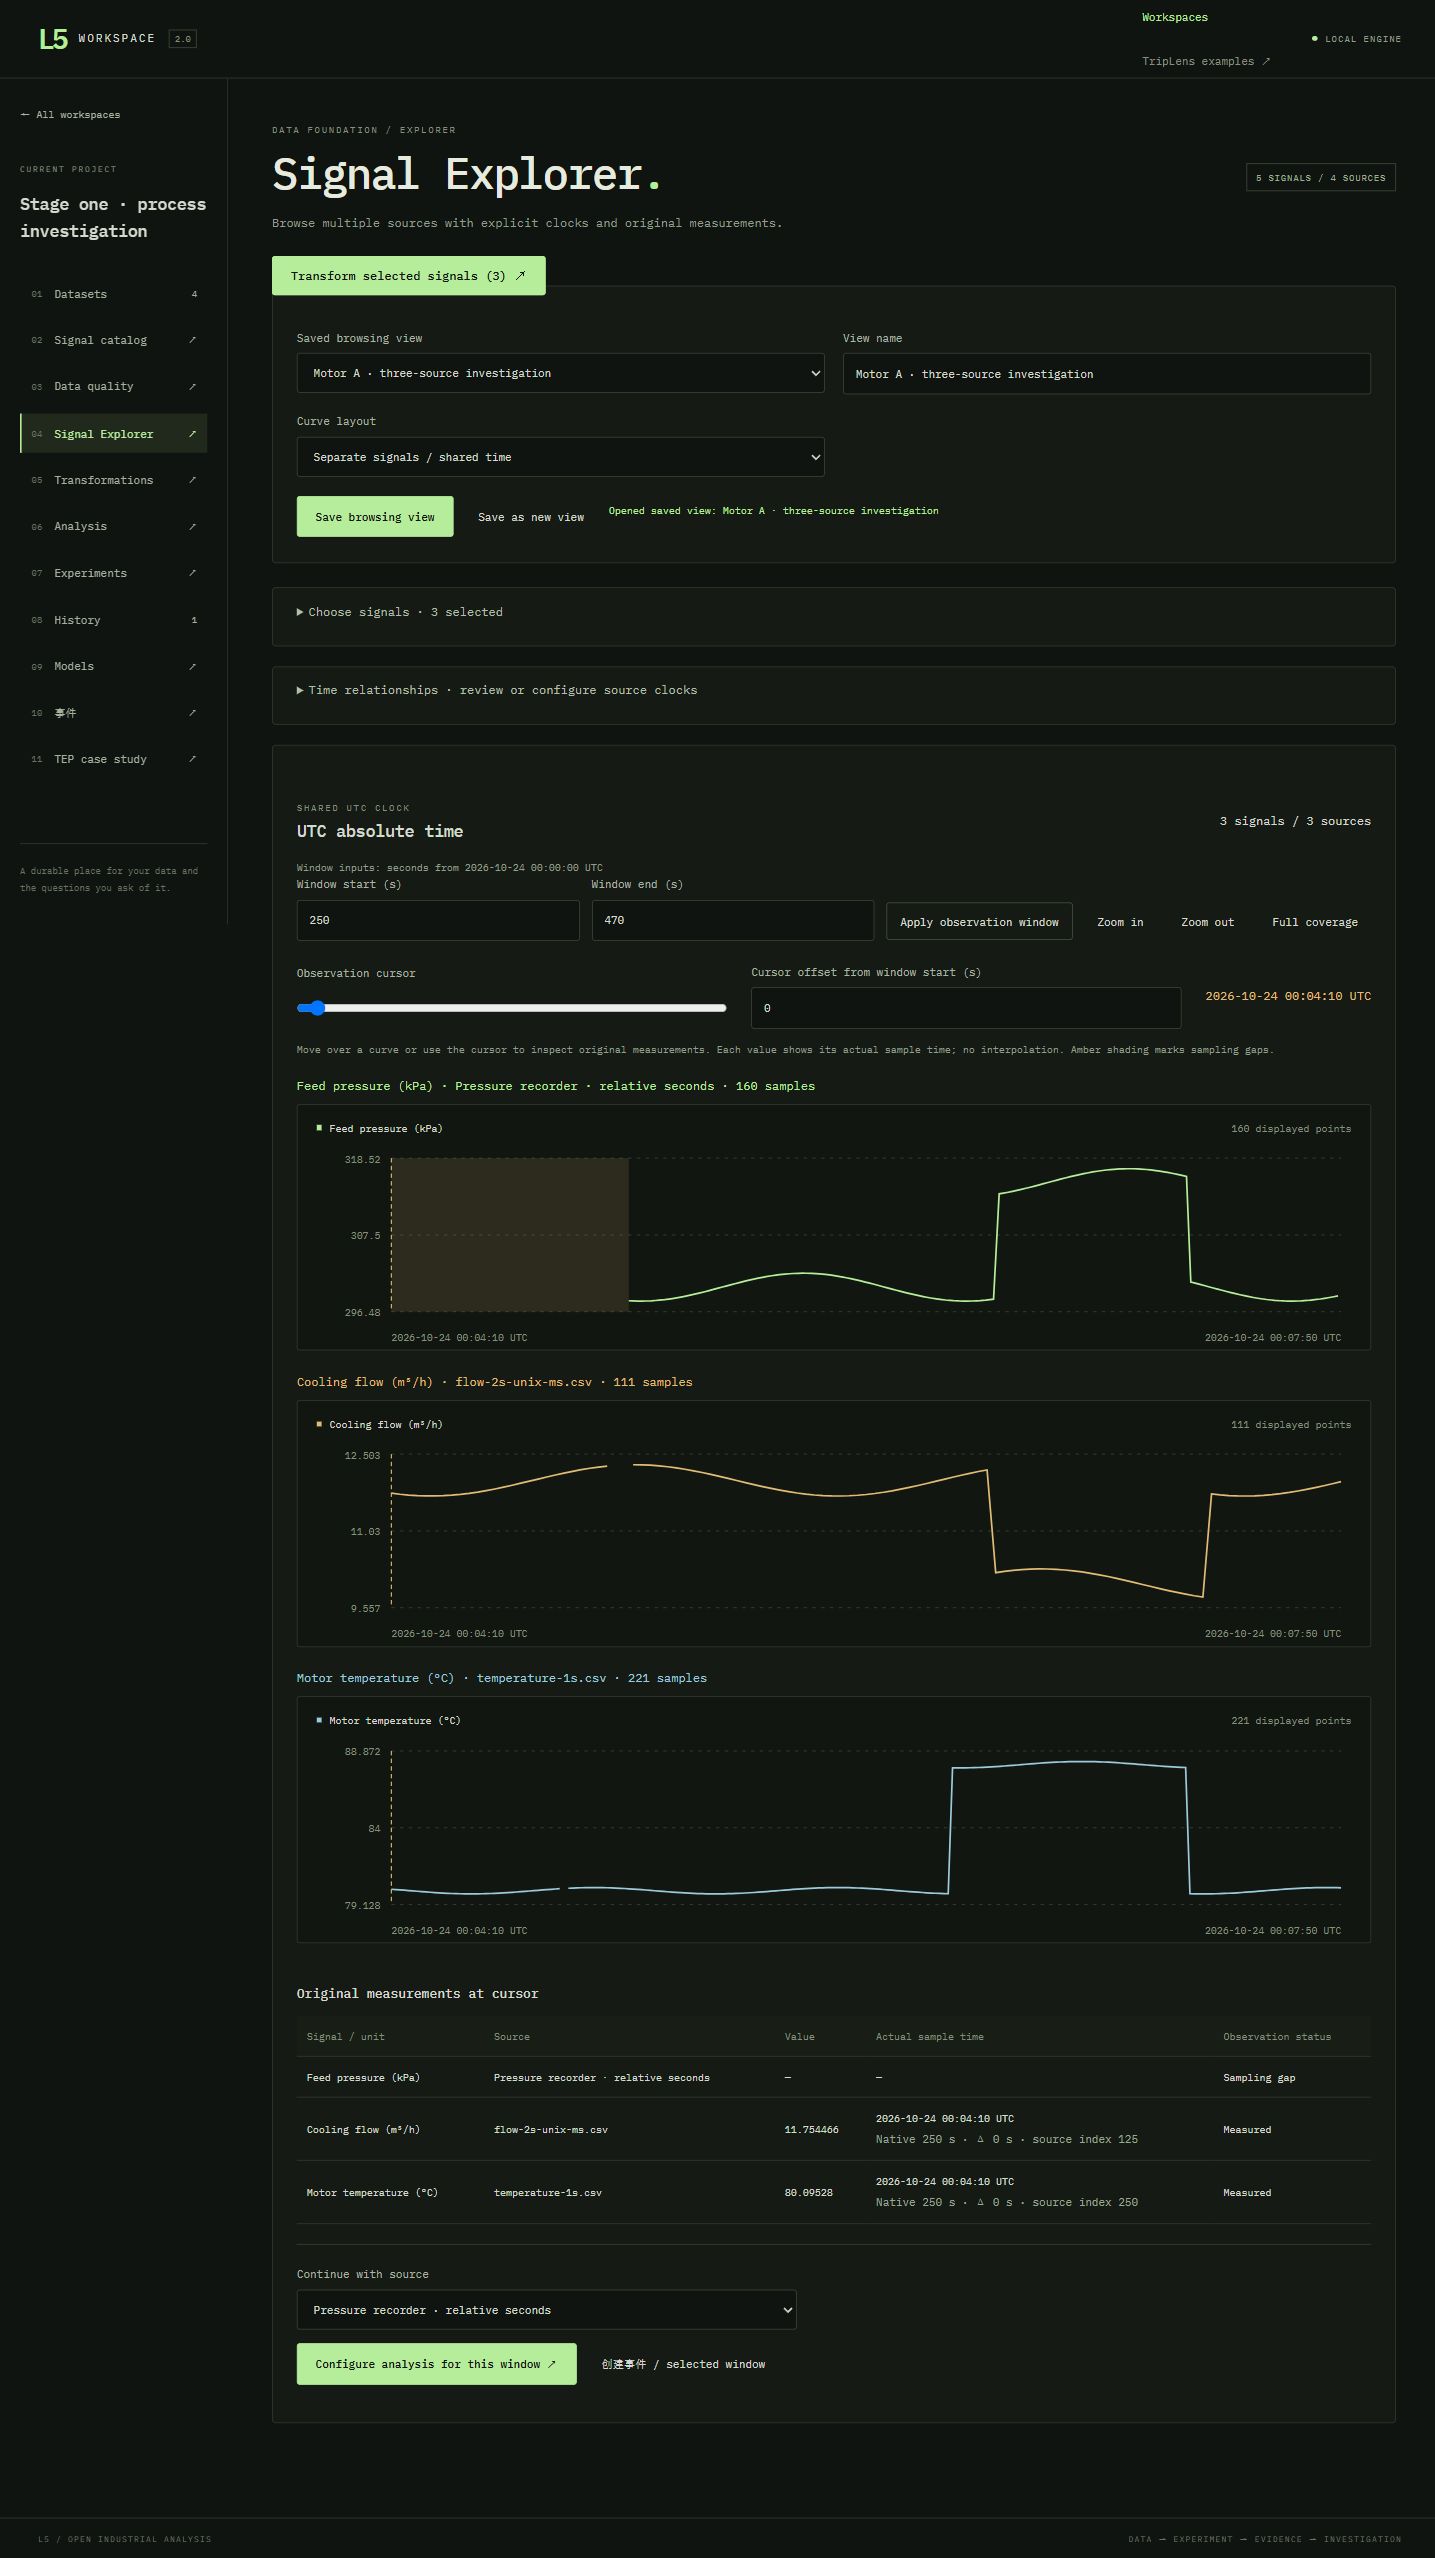
- Multisource signal exploration, time synchronization, and data-quality inspection.
- A transformation pipeline for resampling, unit conversion, missing values, and derived signals.
- A unified nine-algorithm analysis and experiment workspace.
- Persistent incident records, investigation timelines, algorithm comparisons, and report generation.
- A model and scenario workspace supporting TripLens and coupled-tank simulation.
- A Tennessee Eastman Process benchmark integration, including expanded experiments and training-stability evaluation.
- Improved product presentation, navigation, and multilingual interface support.
These developments turned L5 from a specialized process investigation prototype into a broader industrial analysis environment.
The repository preserves the development history and individual contributions:
https://github.com/dongxuelian2/L5/pulls
Testing it with the Tennessee Eastman Process
A working interface is useful, but I also wanted to understand how the algorithms behave on a recognized industrial benchmark.
I integrated the publicly available Tennessee Eastman Process simulation dataset, containing 52 process variables and 20 fault types.
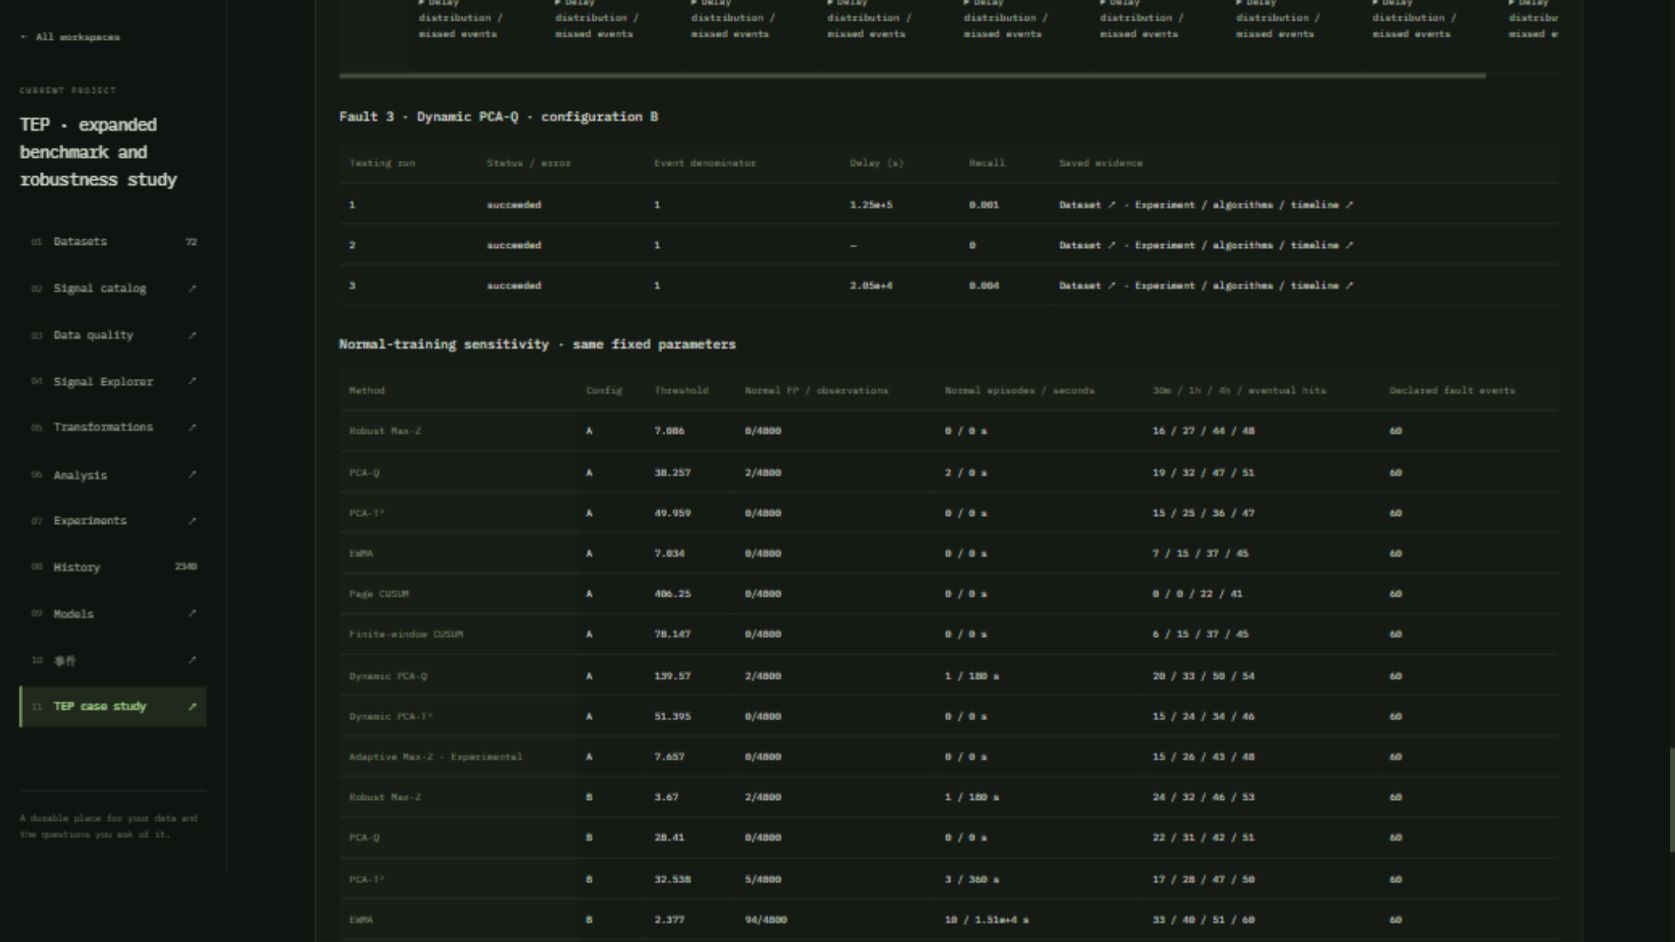
The expanded benchmark and training-stability study completed 2,340 successful experimental executions, covering 1,755 distinct training-configuration, detector, and test-run combinations.
Under one fixed configuration:
- PCA-Q produced 51 eventual nominal detections across 60 fault events, including 19 within 30 minutes.
- DPCA-Q produced 54 eventual nominal detections, including 20 within 30 minutes.
- Each method produced only two alarm samples across 4,800 normal test samples.
The experiments also revealed substantial differences in false-alarm behavior when the normal training data changed.
This helped shape the product's emphasis on comparing algorithms and examining evidence rather than presenting a single anomaly score.
Challenges I faced
Different sensors, different timelines
Industrial measurements are rarely perfectly aligned. Signals can have different units, sampling rates, timestamps, and missing observations.
Creating a consistent transformation pipeline was one of the most important steps in making the workspace usable with multiple data sources.
Connecting detection to investigation
Generating anomaly scores was relatively straightforward compared with building a coherent workflow around them.
The challenge was preserving the connection between a detection result, the original measurements, the observation window, the investigation notes, and the final report.
Understanding false alarms
The Tennessee Eastman experiments showed that some algorithms produced very different results when trained on different normal datasets.
I learned that an eventual alarm is not always a useful early warning, and that evaluation must include detection timing and normal-data behavior.
What I learned
A useful engineering tool is more than a collection of algorithms.
The most important improvement was bringing multiple analytical steps into one understandable workflow.
I also learned that careful experimental evaluation often reveals more about a monitoring method than its apparent detection rate.
Building L5 helped connect concepts from control engineering, numerical computation, statistical monitoring, software architecture, and interface design.
What makes L5 different?
L5 combines four capabilities in a single application:
- Multisource industrial data preparation.
- Comparative anomaly detection.
- Interactive fault investigation with traceable evidence.
- Process simulation and reproducible experimental evaluation.
Users can work from their own datasets or from bundled simulation scenarios, explore anomalies, examine supporting measurements, and export structured findings.
The software is currently evaluated through simulation and public benchmark data. Industrial-site deployment and operational validation are future development goals.
What's next?
I plan to expand L5 with additional industrial datasets, improved fault diagnostic methods, and more process simulation models.
I also want to make it easier for engineering students to explore failure scenarios and for researchers to reproduce comparisons between monitoring methods.
The longer-term goal is a practical, extensible environment for learning, experimenting with, and investigating industrial processes.
Open source and credits
L5 is available under the MIT License.
The project uses open-source development libraries and publicly available research datasets, including the Tennessee Eastman Process data published by Rieth and collaborators.
AI coding assistants, including Codex, were used to support implementation, testing, and documentation. Development history and changes are recorded in the public GitHub repository.
Source code: https://github.com/dongxuelian2/L5
Benchmark results: https://github.com/dongxuelian2/L5/blob/main/docs/tep-benchmark-expanded.md
Video demonstration: https://www.youtube.com/watch?v=CpWqTTaBvnQ
Built With
- anomaly-detection
- cusum
- data-visualization
- javascript
- machine-learning
- numpy
- pandas
- pca
- python
- react
- simulation
- sqlite
- time-series
- typescript
- vite

Log in or sign up for Devpost to join the conversation.