-
-
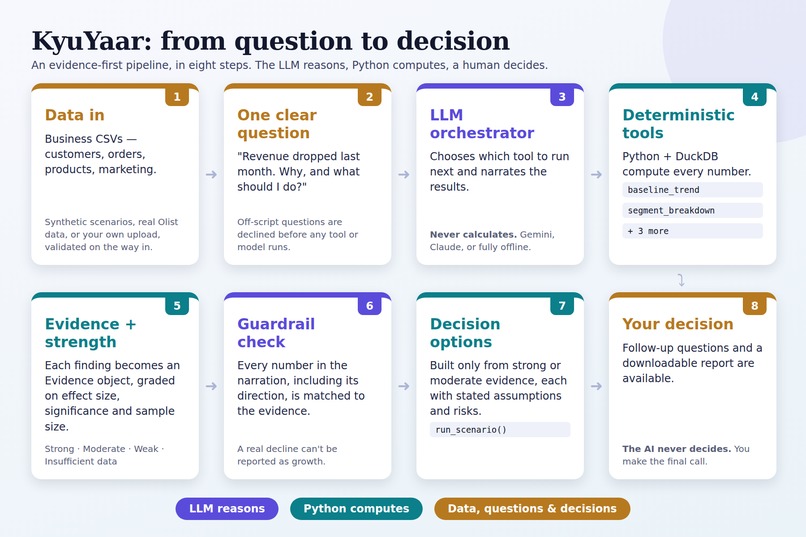
KyuYaar: Pipeline Architecture
-
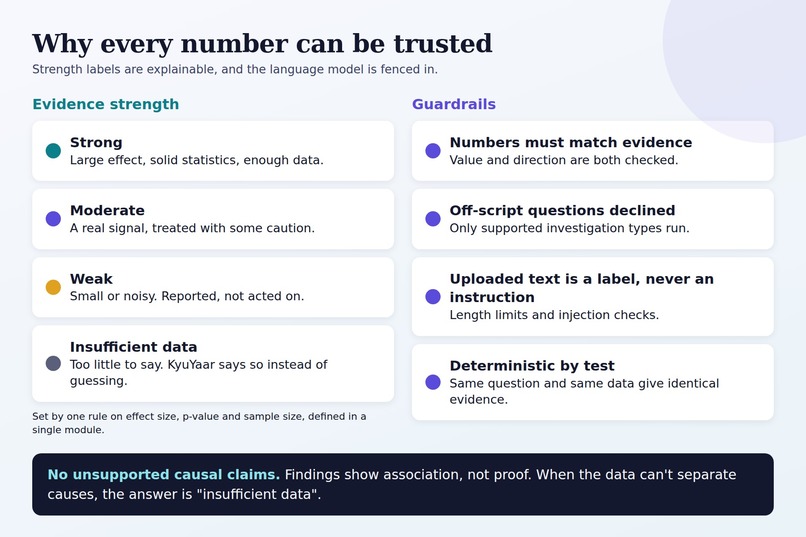
KyuYaar: Workings
-
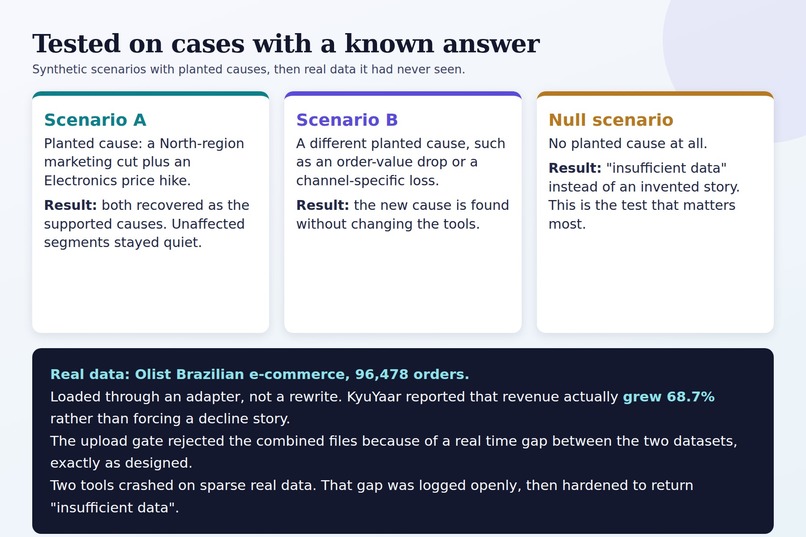
KyuYaar: Demonstrated Piece
-
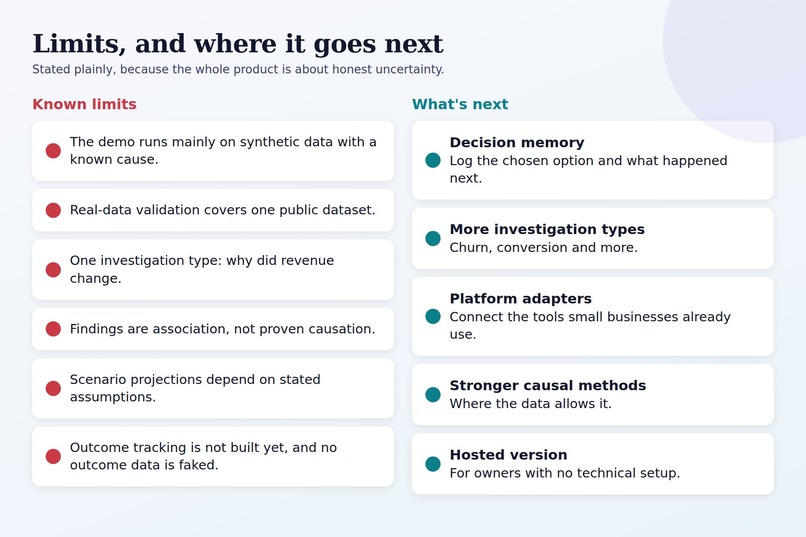
KyuYaar: Limitations & Future Scope
The Inspiration
Working with Popcorn Media, an agency, I saw firsthand how much small numbers can matter; a few percentage points in the wrong direction, ignored or misread, can cost a business real money. Later, during my internship at Saregama, one of the oldest record labels in India, doing customer segmentation for marketing campaigns, I got a much closer look at how messy real data actually is and how easy it is to draw the wrong conclusion from it if you're not careful.
Those two experiences left me with the same frustration: most tools that help a business owner understand "why did this number move?" either stop at showing that it moved, or jump straight to a confident-sounding story with nothing underneath it. I wanted to build something that sits between those two failure modes i.e. a system that actually investigates before it concludes, the way a good analyst would if you handed them the data and no time to overthink it.
What it does
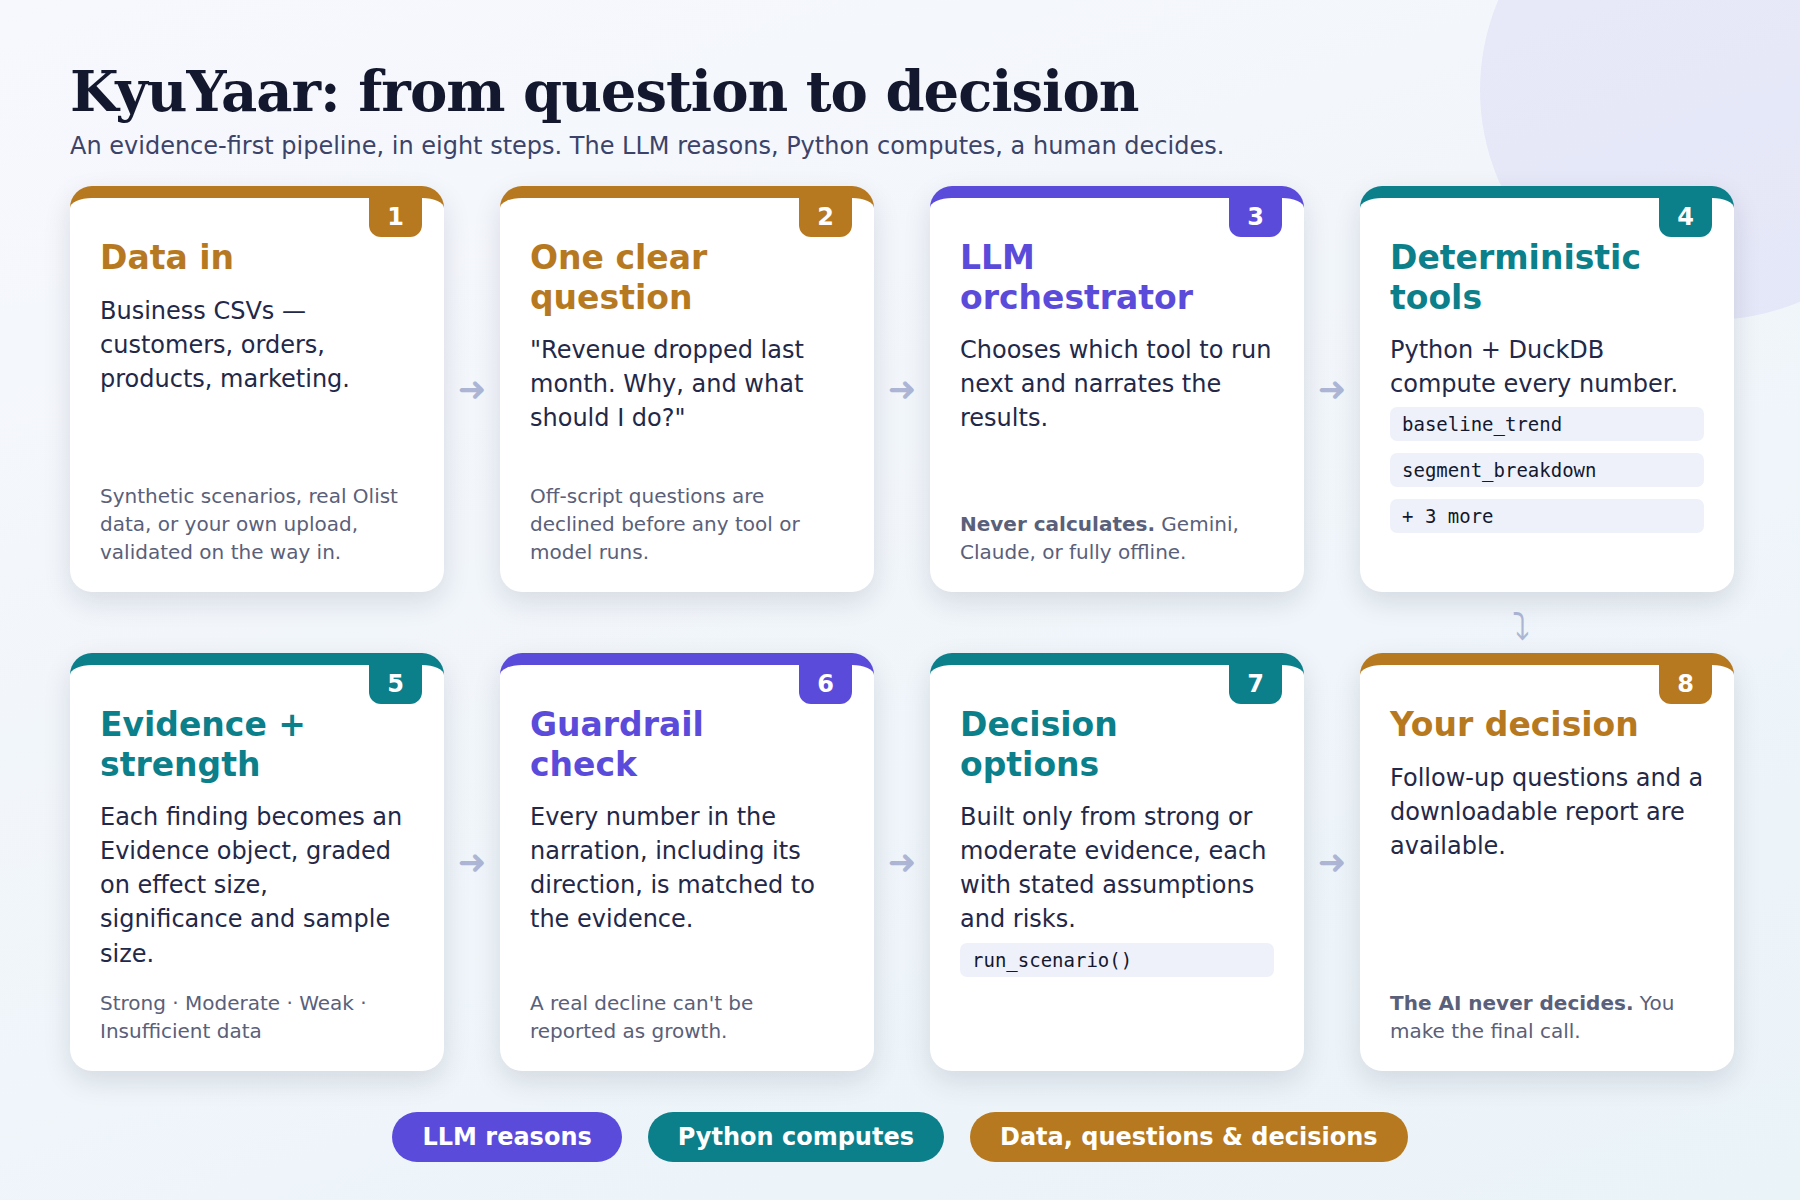
KyuYaar is an AI investigator for small businesses, student ventures and small organizations that have operational data (orders, products, customers, marketing spend) but no analyst on staff. You ask it something like "revenue dropped last month — why, and what should I do?", and it runs a real investigation instead of guessing:
- Confirms the metric actually moved, against its own baseline.
- Splits the change into fewer orders vs. smaller orders.
- Finds where the change is concentrated — which region, which category.
- Tests marketing spend and pricing as candidate causes, each against a control group of segments where that driver didn't move.
- Checks whether a marketing effect is channel-specific or region-wide.
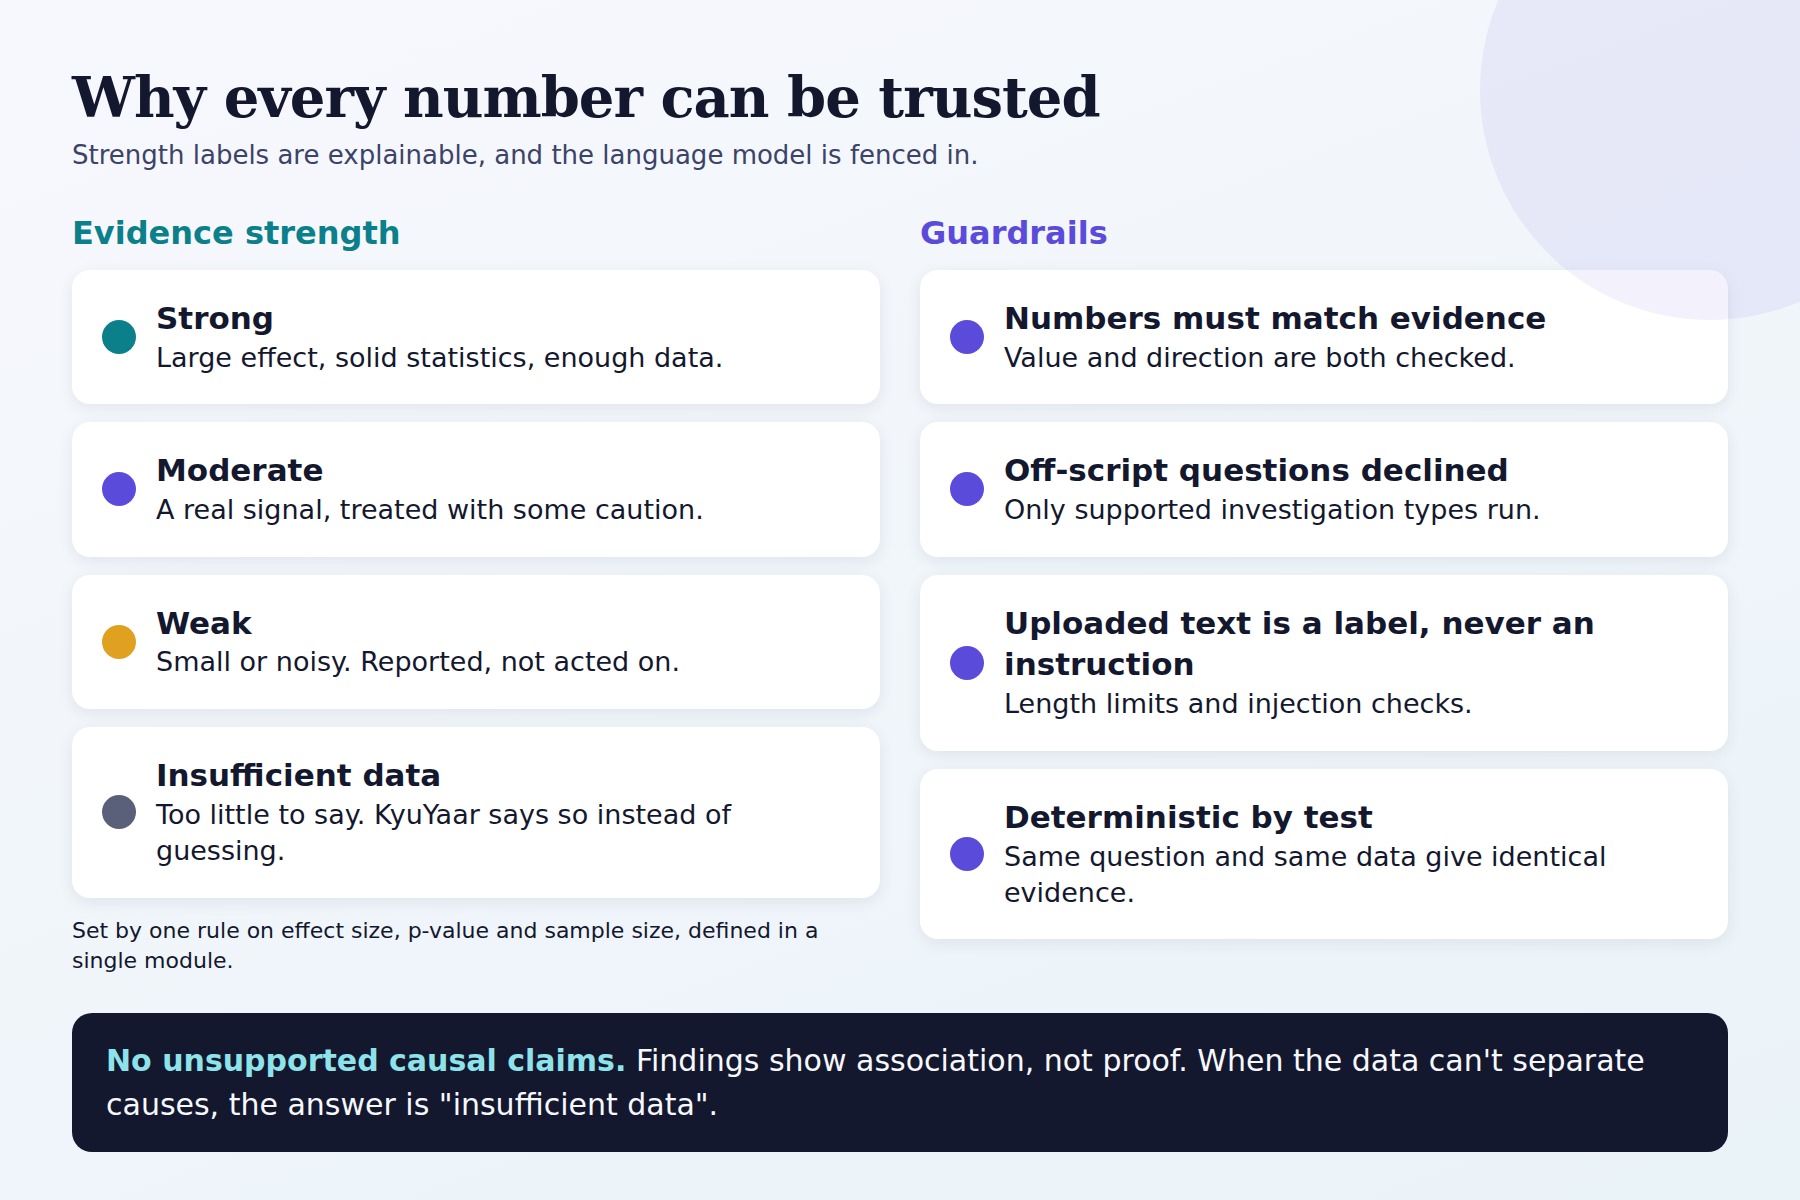
Every one of those steps is a deterministic Python calculation. The LLM's job is to choose which tool to call next and narrate the results in plain language — never to produce a number itself. A guardrail checks every model-written sentence against the underlying evidence, including its direction, and discards anything unsupported. Findings are graded strong, moderate, or weak based on effect size, statistical significance against a comparison group, and sample size — not an arbitrary percentage cutoff.
From there, KyuYaar turns supported findings into decision options, each with its assumptions and risks stated plainly, and a scenario engine that projects what an option is worth under assumptions the user sets, with the arithmetic shown step by step. Nothing is decided for you: options are ranked and one may be marked "Recommended," but the choice is always the human's.
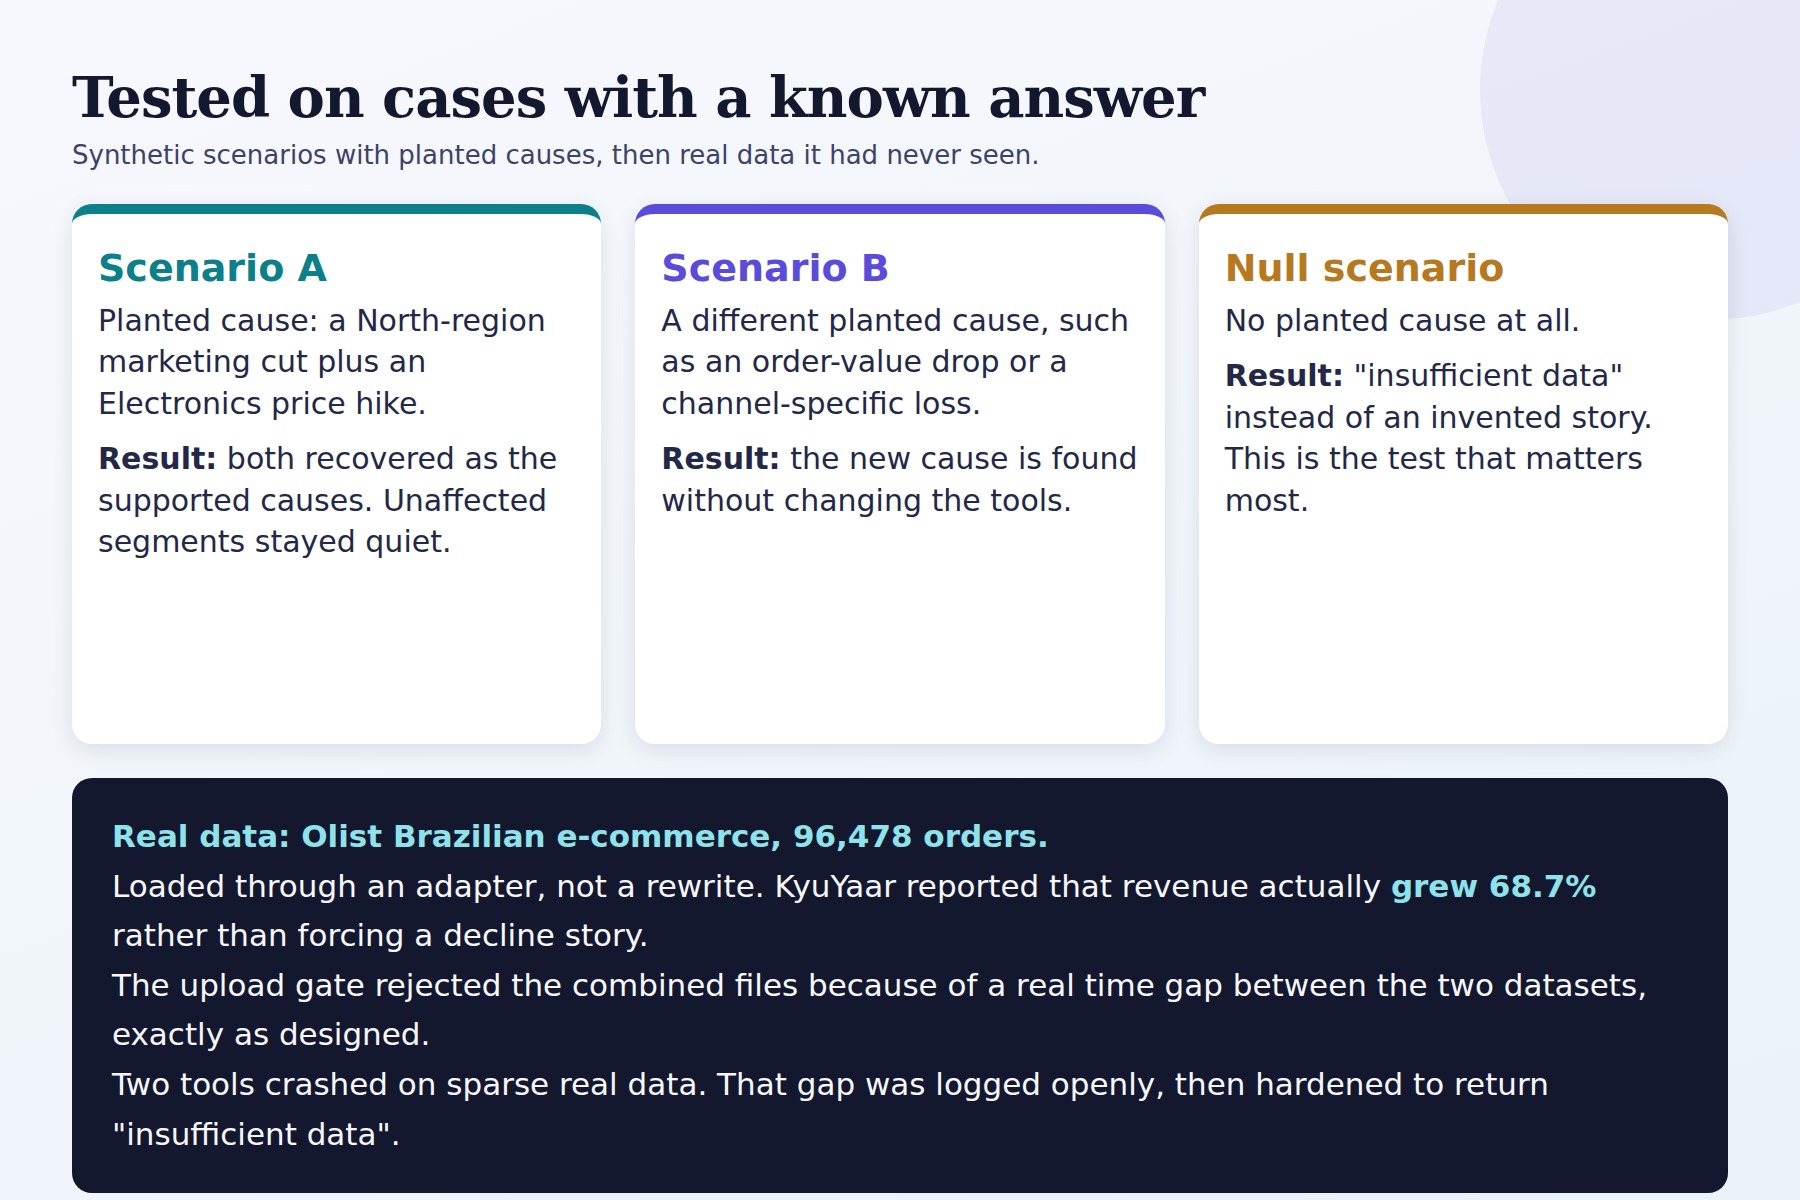
It also handles the honest cases: if the evidence doesn't clearly point anywhere, it says so, instead of manufacturing a story.
Try it live: link — no signup or API key required, it runs fully offline with deterministic templates if no model key is set.
How I built it
I built this in layers and made a rule for myself early on: every layer had to be a complete, working system on its own, not a partial feature. If I ran out of time, whatever I'd finished would still be a real, demoable thing.
Layer 1 was the core proof of concept: a synthetic dataset with a known, injected cause, plus two evidence-generating functions, run in plain Python with no LLM and no UI. I checked the output by hand before building anything on top of it. Layer 2 wired an LLM orchestrator on top of those tools (tool-calling, evidence-to-sentence narration) and built the four-screen Streamlit UI: command center, investigation progress, evidence, decision. This was the first end-to-end submittable version. Layers 3–6 deepened the investigation: splitting revenue drops into order-count vs. order-value effects, adding marketing-channel analysis as a third hypothesis category, building the scenario engine that projects impact under stated assumptions, and adding follow-up Q&A, trend charts, and a downloadable report. Layer 7 added two more synthetic scenarios with different (and no) injected causes, checked over many random draws, plus a bring-your-own-CSV upload path with real schema and value validation. Layer 8 added a ranking layer (recommend()) that scores actionable options by projected, risk-adjusted gross profit — and can decide that no option is worth recommending. Layer 9 was the real-data test: an adapter mapping Kaggle's Olist Brazilian e-commerce dataset (~96,000 real orders) onto KyuYaar's schema, run through the unmodified tools. Layer 10 was a UI/UX pass based on watching a real person use it — plain-language step labels, hover explanations, colour presets, a scenario waterfall chart. Layers 11–13 hardened the system: tools that used to crash on sparse real-world data now return "insufficient data" evidence instead; the guardrail now checks the sign of a figure, not just its magnitude, so a model can't flip a decline into a rise and get away with it; and every free-text label from an upload (region, category, channel names) is now treated as untrusted, length-capped, and screened for text that reads like an instruction to the model.
The whole thing is backed by 415 automated tests, including a full determinism test (same question, same data, always the same evidence) and 51 tests specifically for the prompt-injection hardening in Layer 13.
Challenges I ran into
Real data breaks tools synthetic data never tests. Running the Olist dataset through KyuYaar for Layer 9 was the single most useful thing I did. The core investigation tools ran clean but two of the cause-testing functions crashed outright on sparse, real-world edge cases i.e. a region with one or two orders in a month, a channel with zero spend in both comparison periods. Synthetic data never has those shapes by construction. Fixing that (Layer 11) meant deciding, carefully, which inputs are genuinely "insufficient data" versus which should still get a graded result.
Making "the model never invents a number" actually true, not just a design goal. Early on it was easy for a narration to say "+12%" when the evidence said -12%, because my first guardrail checked magnitude but discarded sign. That's a subtle bug with a real consequence, someone acting on a flipped conclusion, so I added an explicit directional check and tests for exactly that failure.
Treating uploaded data as untrusted input, not just untrusted formatting. Validation usually means checking types and ranges. But region, category, and channel names from an upload get serialized straight into the model's context, and nothing was stopping a hostile-looking value from reading as an instruction. I added a deny-list, a length cap, and an explicit system-prompt boundary, then verified it three ways: a synthetic hostile value rejected at upload, the offline path proven inert against it, and a scripted model that tries to obey it still blocked at the guardrail. I also ran it against a real Gemini model live — after two of the models I tried gave a 503 from provider overload, gemini-3.5-flash-lite completed the run driving all nine tool calls itself, with the hostile label showing up only as inert data in its output.
Deciding what not to build. The temptation with an "AI + data" project is to add a chatbot, a generic dashboard, or a fake multi-agent architecture for its own sake. I kept cutting those in favor of one investigation type done rigorously, because a shallow version of everything would have undermined the one thing I actually wanted to prove: that an LLM can orchestrate an investigation without ever being trusted to do the math.
Accomplishments that I'm proud of from KyuYaar
A system where I can point to any number a user sees and trace it to a specific, testable Python function — nothing in the output path is a model hallucination waiting to happen. It doesn't just work on the synthetic data it was built and tuned on — it ran against real, messy Olist e-commerce data, and where it failed, I could see exactly why and fix it without touching the analytical logic. It knows how to say "the data doesn't support a cause" instead of inventing one, and that's tested, not just claimed. The prompt-injection hardening in Layer 13: designing it, then actually proving it works at three different levels (validation, an offline deterministic run, and a live model), rather than assuming a system prompt sentence was enough. 415 passing tests across 13 layers, built incrementally so the project was always a demoable, working thing, never a pile of half-finished features.
What I learned
Technically, I learned how much of "trustworthy AI" is really about architecture, not prompting — the guardrail that checks the model's own words against ground truth, and the decision to route every number through deterministic code, did more for reliability than any amount of careful prompt-wording could have.
I also learned that real data is where a project's actual weaknesses show up. Synthetic test data is necessary but not sufficient — Layer 9's Olist run surfaced two real bugs that eleven layers of synthetic testing had never triggered, and that reframed how I think about "done."
And I learned to take security seriously even in a hackathon project with no real users yet. Treating uploaded free-text as untrusted input wasn't in my original plan; it came from asking "what happens if someone at a hackathon table uploads something adversarial," and then actually building and testing the answer instead of assuming the existing guardrail would cover it.
What's next for KyuYaar
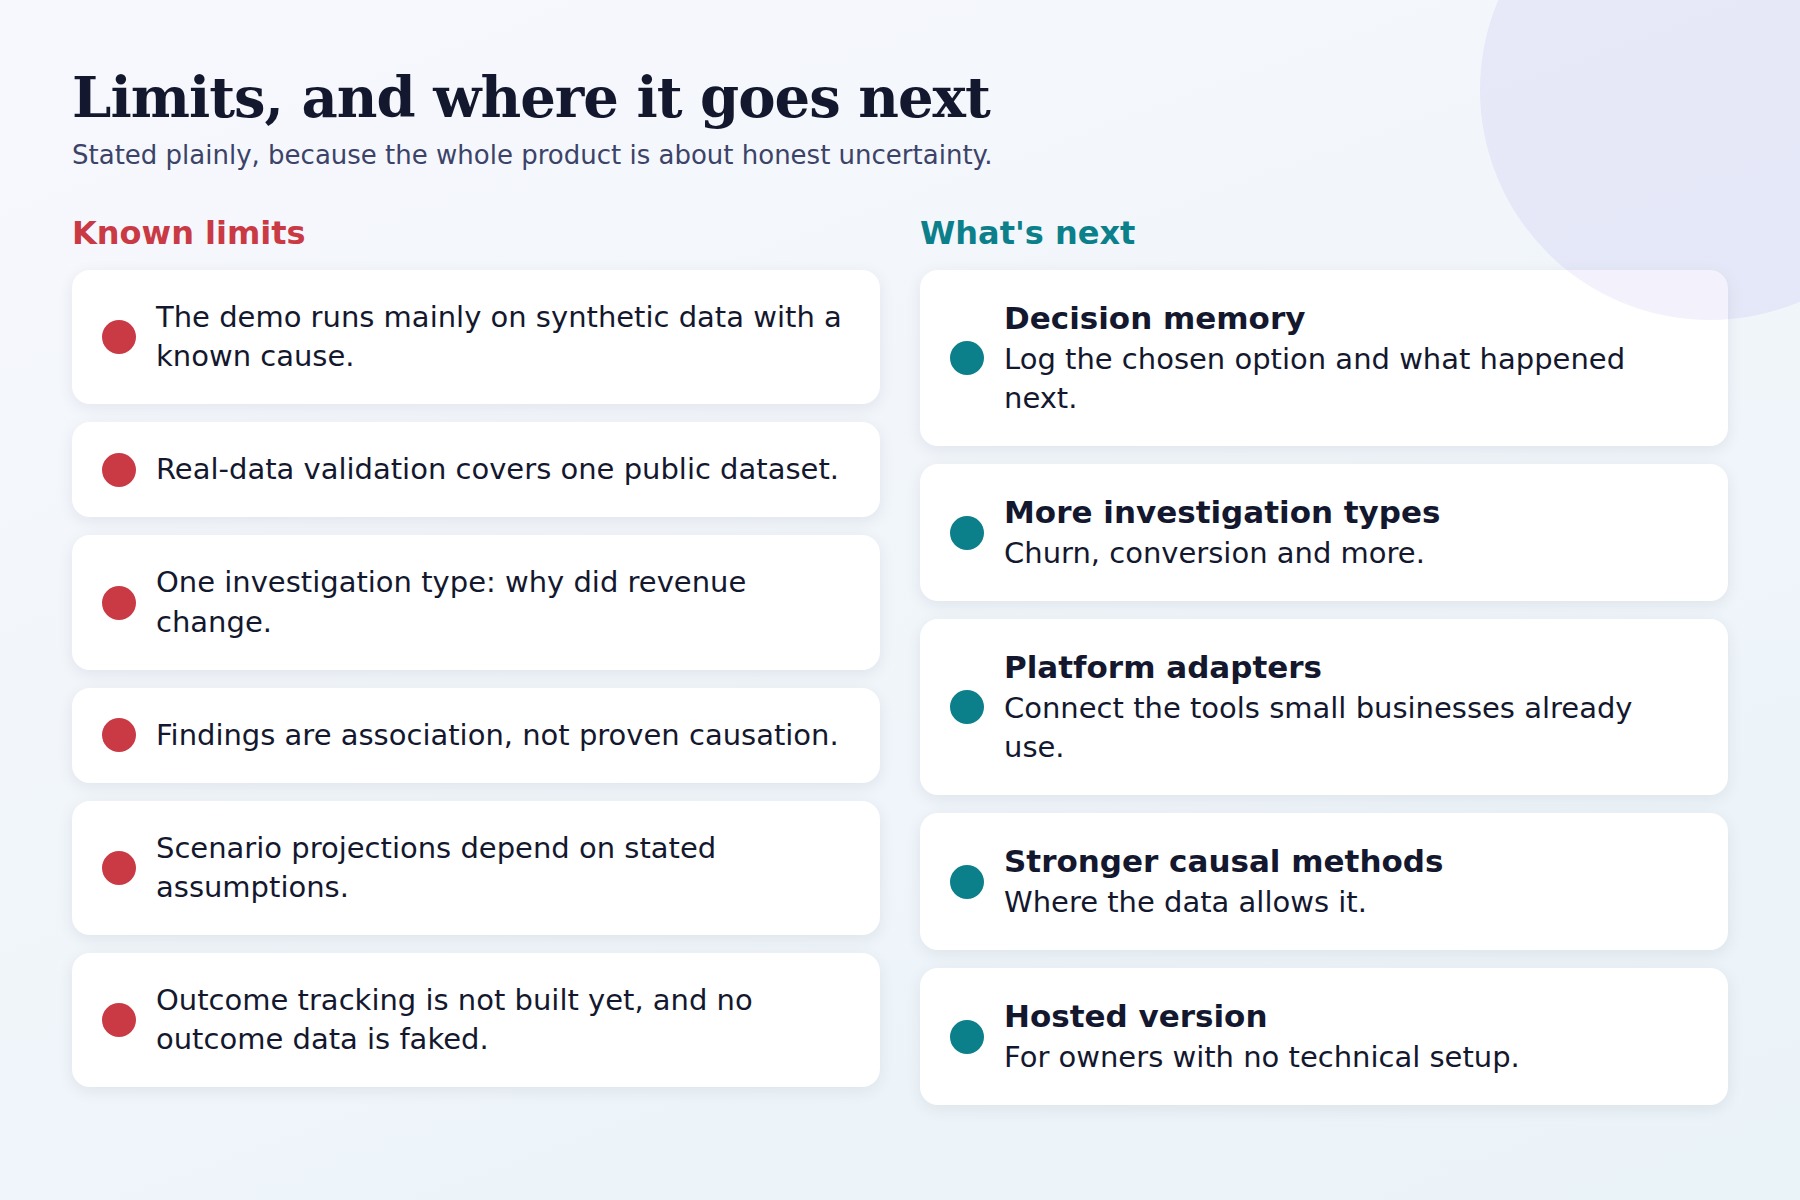
- More investigation types. Right now KyuYaar answers one question well ("why did revenue/orders change?"). The same evidence-first architecture should extend to churn, inventory, and customer-lifetime-value questions.
- Customer-segment evidence in the orchestrator. The data and the significance testing groundwork exist; it isn't exposed to the model yet because I want a proper significance test behind it first, not a shortcut.
- The decision-memory / outcome-tracking loop. This is the idea I'm most excited about long-term: log which option a user chose, and once real outcome data exists, compare projected vs. actual impact — turning KyuYaar from a one-shot investigator into a system that gets calibrated by its own track record. 4. It needs a second time-series of real outcomes that doesn't exist in a hackathon demo, so for now the data structure is built and this is documented as future work rather than faked.
- A richer gross-margin model. Scenario projections currently use product cost only; shipping, returns, fees, and labor aren't modeled, so projected gross profit is an upper bound. Closing that gap would make the projections usable for a real financial decision, not just a directional one.


Log in or sign up for Devpost to join the conversation.