-

Logo
-
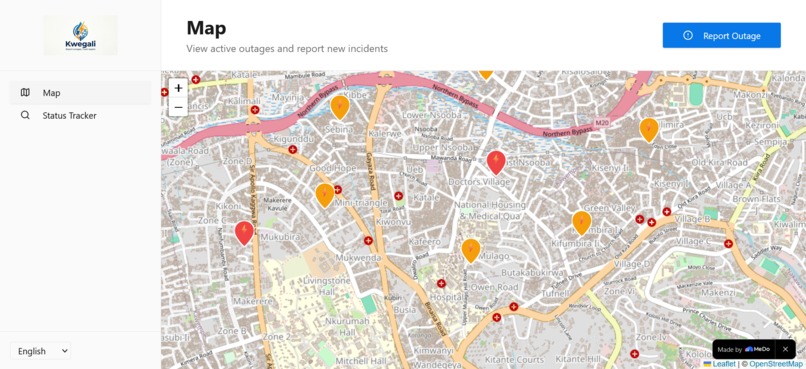
Incidents
-
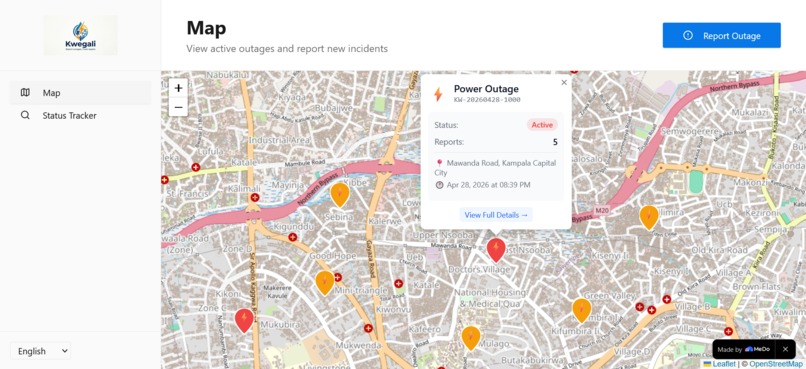
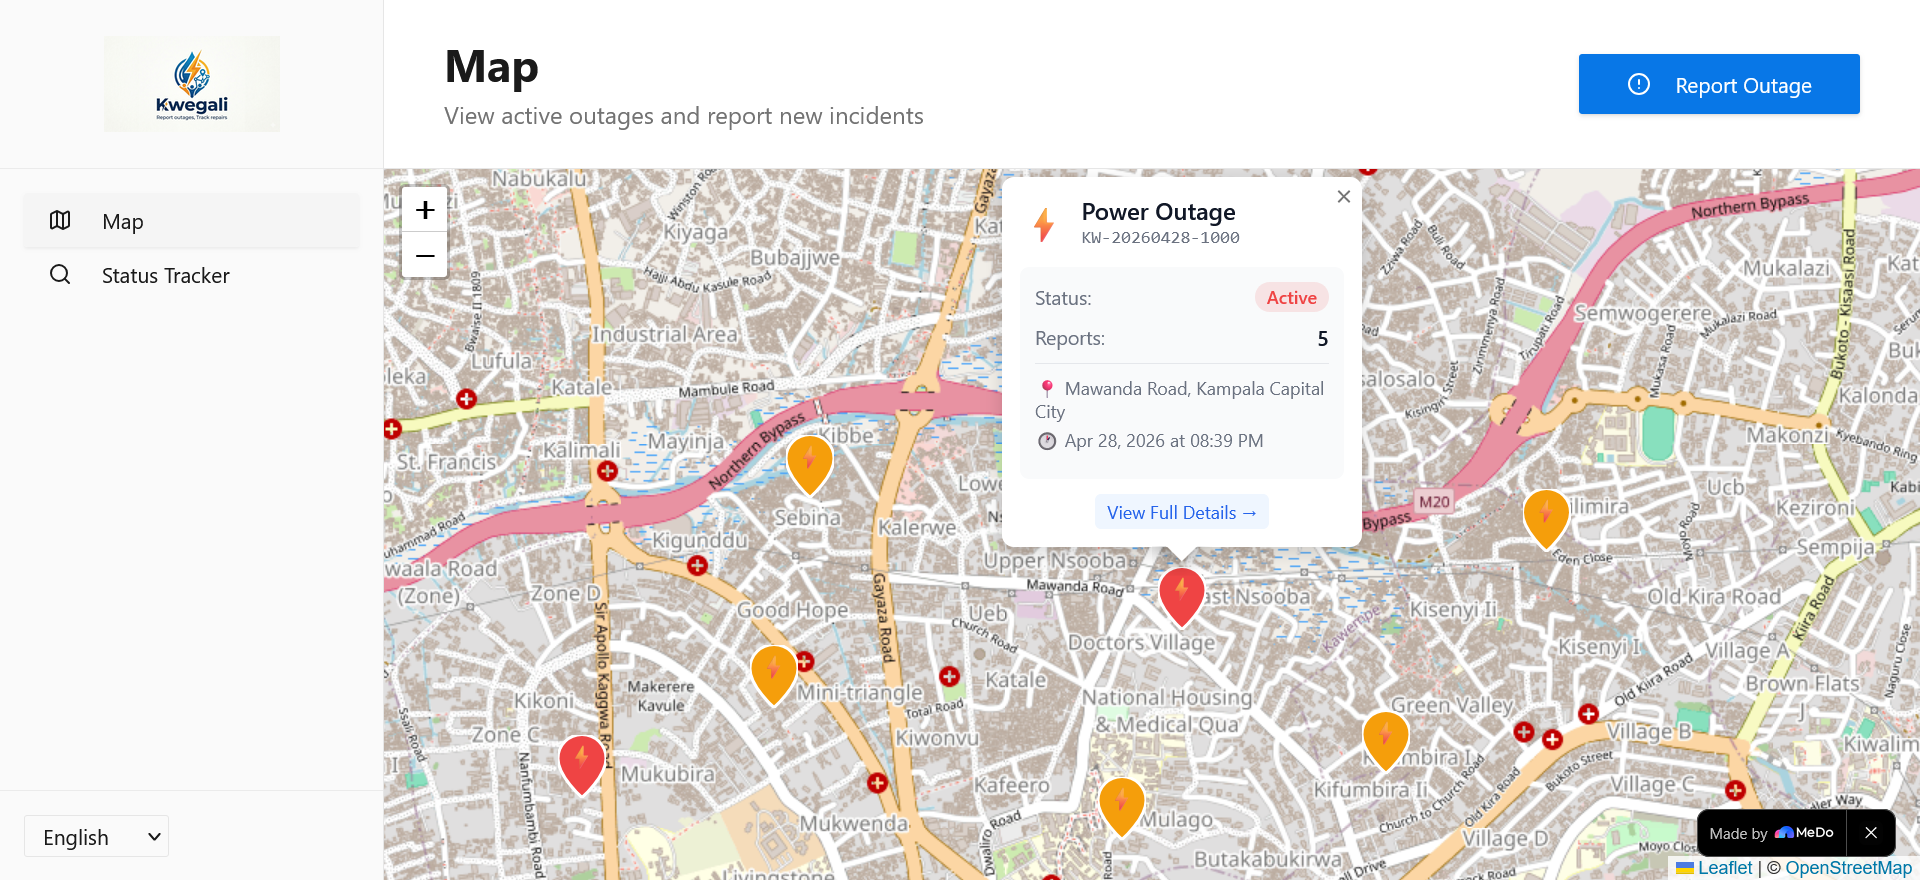
View incident details in a popup
-
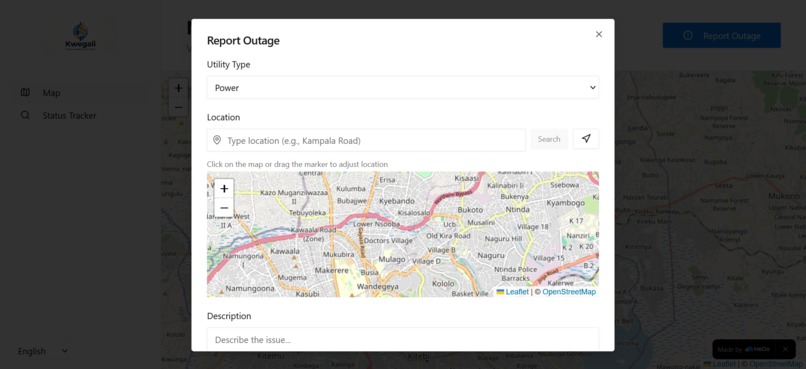
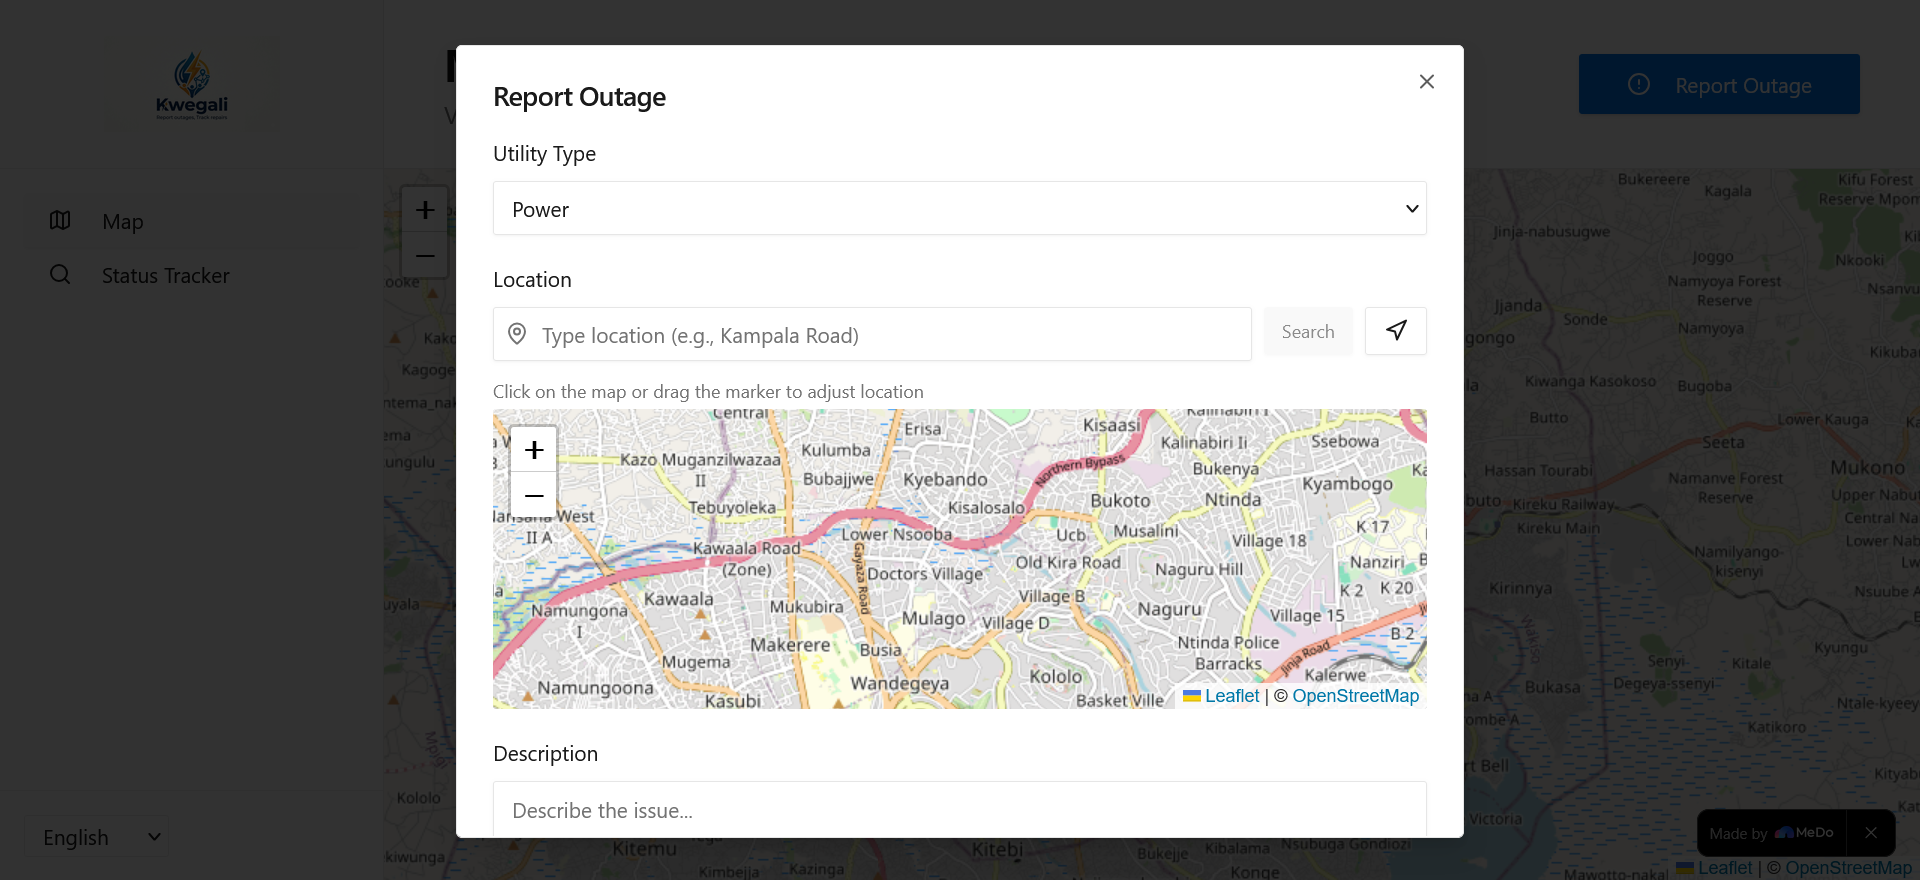
Report incident
-
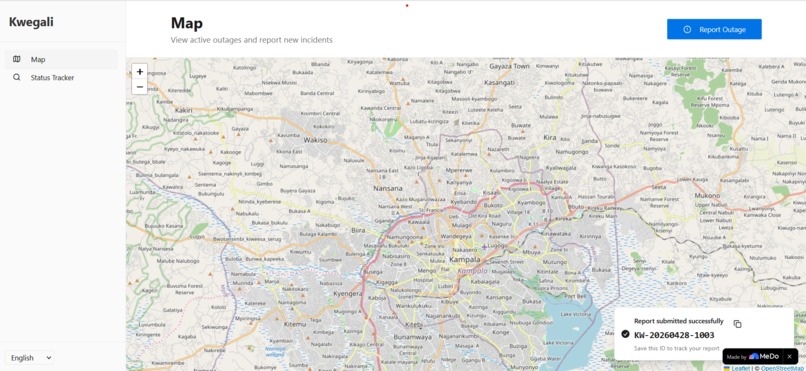
Submit Report. Get incident ID
-
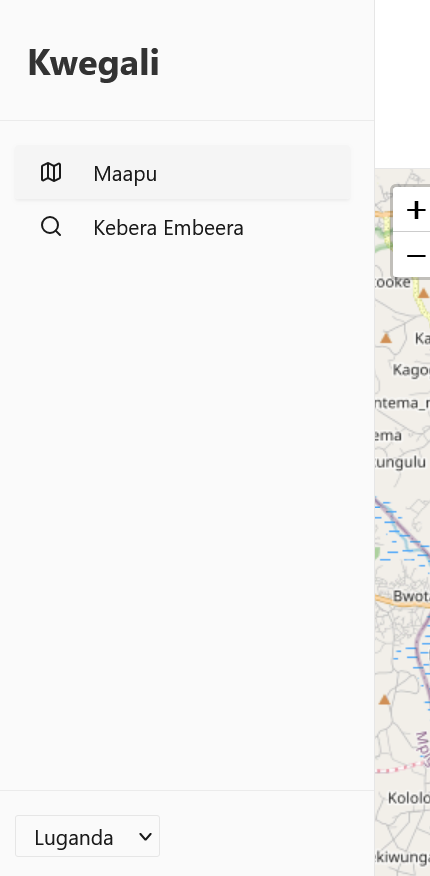
Switch language
-
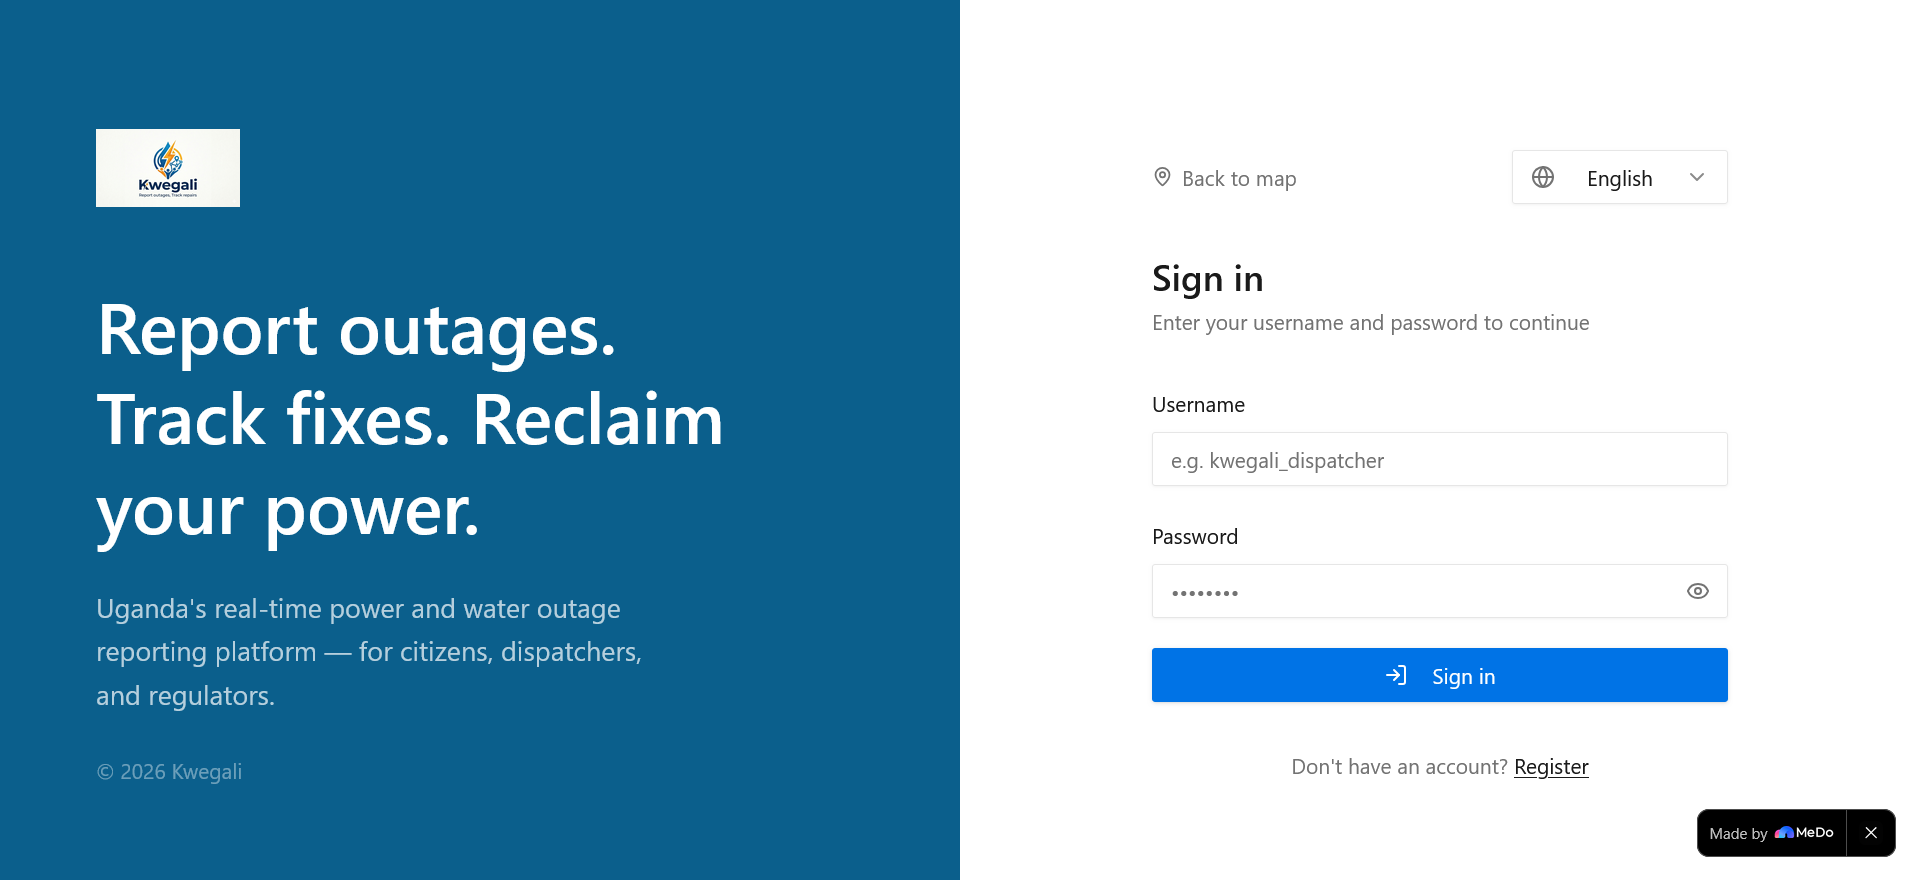
Login Screen
-

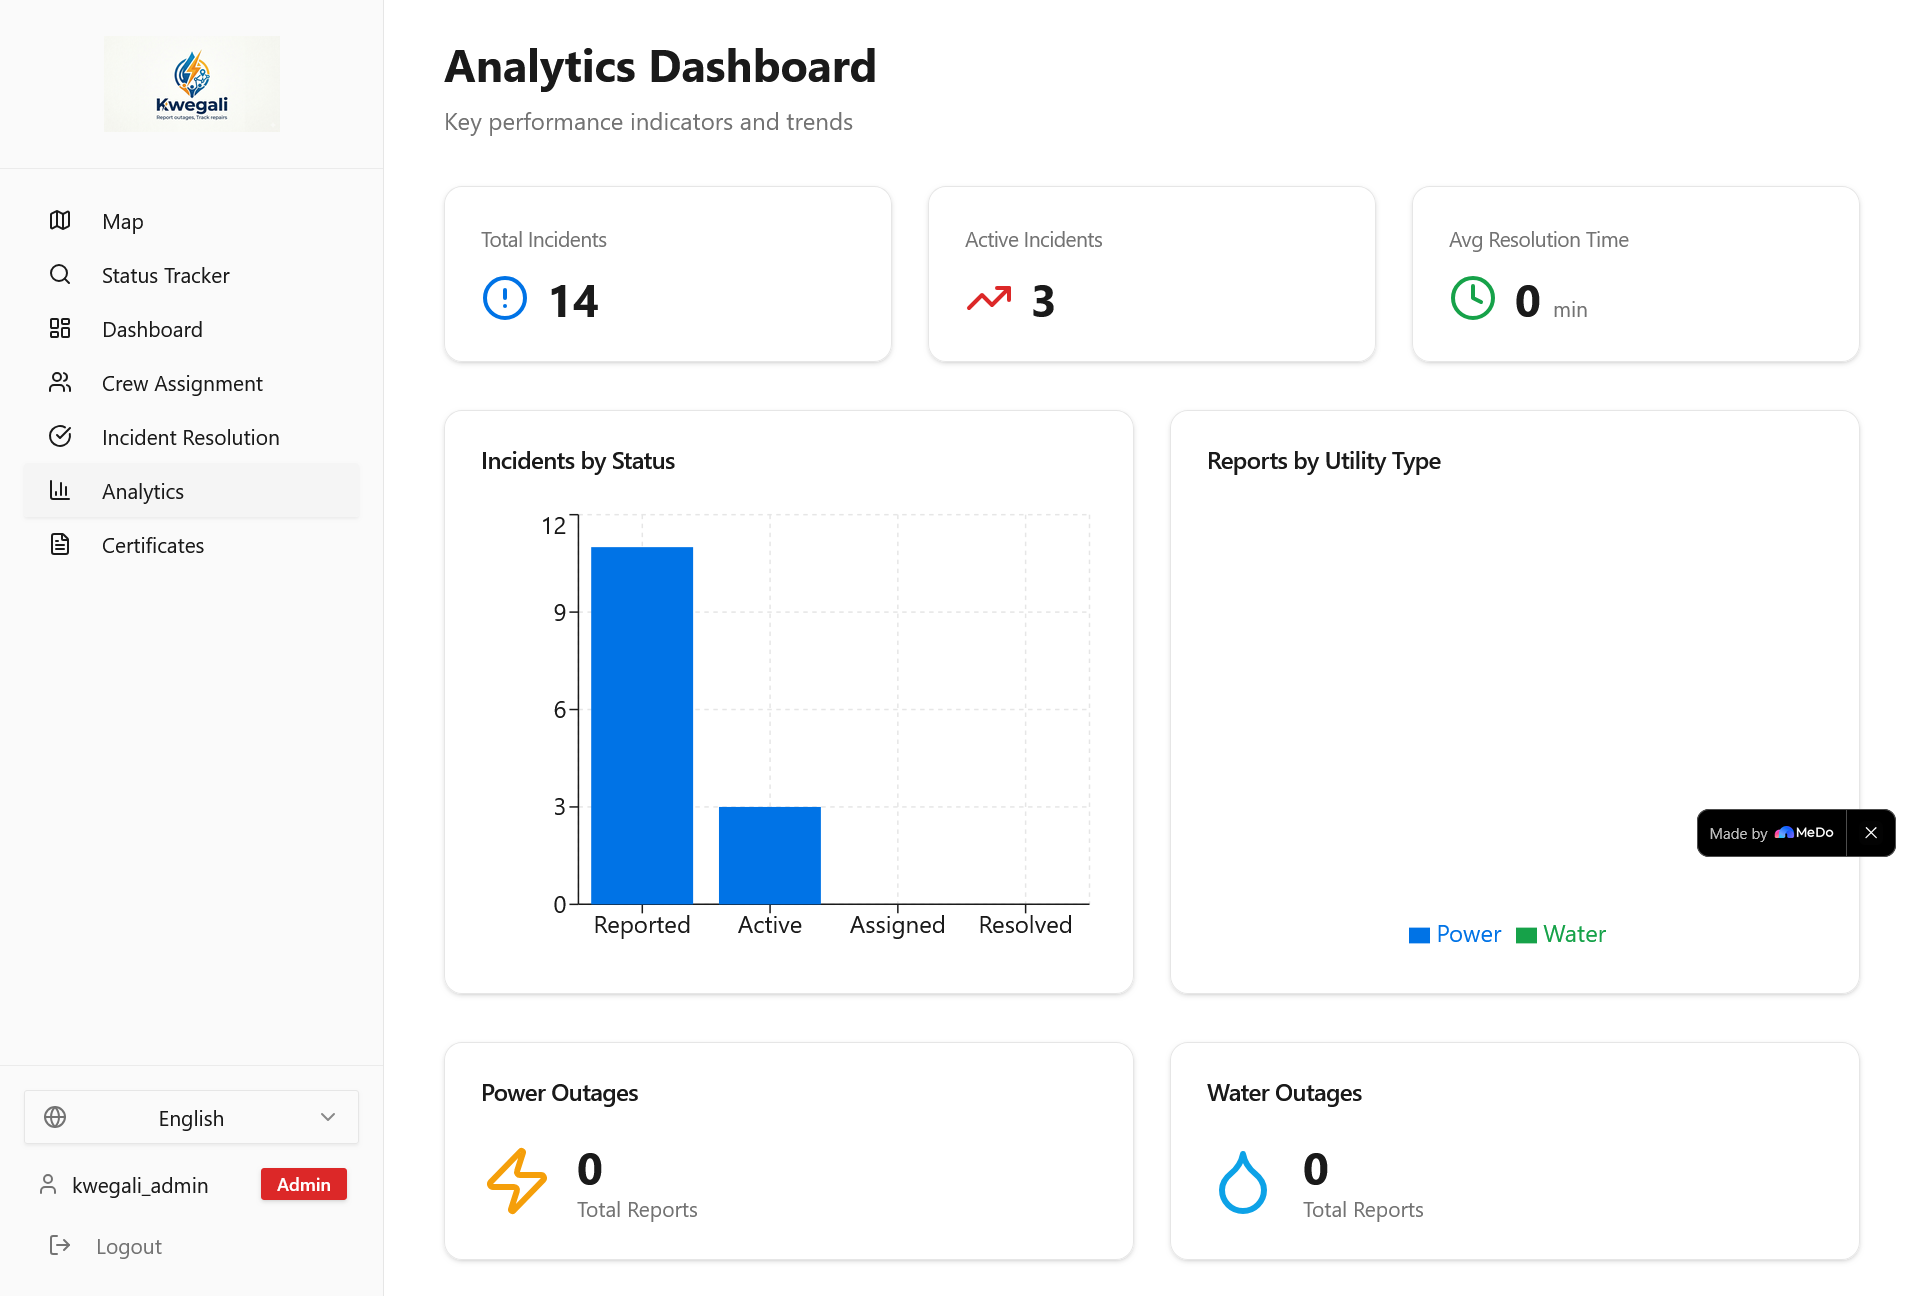
Admin Analytics dashboard
-

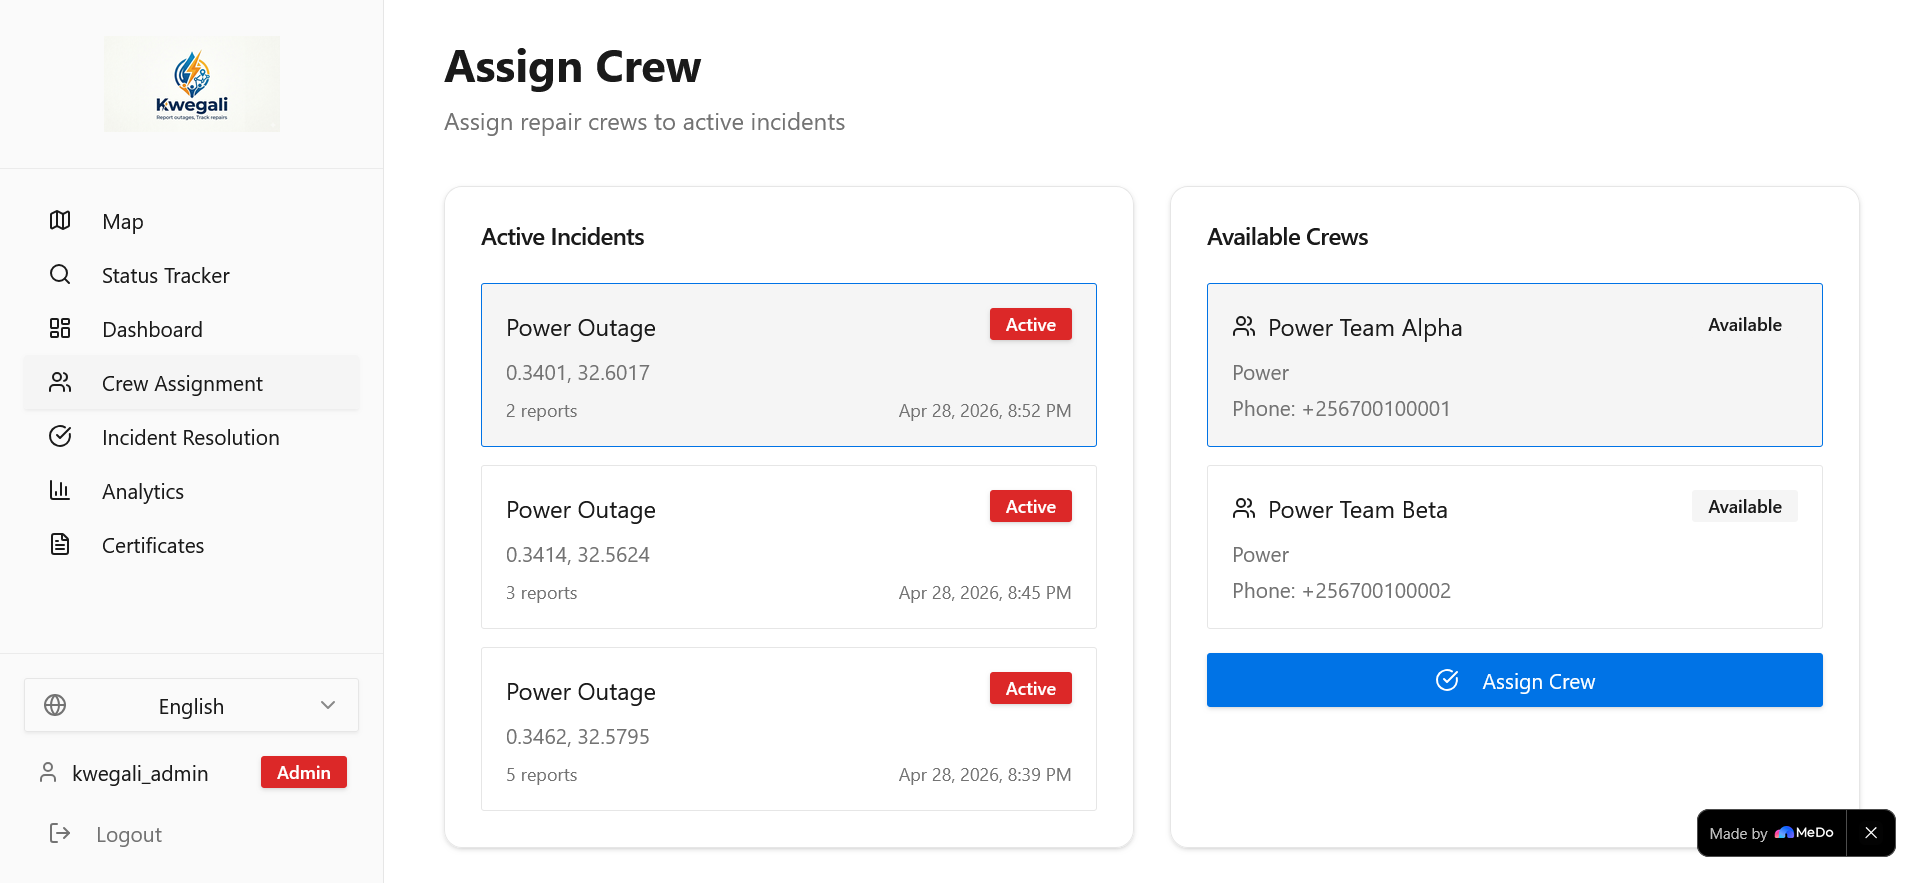
Assign crew
-
Admin dashboard


Kwegali - Utility Outage Reporting & Analytics System
Inspiration
In Uganda, power and water outages are a daily reality affecting millions of citizens, businesses, and essential services. When the lights go out or water stops flowing, people are left in the dark—literally and figuratively—with no way to know if their neighbours are affected, how long the outage will last, or whether anyone is working on the problem.
We were inspired by a small bakery owner in Kampala who lost an entire day's inventory during a 12-hour power outage because she had no way to report the issue or track its resolution. The customer care lines for power were always unreachable at the time. Shortly after, the water also stopped flowing. The gap between utility providers and citizens wasn't just about infrastructure - it was about communication, transparency, and accountability.
Kwegali (meaning "It is on" in Luganda) was born from the vision of bridging that gap: empowering every Ugandan to report outages instantly, track resolution in real-time, and hold utility providers accountable through data-driven insights.
What it does
Kwegali is a full-stack utility outage reporting and analytics platform built for the Ugandan market. It serves three distinct user roles — citizens, dispatchers, and regulators — each with their own interface tailored to their needs.
For Citizens (no login required)
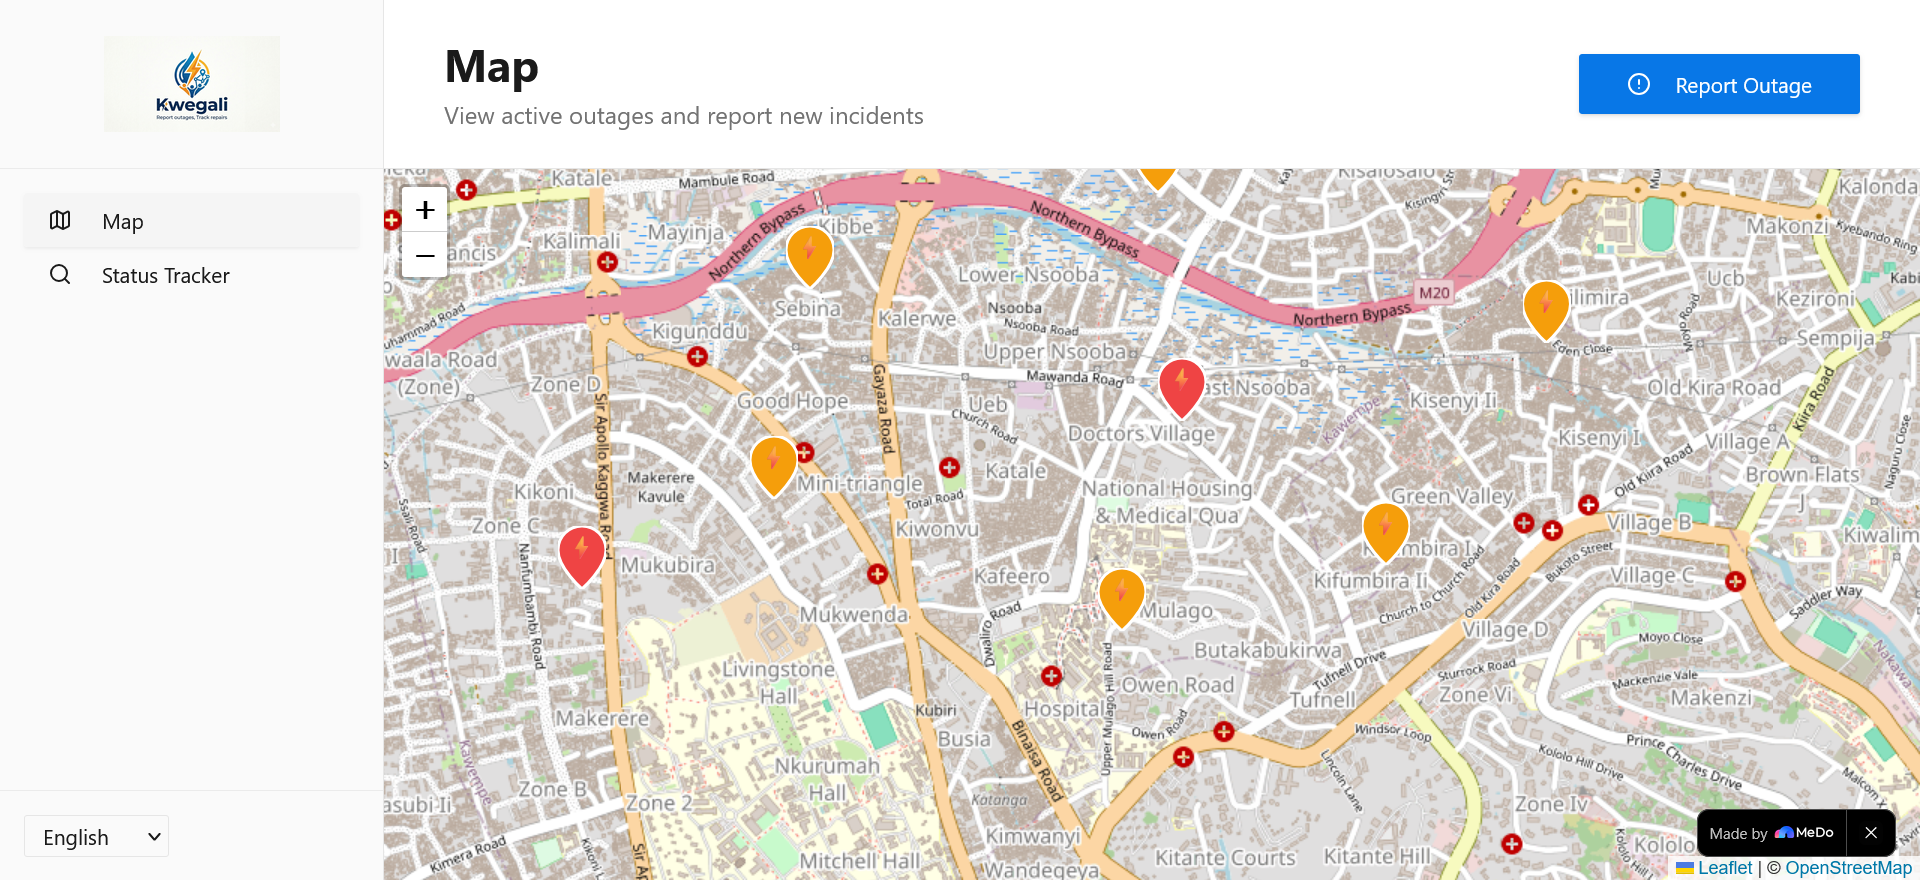
Live Outage Map
- Interactive Leaflet.js map pre-centred on Uganda showing all active incidents
- Color-coded markers: ⚡ amber for power outages, 💧 cyan for water outages
- Marker clustering via
leaflet.markercluster— nearby incidents are grouped into a single badge showing the count, preventing visual clutter at any zoom level - Clicking a cluster zooms in; clicking an individual marker opens a popup with incident ID, status, utility type, and report count
One-Click Outage Reporting
- Click anywhere on the map to drop a location pin
- Select utility type (power or water) and add an optional description
- On submission the backend spatially clusters the report: if an open incident already exists within 500 m of the same utility type, the new report is merged into it rather than creating a duplicate
- A toast notification confirms success and displays the assigned incident ID (e.g.
KW-20260428-0042) with a one-click copy button
Status Tracker
- Enter an incident ID to pull up full details for any report
- Paste from clipboard with one click, or pass the ID in the URL query string (
/status?id=KW-...) for direct linking - Reverse geocoding shows the human-readable address of the incident location
- A horizontal stepper visualises the four-stage lifecycle: Reported → Active → Assigned → Resolved, with colour-coded dots (grey pending, blue current, emerald completed)
- Expandable report cards beneath the stepper show each individual citizen report attached to the incident, including descriptions and timestamps
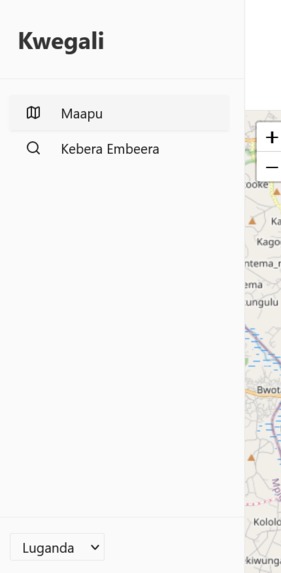
Multi-Language Support
- Full English and Luganda translations covering every UI string
- Language can be switched at any time via the sidebar switcher — the preference persists across sessions
- Fallback: any key missing from a non-English locale automatically resolves to its English value
For Dispatchers (login required)
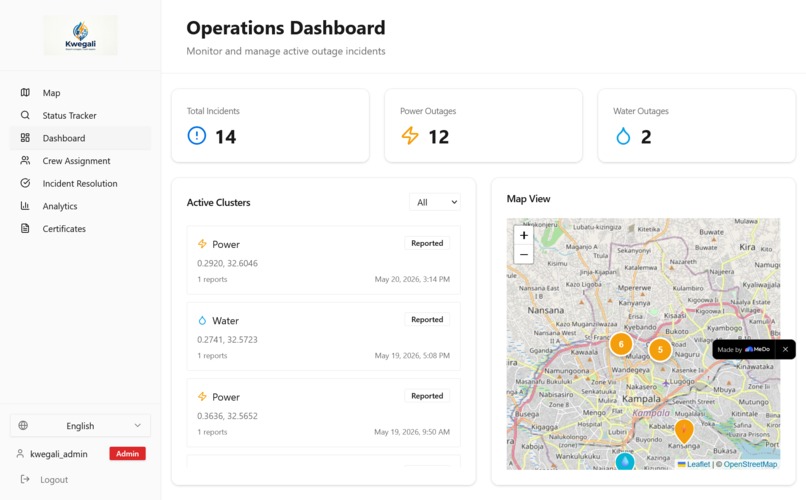
Real-Time Incident Dashboard
- Paginated table of all active incidents with utility type, status badge, location, report count, and creation time
- Filter by utility type (power / water) or status (reported / active / assigned / resolved)
- Summary KPI cards at the top: total active incidents, power outages, water outages
- Click any incident row to expand full details inline
Crew Management
- Full list of repair crews with name, phone, utility specialisation, and current availability
- Side-by-side layout: left panel lists active incidents, right panel shows available crews filtered to the selected incident's utility type
- One-click assignment links a crew to an incident and marks the incident as assigned
- Crews are automatically marked unavailable when assigned; re-availability is set on resolution
- Handles edge cases: shows a clear message when no crews are available for the selected utility type
Incident Resolution
- Filtered view of incidents in assigned status awaiting resolution
- Select an incident to see full details: incident ID, utility type, report count, creation timestamp, location
- Enter resolution notes (required) and confirm — this marks the incident resolved, updates crew availability, and removes it from the active dashboard
- Success / error feedback via toast notifications
For Regulators (login required)
Analytics Dashboard
- KPI summary row: total incidents, resolved count, average resolution time in hours
- Recharts bar chart — incidents by status (reported / active / assigned / resolved)
- Recharts pie chart — incidents by utility type (power vs. water split)
- All chart colours use semantic CSS variable tokens (
--chart-1through--chart-4) so they respect light and dark mode
Outage Certificate Generation
- Search any incident by ID to retrieve full incident details
- Generate an official outage certificate (unique certificate number
CERT-<timestamp>-<incident-id>) stored in theoutage_certificatestable - Certificates list shows all previously issued certificates with date, incident reference, and utility type
- Intended for citizens and businesses to submit to insurers or claim compensation from utility providers
Authentication & Access Control
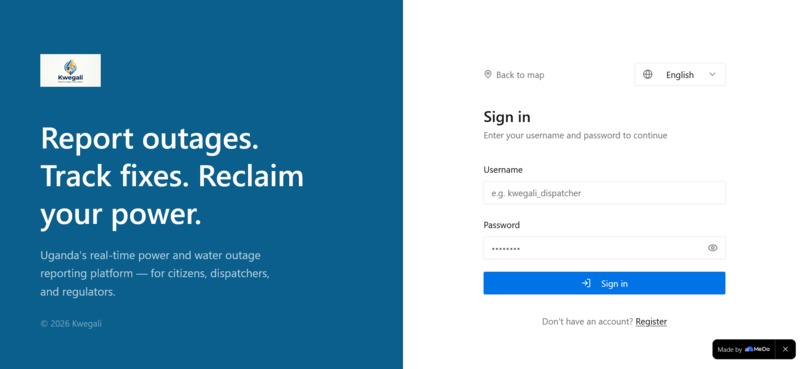
Login Page
- Split-panel layout: branded Kwegali panel (desktop) + credential form
- Username + password sign-in (email verification disabled for accessibility)
- Toggle to a registration form with password confirmation and mandatory User Agreement + Privacy Policy checkbox (Zod-validated)
- Password visibility toggle, loading states, and toast feedback for all outcomes
Role-Based Route Guard
RouteGuardcomponent checks auth state on every navigation- Unauthenticated users attempting to access protected routes are redirected to
/loginwith the original destination preserved (state.from) - Authenticated users are redirected away from
/loginback to their original destination - Sidebar nav items are filtered per role: dispatchers see dashboard / crews / resolution; regulators see analytics / certificates; admins see everything
Admin Role
- Full access to all pages including dispatcher and regulator views
- Role hierarchy: admin > regulator > dispatcher > citizen
Design & UX
- Minimal design system — ample whitespace, 1 px borders, no decorative shadows, semantic colour tokens only
- Responsive layout — desktop sidebar collapses to a hamburger Sheet on mobile; all pages work from 375 px to 1920 px
- Splash screen — branded loading animation on first visit with opacity fade-in
- Dark mode — full light/dark theme support via
next-themesand CSS variable token pairs - Accessible components — shadcn/ui and Radix UI primitives for keyboard nav, ARIA labels, and focus management
- Sonner toasts — non-blocking feedback for every async action, with success/error variants
How we built it
Technology Stack
| Layer | Technology |
|---|---|
| Frontend | React 18, TypeScript, Vite |
| UI | shadcn/ui, Radix UI, Tailwind CSS |
| Maps | Leaflet.js (native), leaflet.markercluster |
| Charts | Recharts |
| Forms | React Hook Form + Zod |
| Backend | Supabase (PostgreSQL + PostGIS) |
| Auth | Supabase Auth + profiles table |
| Routing | React Router v7 |
| Animations | motion/react, tailwindcss-intersect |
Key Architectural Decisions
1. PostGIS for spatial clustering
Used ST_DWithin(location, ST_GeogFromText($1), 500) to find open incidents within 500 m of the same utility type. Matching reports are merged into the existing incident; non-matching reports create a new one. This runs as a Supabase database function invoked on every report submission.
2. Database view for GeoJSON conversion
PostGIS stores geography in binary WKB format. Created the incidents_with_geojson view using ST_AsGeoJSON() to expose location data in a format the Leaflet frontend can consume directly, without any transformation logic in the application layer.
3. SECURITY DEFINER helper functions
RLS policies on users and profiles were causing infinite recursion when checking roles. Created get_user_role(), is_dispatcher(), is_regulator() functions marked SECURITY DEFINER that bypass RLS safely — all policies delegate to these helpers instead of embedding logic directly.
4. Short human-readable incident IDs
PostgreSQL trigger + sequence generates IDs in the format KW-YYYYMMDD-NNNN (e.g. KW-20260428-0042). Citizens can remember and communicate these IDs over phone without reading out a UUID.
5. Native Leaflet over react-leaflet
react-leaflet's Context.Consumer pattern conflicted with React 18's rendering engine. Rewrote all map components using the native Leaflet API with refs for lifecycle management, eliminating the dependency entirely.
6. LanguageProvider wraps AuthProvider
Placing LanguageProvider as the outer provider ensures the language context is mounted and stable before AuthProvider begins its async session check — preventing the useLanguage must be used within LanguageProvider error during auth initialisation.
MeDo AI-Powered Development
We built Kwegali entirely through MeDo, using natural language prompts to generate, iterate, and debug every layer of the stack:
- Described the project vision → MeDo scaffolded the full project structure, routing, auth, and database schema
- Requested features conversationally ("add clustering to map markers", "create a regulator analytics page") → MeDo generated complete, type-safe components
- Reported bugs ("all locations show as Unknown") → MeDo diagnosed the PostGIS binary format issue and created the GeoJSON view
- Requested i18n → MeDo wired all 87 files to a single
translations.tswith zero lint errors
Challenges we ran into
PostGIS binary vs. GeoJSON — The frontend received WKB binary strings instead of coordinates. Solved by creating a database view with ST_AsGeoJSON().
RLS infinite recursion — Role-checking policies on the users table queried the same table, creating a loop. Solved with SECURITY DEFINER helper functions.
React 18 + react-leaflet — TypeError: render$1 is not a function caused by Context.Consumer incompatibility. Solved by switching to native Leaflet.js with refs.
Marker clustering performance — Hundreds of markers at country zoom caused rendering lag. Solved with leaflet.markercluster and custom cluster icons colour-coded by dominant utility type.
LanguageProvider race condition — useLanguage fired before the context mounted during auth initialisation. Solved by hoisting LanguageProvider above AuthProvider in the component tree.
Accomplishments we're proud of
- Production code quality — 88 TypeScript files, zero lint errors, strict mode throughout
- Spatial intelligence — 500 m PostGIS clustering prevents duplicate incidents without any frontend logic
- Complete RBAC — four roles, three layers of enforcement (DB, server function, client guard)
- Real accessibility — full Luganda translation, keyboard navigation, mobile-first responsive layout
- Minimal but complete UI — every screen is functional and uncluttered, designed for users with limited technical literacy
What we learned
- PostGIS
ST_DWithinis one of the most powerful tools for location-based deduplication SECURITY DEFINERfunctions are the correct pattern for breaking RLS recursion without disabling security- Provider ordering in React matters for context availability during async initialisation
- Short, memorable IDs dramatically improve usability for verbal communication (phone support)
- Wrapping UI strings in a single translation file from the start costs almost nothing and enables full localisation later
What's next for Kwegali
Near term
- SMS and USSD reporting for feature phone users
- Supabase Realtime subscriptions for live map and dashboard updates without polling
- Push notifications when a reported incident changes status
- Service worker offline support for intermittent connectivity
Medium term
- Native iOS and Android apps
- Utility provider portal for infrastructure management and customer communication
- Photo uploads attached to incident reports
- Predictive analytics using historical outage patterns
Long term
- Expansion to Kenya, Tanzania, Rwanda
- Multi-utility support (internet, gas, telecommunications)
- Official adoption partnership with Uganda's Ministry of Energy and National Water and Sewerage Corporation
Built With
React · TypeScript · Vite · Supabase · PostgreSQL · PostGIS · Leaflet.js · leaflet.markercluster · Tailwind CSS · shadcn/ui · Radix UI · React Hook Form · Zod · Recharts · React Router · motion/react · next-themes · Sonner
Try It Out
Live Demo: https://app-b9zyx8216sqp-vitesandbox.sandbox.medo.dev
Test Accounts — no email verification required, log in immediately:
| Username | Password | Role |
|---|---|---|
kwegali_dispatcher |
Kw3g@liD1sp@tch!24 |
Dispatcher |
kwegali_regulator |
R3gul@t0rKw3g#2024 |
Regulator |
kwegali_admin |
Adm1n$Kw3g@l1!2024 |
Admin |
Citizens can report outages and track incidents on the map without logging in.
Kwegali — Report outages. Track Repairs.
Built With
- leaflet-marker-cluster
- leaflet.js
- medo
- postgis
- postgresql
- react
- react-hook-form
- shadcn/ui
- superbase
- tailwind-css
- typescript
- vite


Log in or sign up for Devpost to join the conversation.