-
Kurnicus live product demonstration
-
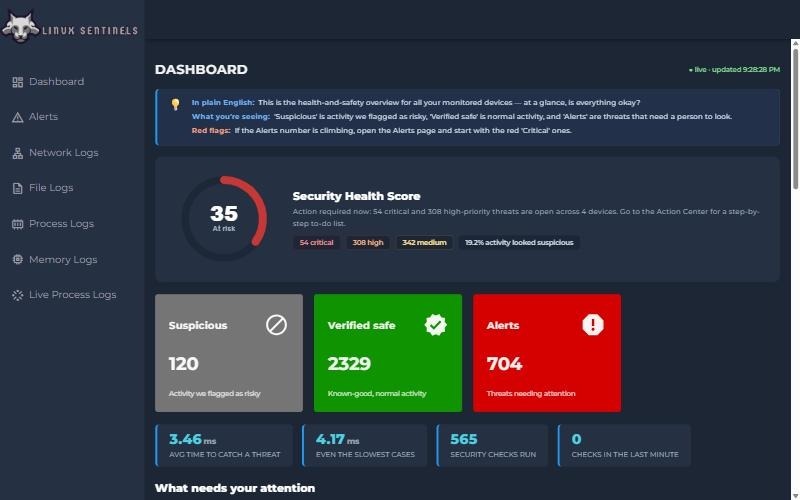
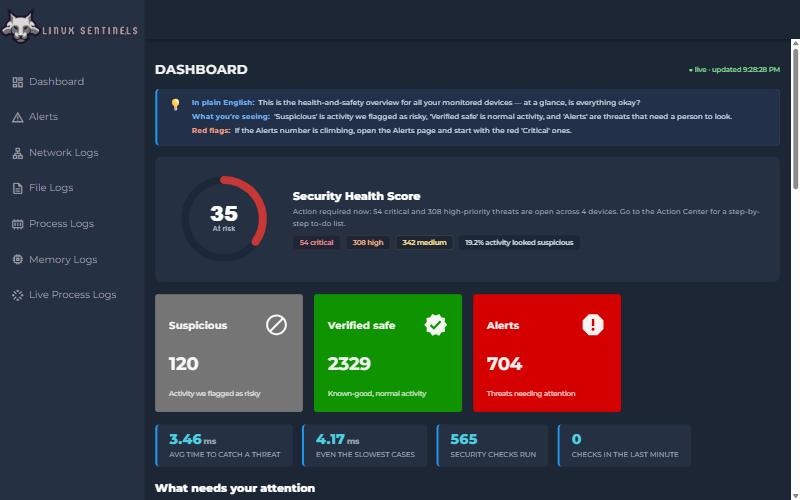
Fleet dashboard showing the security score, prioritized alerts, and detection speed
-
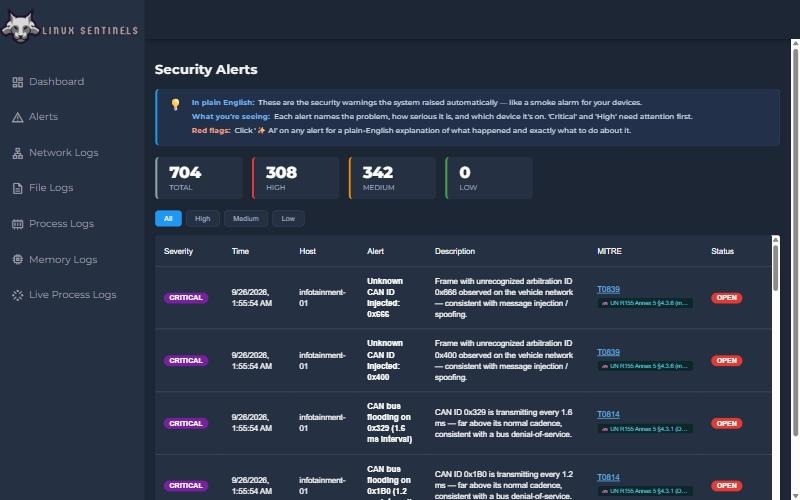
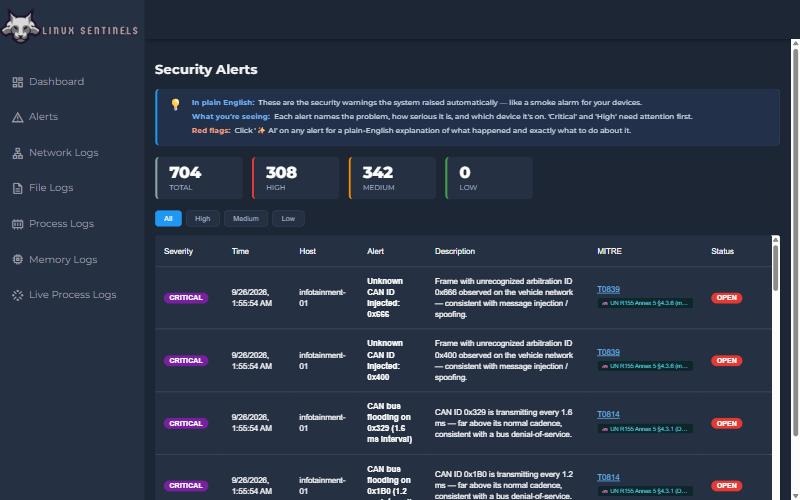
Critical CAN alerts identifying simulated message injection and bus flooding
-
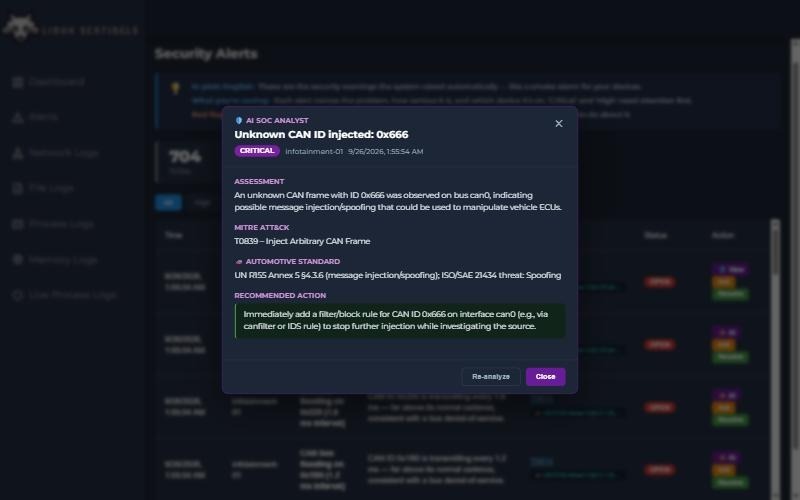
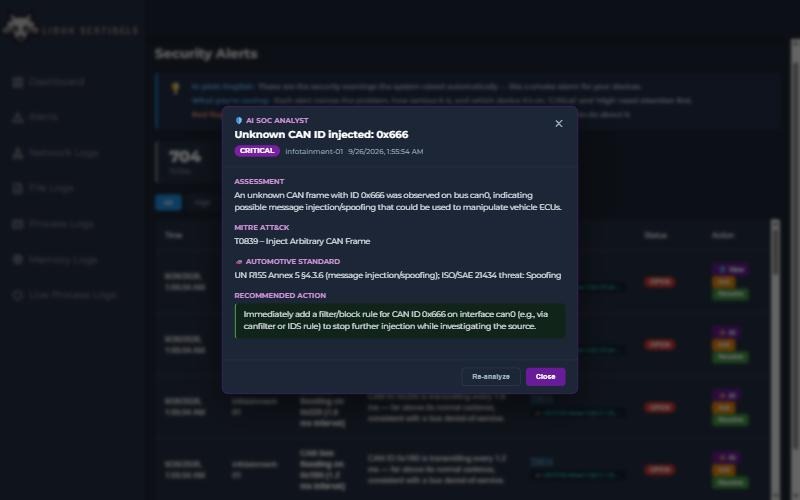
AI analyst explaining the threat, MITRE ATT&CK mapping, and recommended response
-
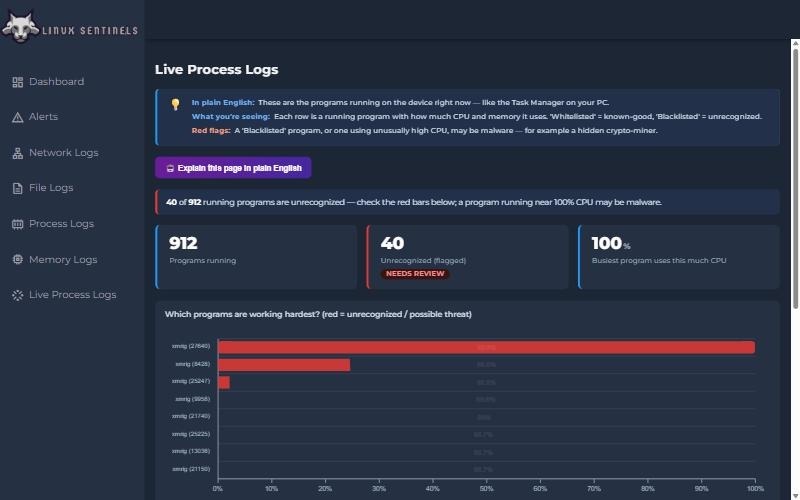
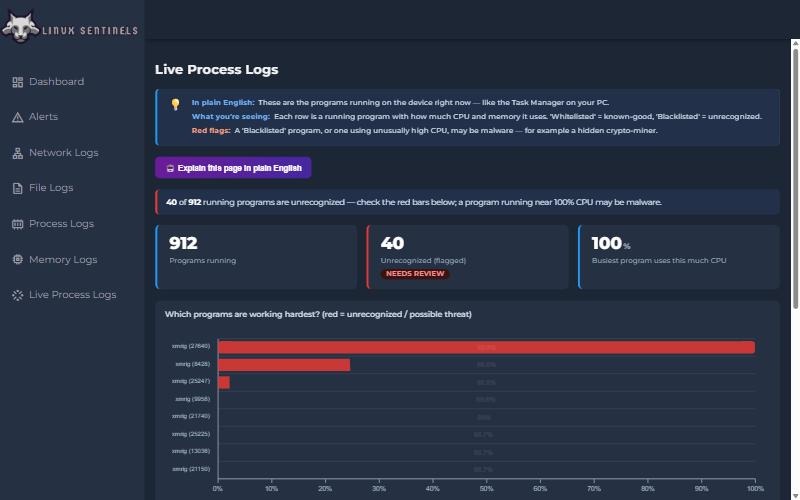
Real time process monitoring highlighting unrecognized programs and abnormal CPU usage
-
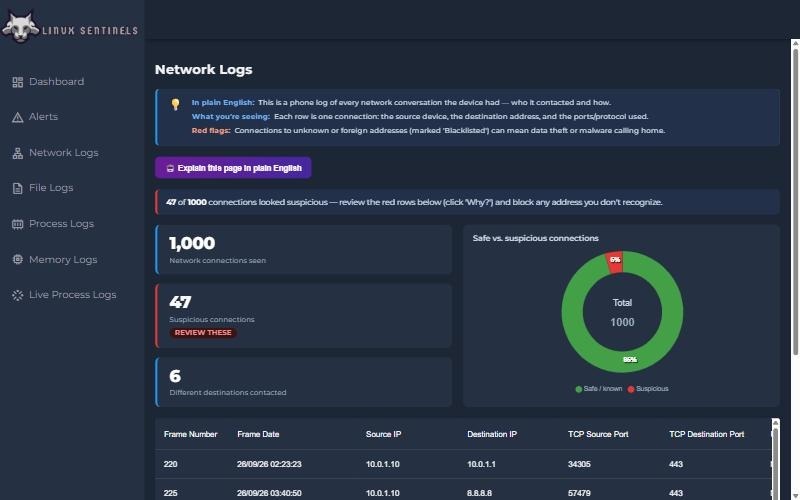
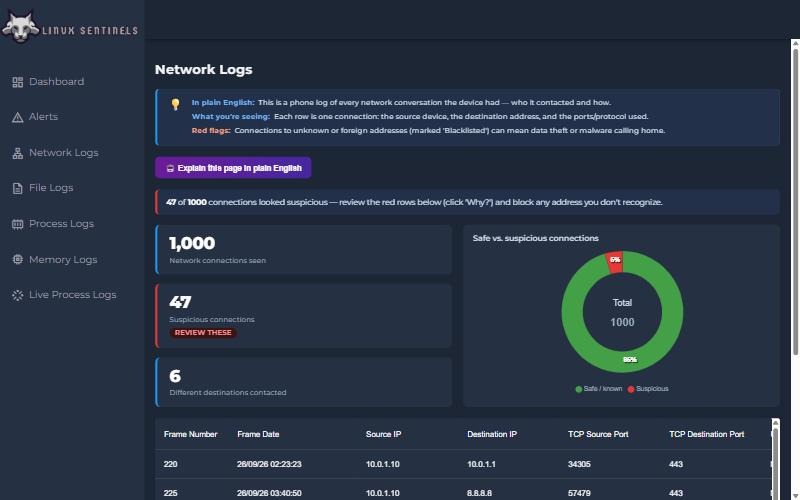
Network monitoring identifying suspicious connections and destinations
-
Demo Output
Inspiration
Linux powers far more than laptops and servers. It runs inside IoT devices, industrial equipment, medical systems, and many automotive computing platforms. These devices are increasingly connected, but the security tools used for conventional computers can be too resource intensive, too dependent on cloud connectivity, or too difficult for small teams to interpret.
We built Kurnicus to answer a simple question: Can a constrained device detect unusual behavior immediately and explain the risk clearly to the person responsible for it?
What Kurnicus Does
Kurnicus is a real time behavioral security platform for Linux, IoT, and automotive systems. It learns the normal behavior of each device and data source, then identifies unusual activity as events occur.
The platform monitors:
- Running processes and CPU behavior
- Network connections and suspicious destinations
- Sensitive file access and modification
- Memory activity
- Login attempts
- Automotive CAN message injection and flooding
Instead of showing only raw logs, Kurnicus provides a Security Health Score, prioritized alerts, supporting evidence, and clear explanations of what requires attention.
An optional AI security analyst, powered by NVIDIA NIM, converts an alert into four practical sections:
- Assessment of what happened
- Related MITRE ATT&CK technique
- Relevant automotive security mapping
- Recommended response
The machine learning detection system works independently of the AI explanation service, so the core security function does not require a graphics processor or a continuous cloud connection.
How We Built It
Kurnicus uses online machine learning to build a separate behavioral baseline for every device and telemetry source. River Half Space Trees and scikit learn Isolation Forest models analyze incoming events and assign anomaly scores without depending on manually written attack signatures.
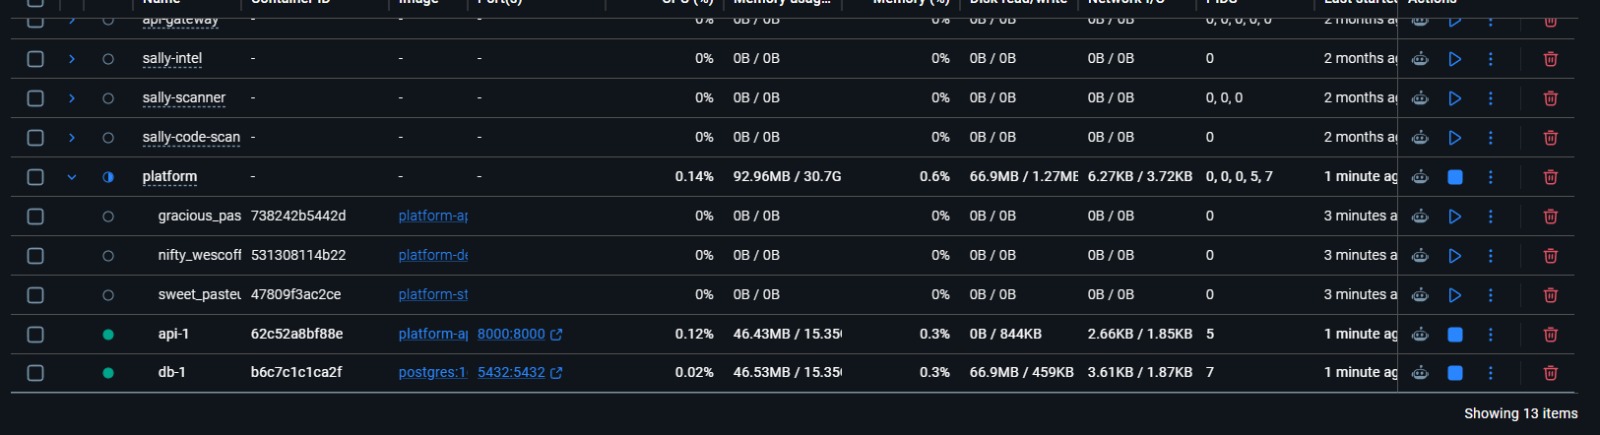
The backend is built with FastAPI, asyncpg, PostgreSQL 16, JSONB, and Uvicorn. PostgreSQL LISTEN and NOTIFY support live dashboard updates. The frontend uses React 18, Vite, Material UI, and ApexCharts.
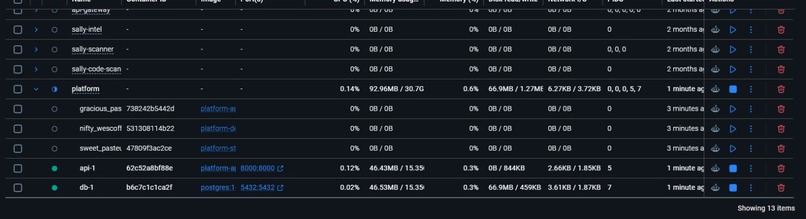
We used Docker Compose to package the application so the full platform can be launched locally with one command:
docker compose up
The broader telemetry pipeline uses Linux tools including tshark, sysstat, iotop, and ioping, with AWS S3 and EC2 available for storage and ingestion.
Key Features
- Real time anomaly detection on the device CPU
- Separate behavioral baselines for each device and data source
- Monitoring across processes, networks, files, memory, logins, and CAN traffic
- Security Health Score with prioritized actions
- Plain language explanations for technical security events
- MITRE ATT&CK mapping for detected behavior
- Automotive mappings related to UN Regulation 155 and ISO/SAE 21434
- Live dashboard for fleet health and investigation
- Repeatable deployment through Docker Compose
Testing and Results
In our controlled prototype tests, Kurnicus detected:
- 20 of 20 simulated crypto miner processes
- 39 command and control connections
- Brute force login attempts
- Sensitive file access
- Simulated automotive CAN injection
- Simulated CAN bus flooding
The dashboard test run shown in our submission recorded an average detection time of approximately 3.46 milliseconds, with the slowest displayed event at approximately 4.17 milliseconds.
These results come from a controlled prototype environment. Production deployment, especially in automotive or medical systems, would require additional hardware benchmarking, security review, privacy controls, and validation.
Challenges We Faced
One major challenge was distinguishing unusual but legitimate behavior from events that deserved investigation. A single global threshold created unnecessary noise, so we designed separate baselines for different devices and data sources.
We also had to combine several types of security telemetry without overwhelming the user. This led us to build the Security Health Score, Action Center, and plain language explanations.
A third challenge was combining fast local detection with more detailed AI explanations. We solved this by keeping the language model optional. Detection continues to work even when the external explanation service is unavailable.
Accomplishments We Are Proud Of
We built an end to end prototype that combines telemetry collection, machine learning, storage, API services, live updates, visual investigation, and AI assisted explanations.
We are especially proud that one configurable platform can analyze conventional Linux activity and automotive CAN traffic while presenting the results in language that nonexperts can understand.
What We Learned
We learned that finding an anomaly is only the beginning. A useful security product must also show why the event is unusual, provide the supporting evidence, and help the user decide what to do next.
We also learned that edge detection and cloud assisted intelligence can work together when the essential security function remains local and independent.
What Is Next
Our next steps are to:
- Benchmark CPU, memory, storage, and network use on Raspberry Pi and representative embedded Linux hardware
- Measure precision, recall, false alerts, and detection delay using a documented evaluation dataset
- Add secure device identity, signed updates, event integrity protection, role based access, and retention controls
- Run a design partner evaluation in an authorized automotive test or validation environment
- Add integrations with existing security and ticketing platforms
Our goal is to make understandable behavioral security available wherever Linux runs, including devices that cannot support conventional enterprise security agents.
Built With
- amazon-web-services
- apexcharts
- asyncpg
- automotive
- can
- cybersecurity
- docker
- dockercompose
- fastapi
- iot
- linux
- machine-learning
- materialui
- mitreattack
- nemotron
- nim
- numpy
- nvedia
- postgresql
- python
- react
- river
- scikit-learn
- unicorn
- vite

Log in or sign up for Devpost to join the conversation.