-
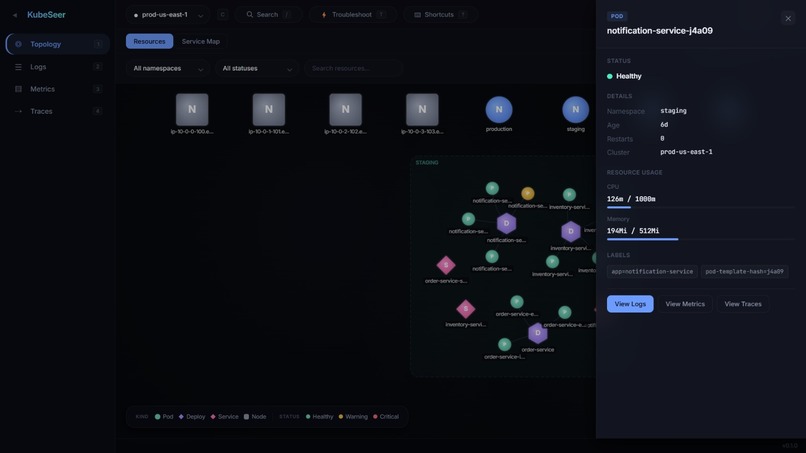
Topology View
-
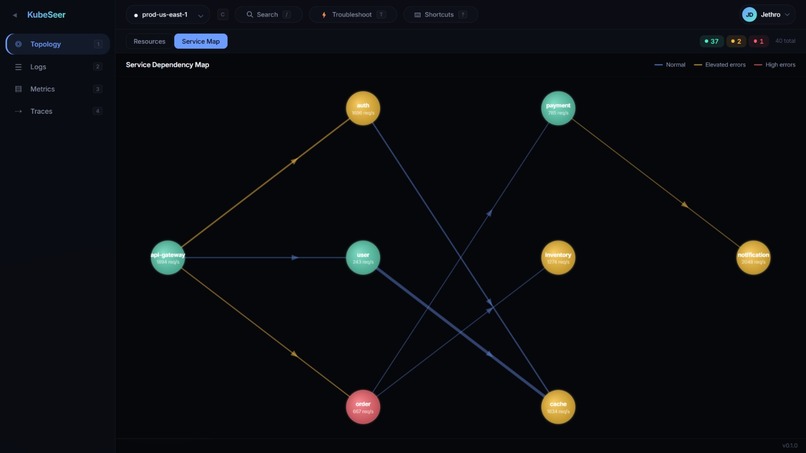
Service Dependency Map
-
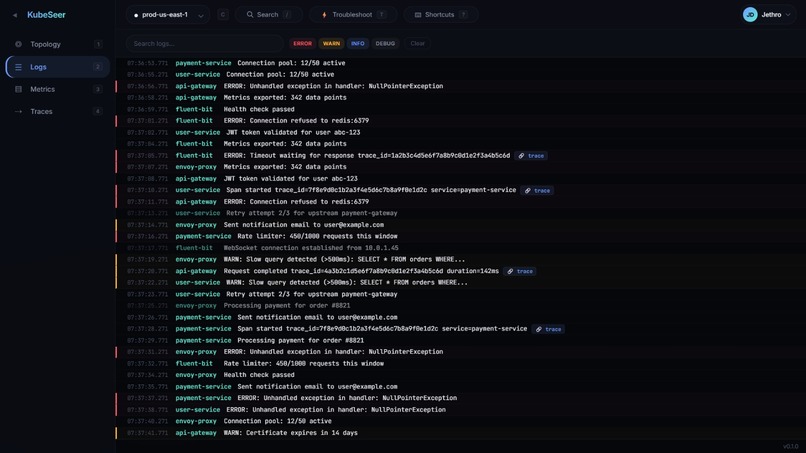
Logs View
-
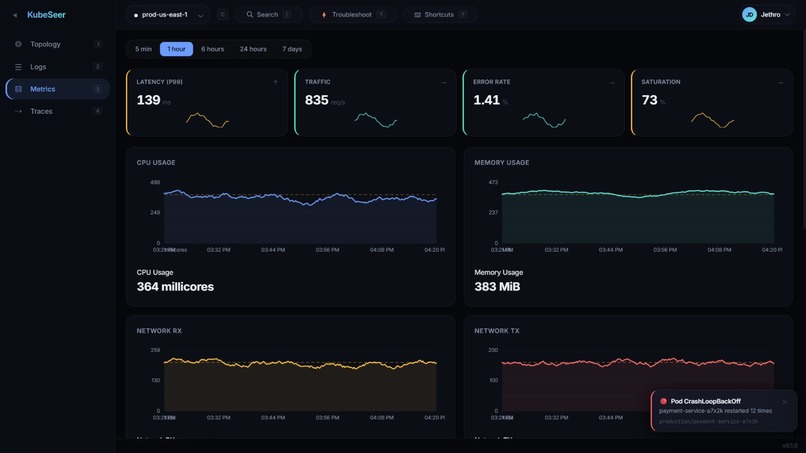
Metrics View
-
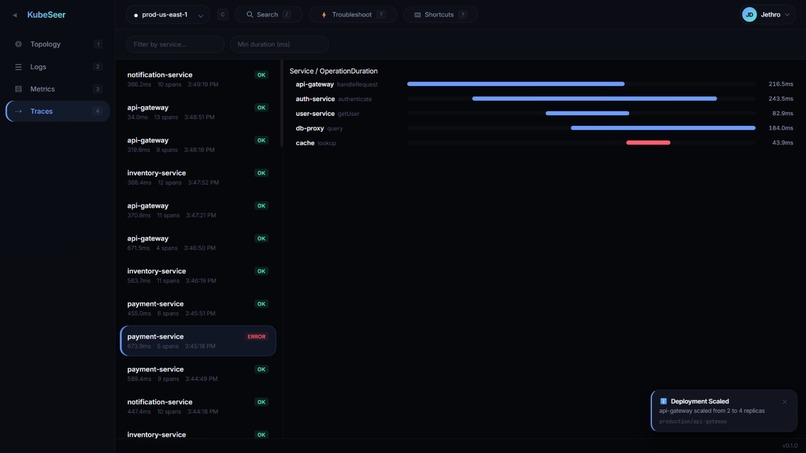
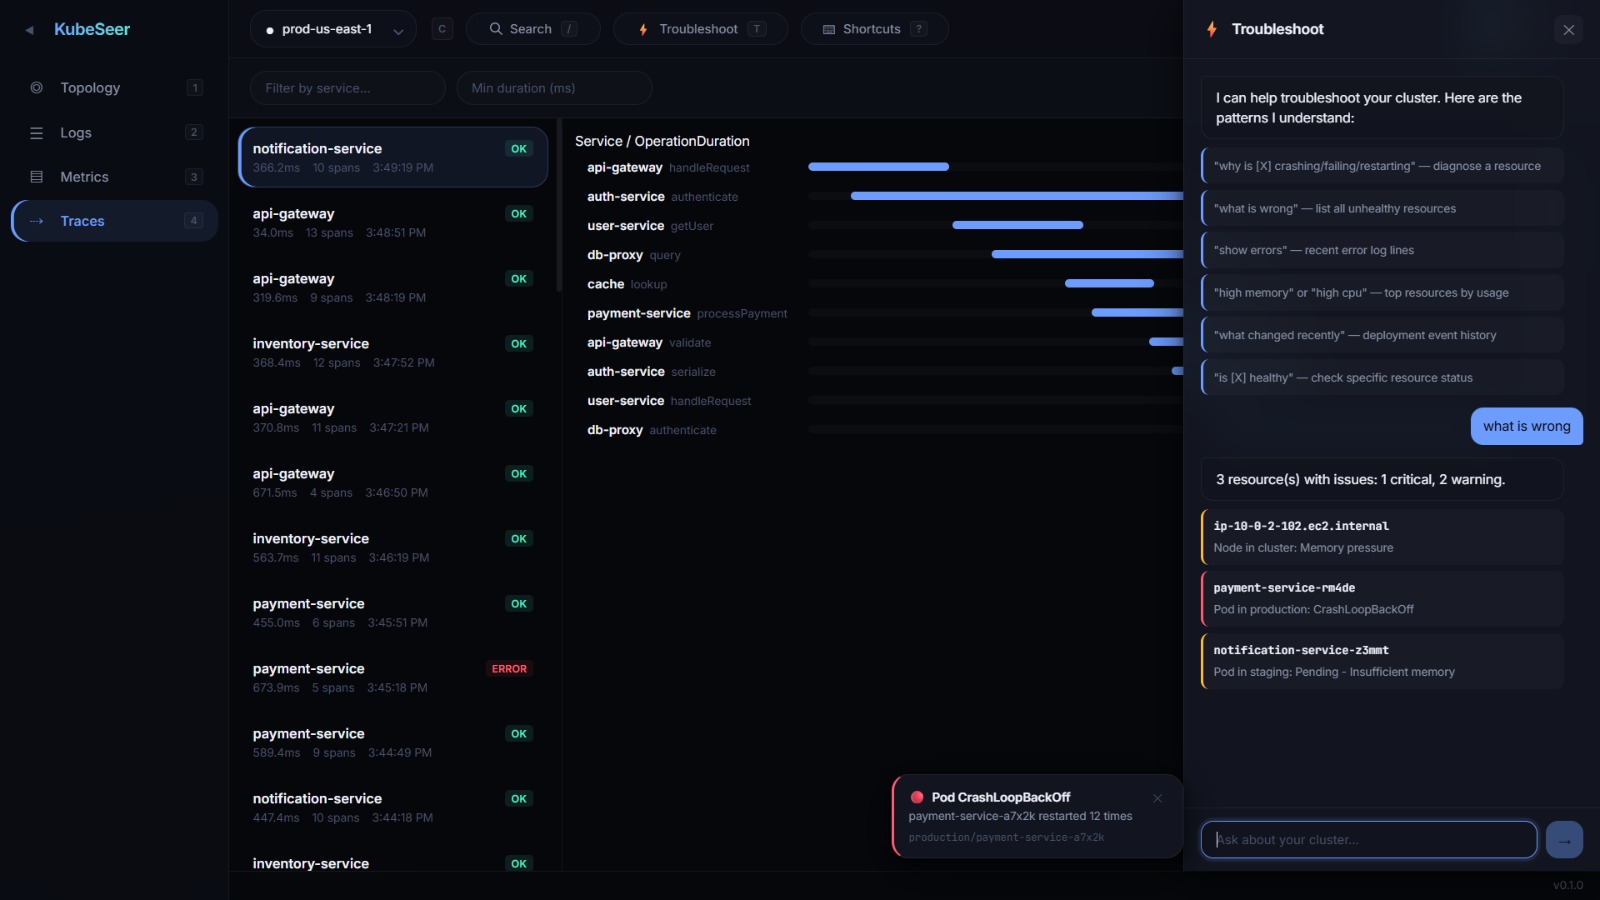
Traces View
-
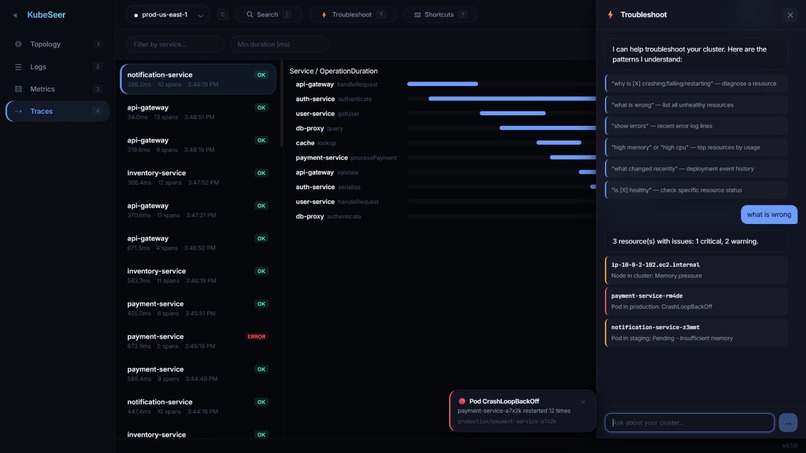
Troubleshooting Assistant
-
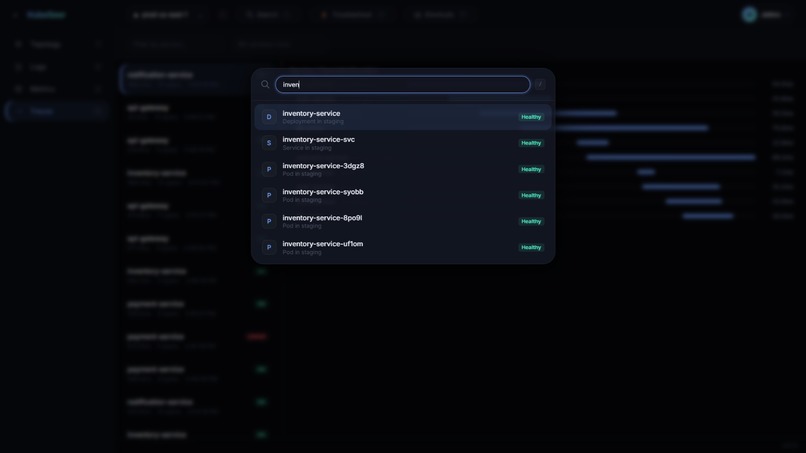
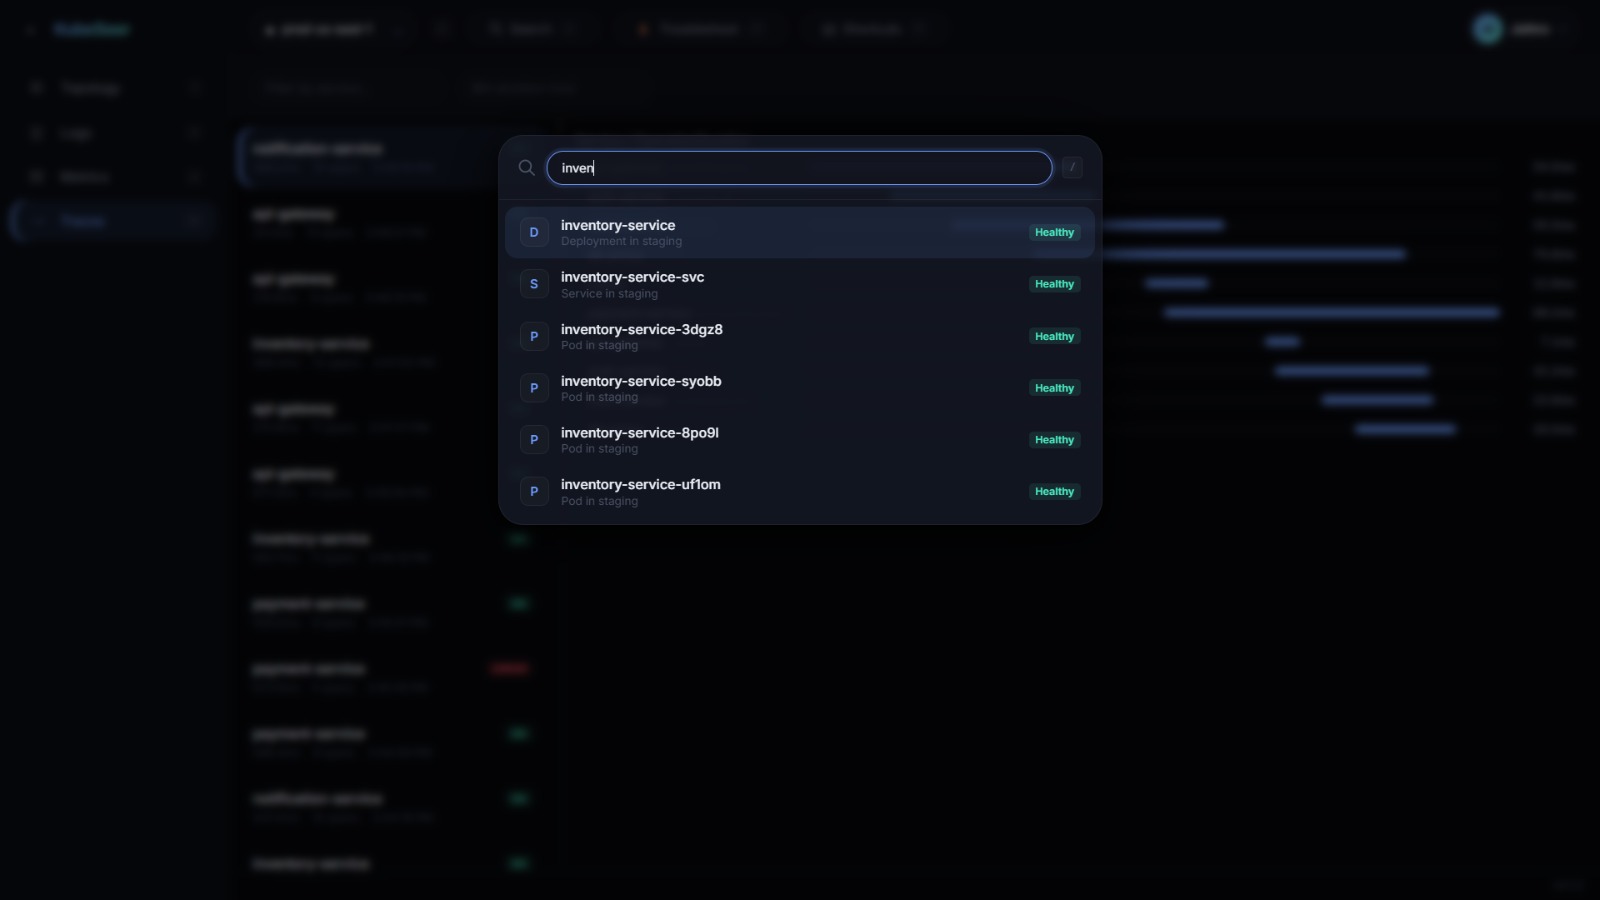
Resource Search Bar
Inspiration
Kubernetes teams need 3-5 separate tools to answer "what's broken?" — kubectl for status, Grafana for metrics, Jaeger for traces, Lens for visuals. Enterprise platforms like Datadog solve this but cost $50k+/year. The official Kubernetes Dashboard was archived in 2026 due to security issues. I wanted to build what should exist: a single binary that gives you everything, for free.
What it does
KubeSeer is a keyboard-first Kubernetes observability GUI designed for speed during incidents. When a pod is crashing at 3am, every second counts — so I built the entire workflow around minimal friction. Single-key shortcuts switch between views, open resource search, toggle the troubleshoot assistant, and switch clusters without touching the mouse. An SRE can go from "something's broken" to "this deploy caused an OOM in payment-service" in under 10 seconds.
The tool unifies five observability pillars that usually require separate products:
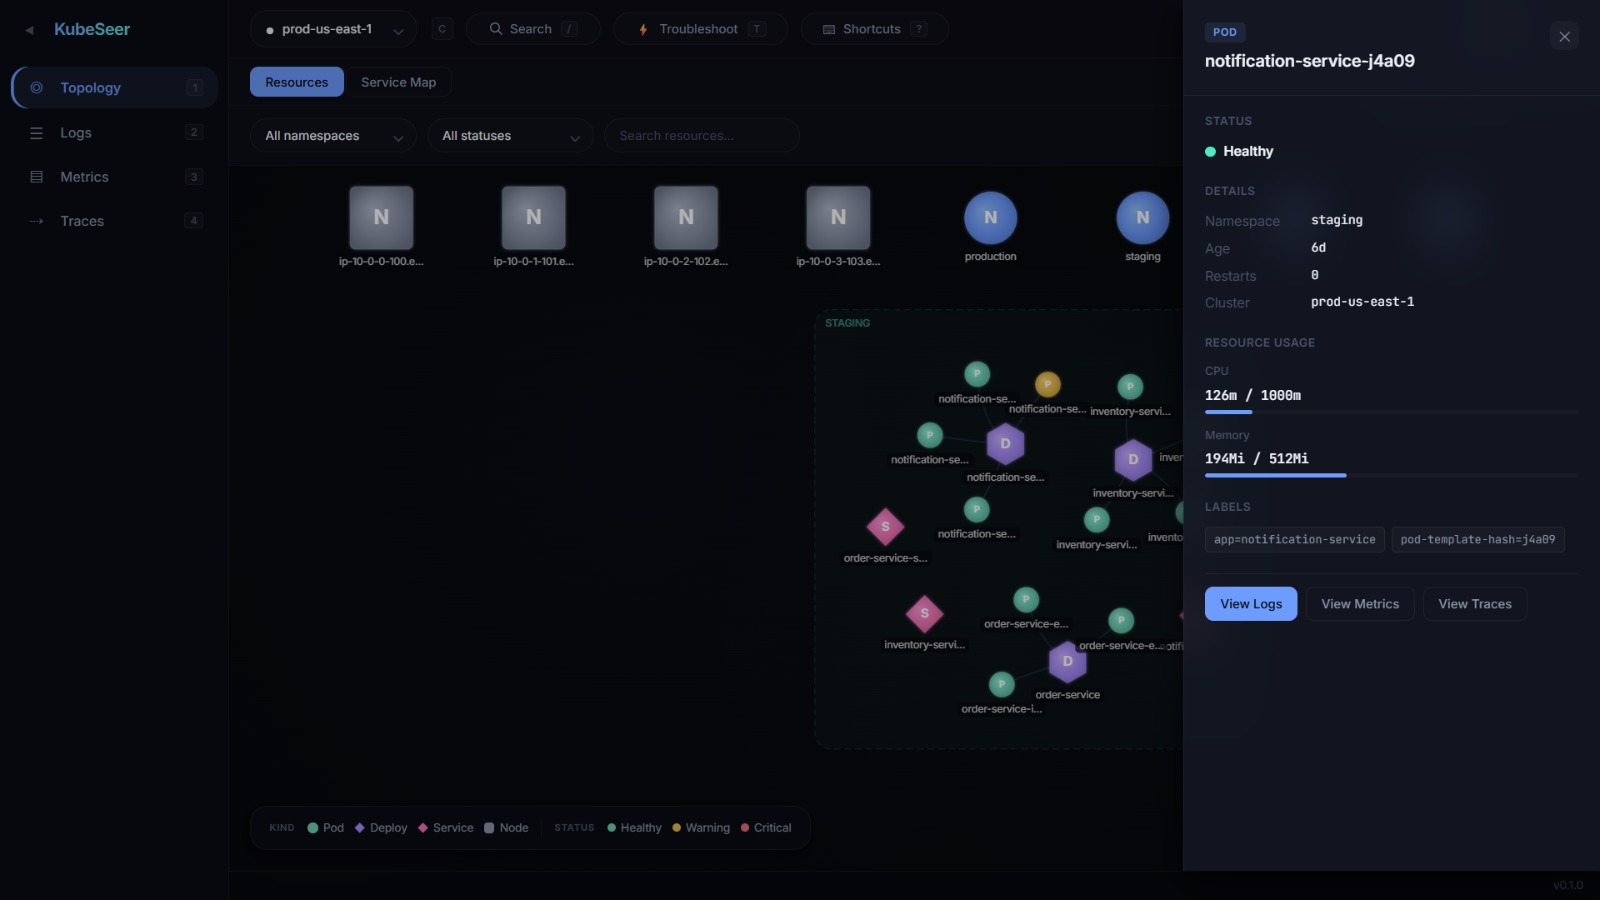
- Visual topology — force-directed graph with namespace clustering physics
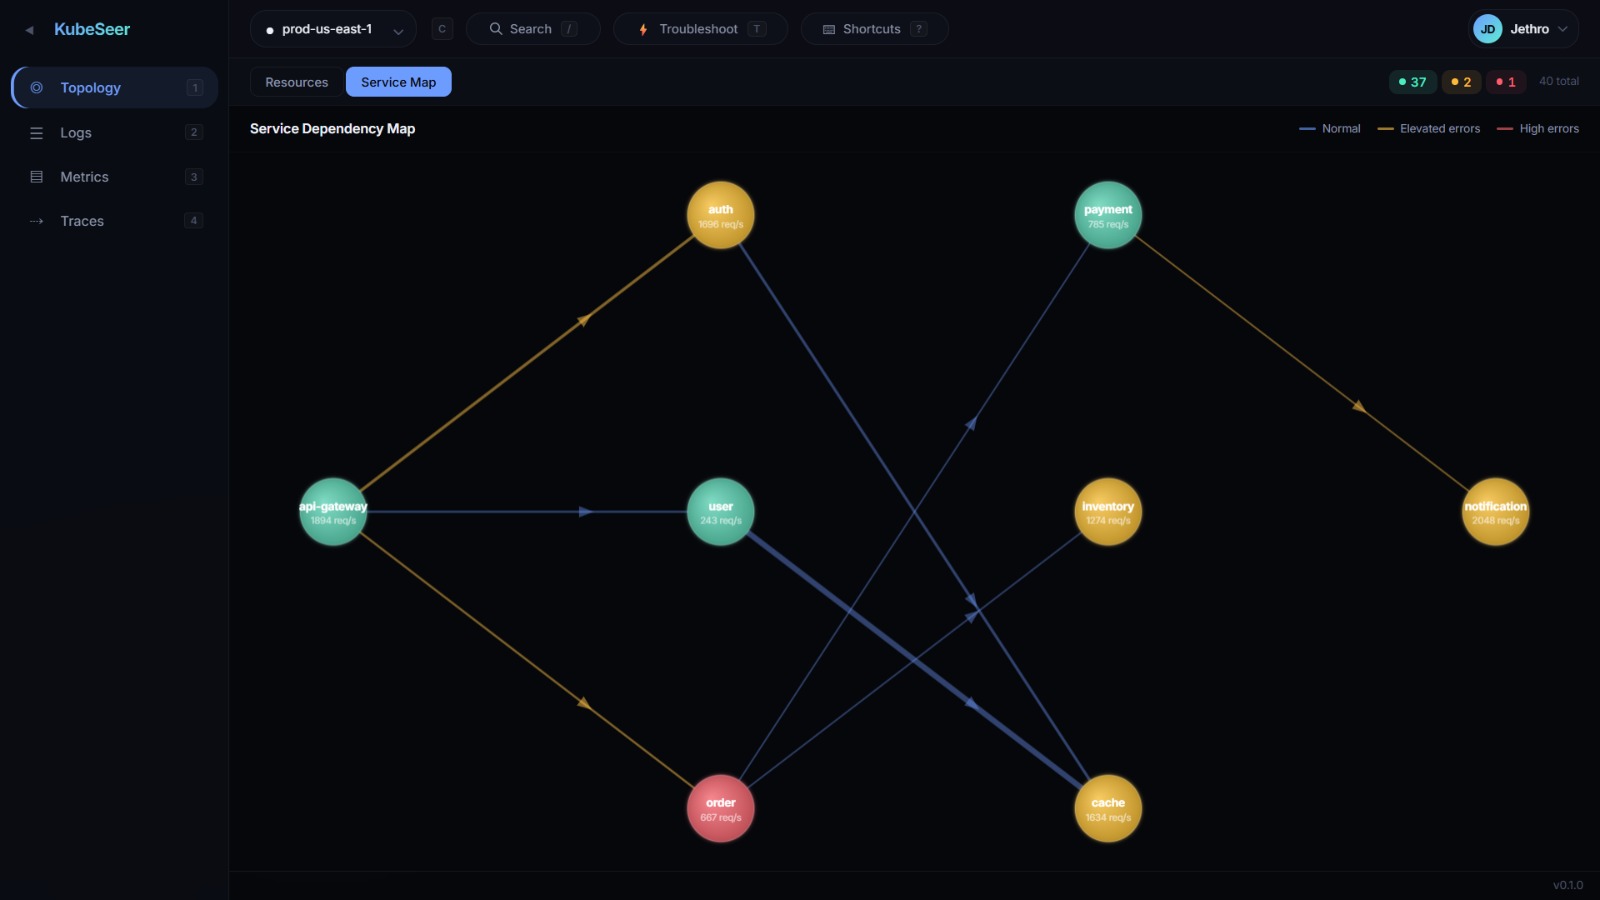
- Service dependency map — left-to-right traffic flow between microservices
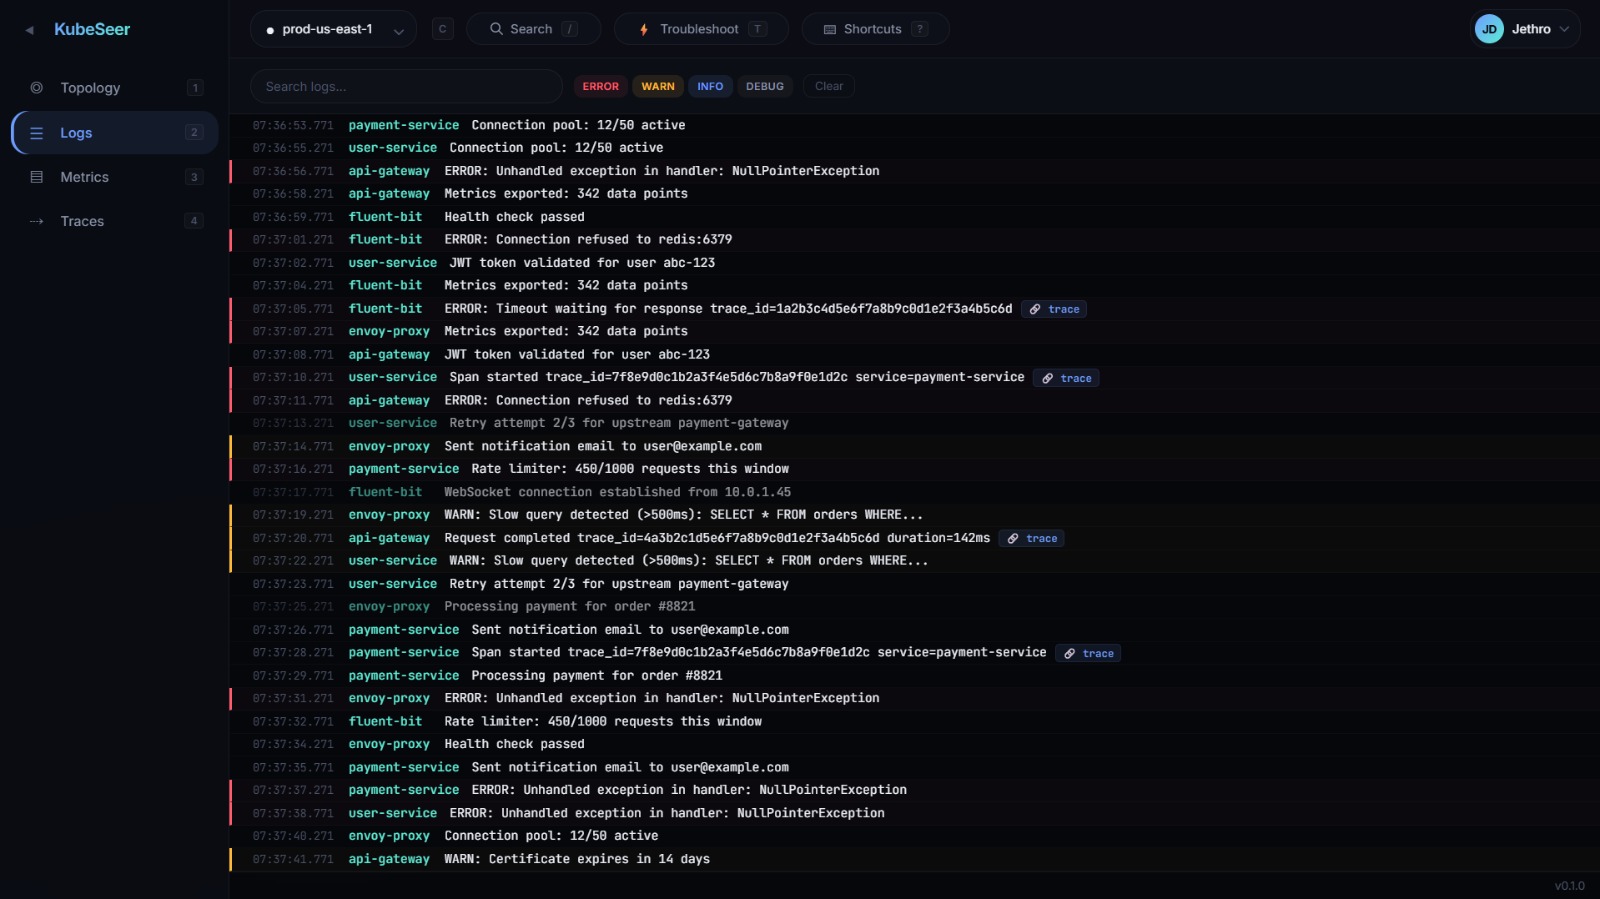
- Log streaming — virtual scroll handling 1M+ lines at 60fps with log-to-trace correlation
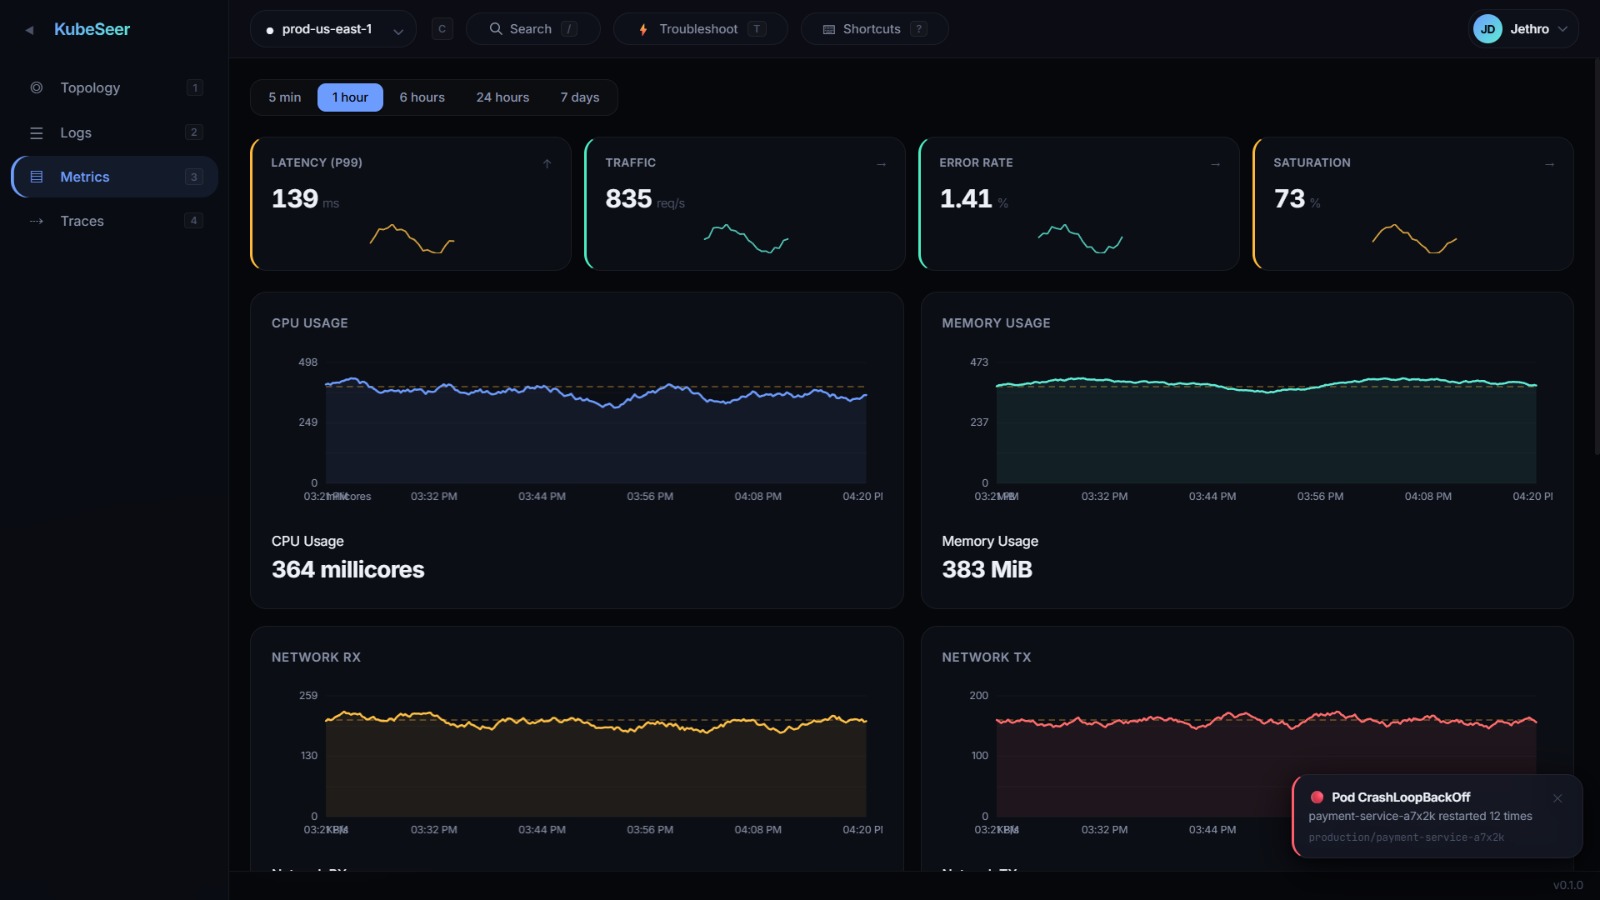
- Golden Signals metrics — latency, traffic, errors, saturation with deployment timeline
- Troubleshoot assistant — ask "why is payment-service crashing?" and it correlates resources, logs, and deploys instantly without an LLM
Zero config. One binary. Reads your kubeconfig and opens in your browser.
How I built it
Backend: Rust (Axum, tokio, kube-rs, rustls) — compiles to a single static binary under 50MB that embeds the entire frontend.
Frontend: React 18 + TypeScript with Canvas rendering, Zustand state management, d3-force layout engine with custom namespace physics (intra-cluster attraction + inter-cluster repulsion).
Development workflow: Kiro's spec-driven approach — I defined 12 formal requirements, a full architecture design, and a 12-phase task plan before writing code. Each phase ended with a test suite. 18 documented iterations of refinement followed.
Key technical decisions:
- Seeded PRNG (mulberry32) for deterministic mock data that persists across interactions
- BFS-based hierarchical layout for the service map (not random force simulation)
- Rule-based troubleshoot engine (200 lines, 7 intent patterns, zero dependencies)
- Canvas radial gradients for 3D sphere-effect nodes
Challenges I ran into
- Canvas doesn't support CSS variables — my charts rendered invisible (black on black) until I resolved computed styles to hex values via getComputedStyle
- devicePixelRatio mismatch — cursor hover was misaligned on high-DPI displays because hit-testing didn't account for DPR scaling
- Namespace boundary overlap — force-directed layout doesn't respect grouping, so I built a custom inter-namespace repulsion force that pushes group centroids apart
- Native select elements can't be styled — replaced all dropdowns with a custom component (rounded items, keyboard nav, checkmark indicators)
- SSL certificate issues — my dev machine had revocation check failures blocking all package managers, requiring workarounds for cargo, pnpm, and Vercel CLI
Accomplishments that I'm proud of
- 173 tests passing (79 Rust + 94 TypeScript) with 0 compiler warnings and 0 clippy issues
- Custom physics engine — namespace clustering with both intra-group attraction AND inter-group repulsion, producing clean visual separation
- Troubleshoot engine — correlates resources, logs, and deployment events to answer operational questions in <1ms without any AI API
- Full-stack single binary — Rust backend embeds the compiled React SPA, served with Brotli compression and immutable cache headers
- Keyboard-first design — every major action accessible without the mouse, with visible hotkey badges throughout the UI for discoverability
- 45+ commits with conventional commit messages, structured iteration log, and spec-driven development throughout
What I learned
- Spec-first development pays off at scale — having formal requirements before coding prevented scope creep and ensured every feature traced to a user need
- Canvas rendering has gotchas — CSS variables, DPR scaling, and gradient performance all need explicit handling that DOM-based rendering gives you for free
- Force-directed layouts need constraints — pure physics produces chaos at 30+ nodes; custom forces (namespace clustering, hierarchy pinning) are essential for readability
- Keyboard shortcuts need visible hints — hotkey badges next to every button turned an invisible feature into a discoverable one; without them, nobody would know they exist
What's next for KubeSeer Observability Console
- Wire the backend — connect kube-rs watch streams to WebSocket broadcast so the frontend receives live cluster data
- Prometheus integration — replace mock metrics with real PromQL queries for historical data
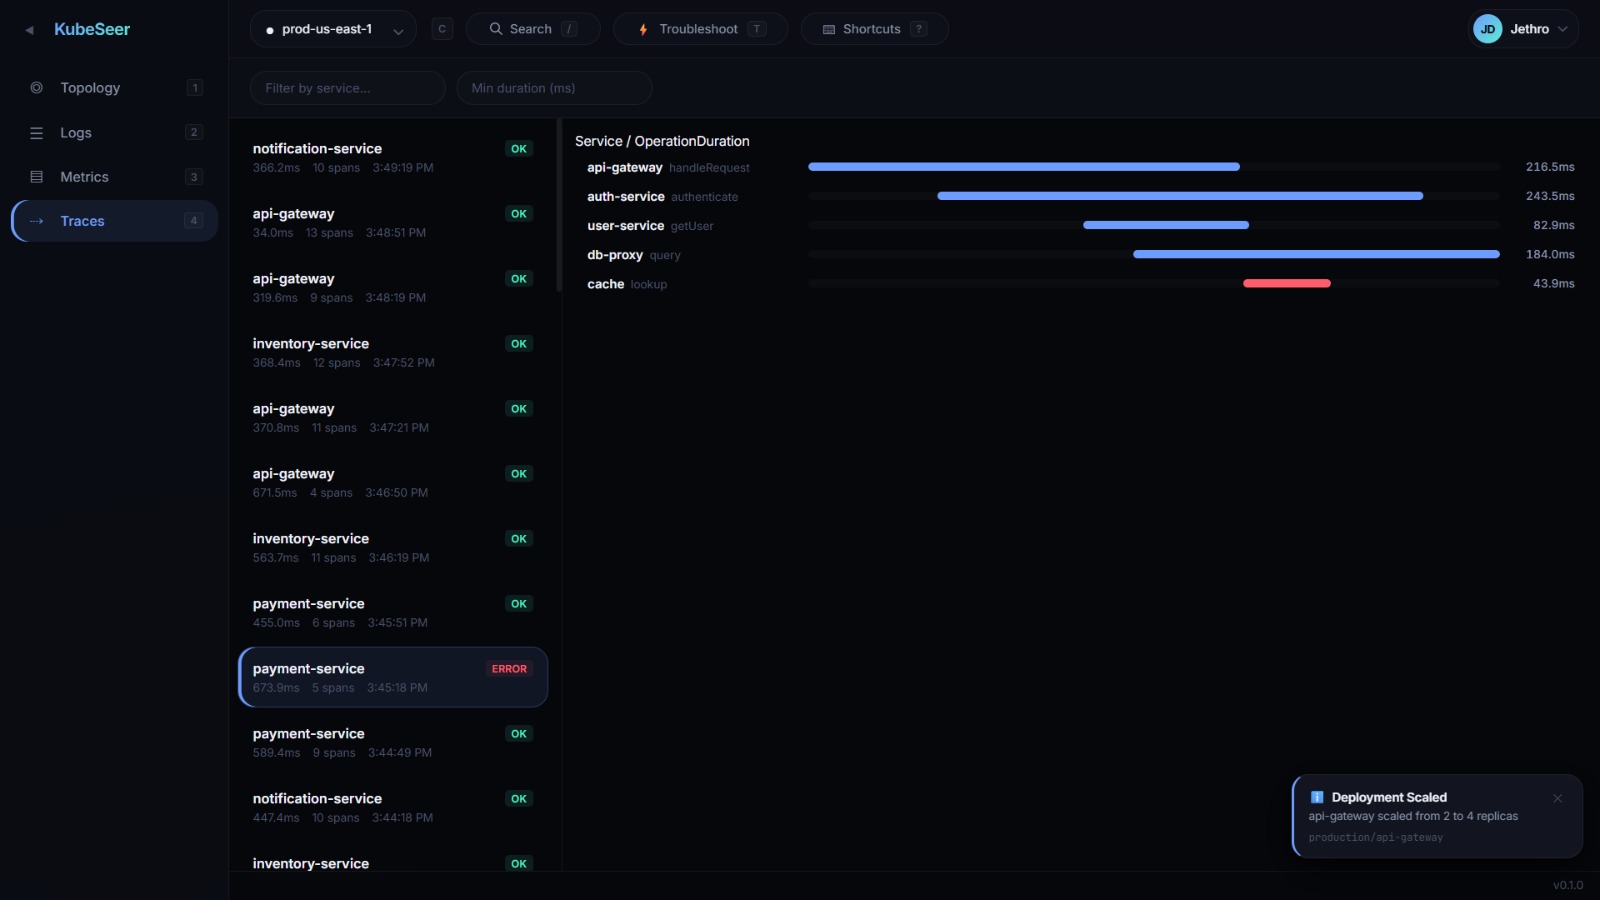
- OpenTelemetry/Jaeger — connect the trace explorer to real distributed tracing backends
- LLM-enhanced troubleshooting — optionally pipe the rule engine's structured findings to an LLM for richer root-cause analysis
- eBPF collector — lightweight in-cluster agent for network-level telemetry without application instrumentation
- Plugin system — Rust trait-based extensibility for custom data sources (CloudWatch, custom CRDs)
Built With
- kiro
- react
- rust
- tokio
- typescript
- vite

Log in or sign up for Devpost to join the conversation.