-
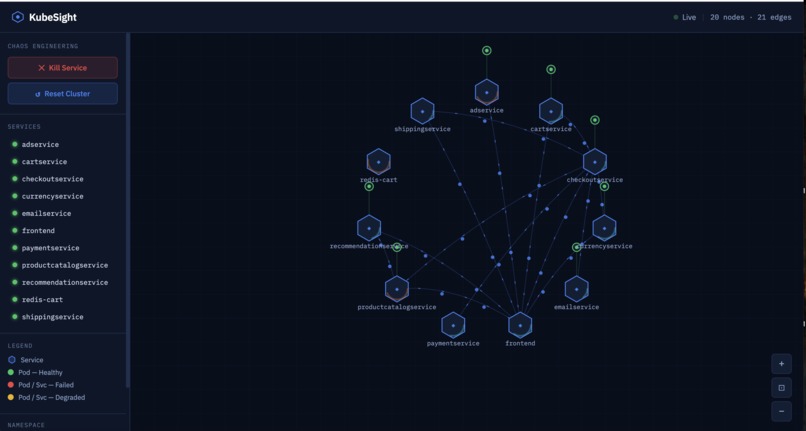
This is showing the visualizer in action!
-
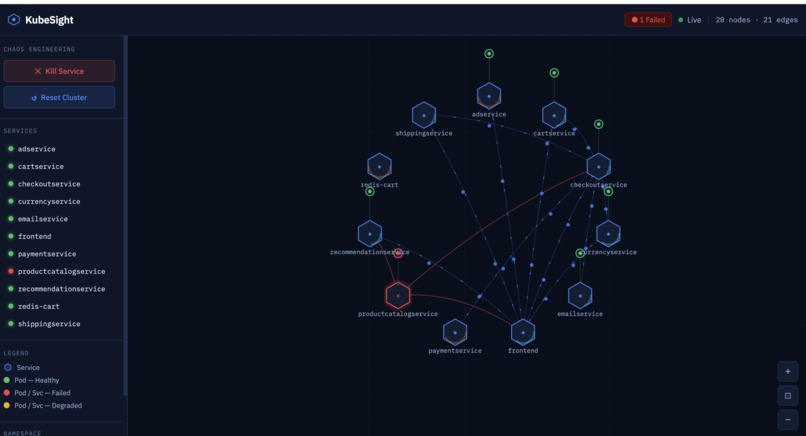
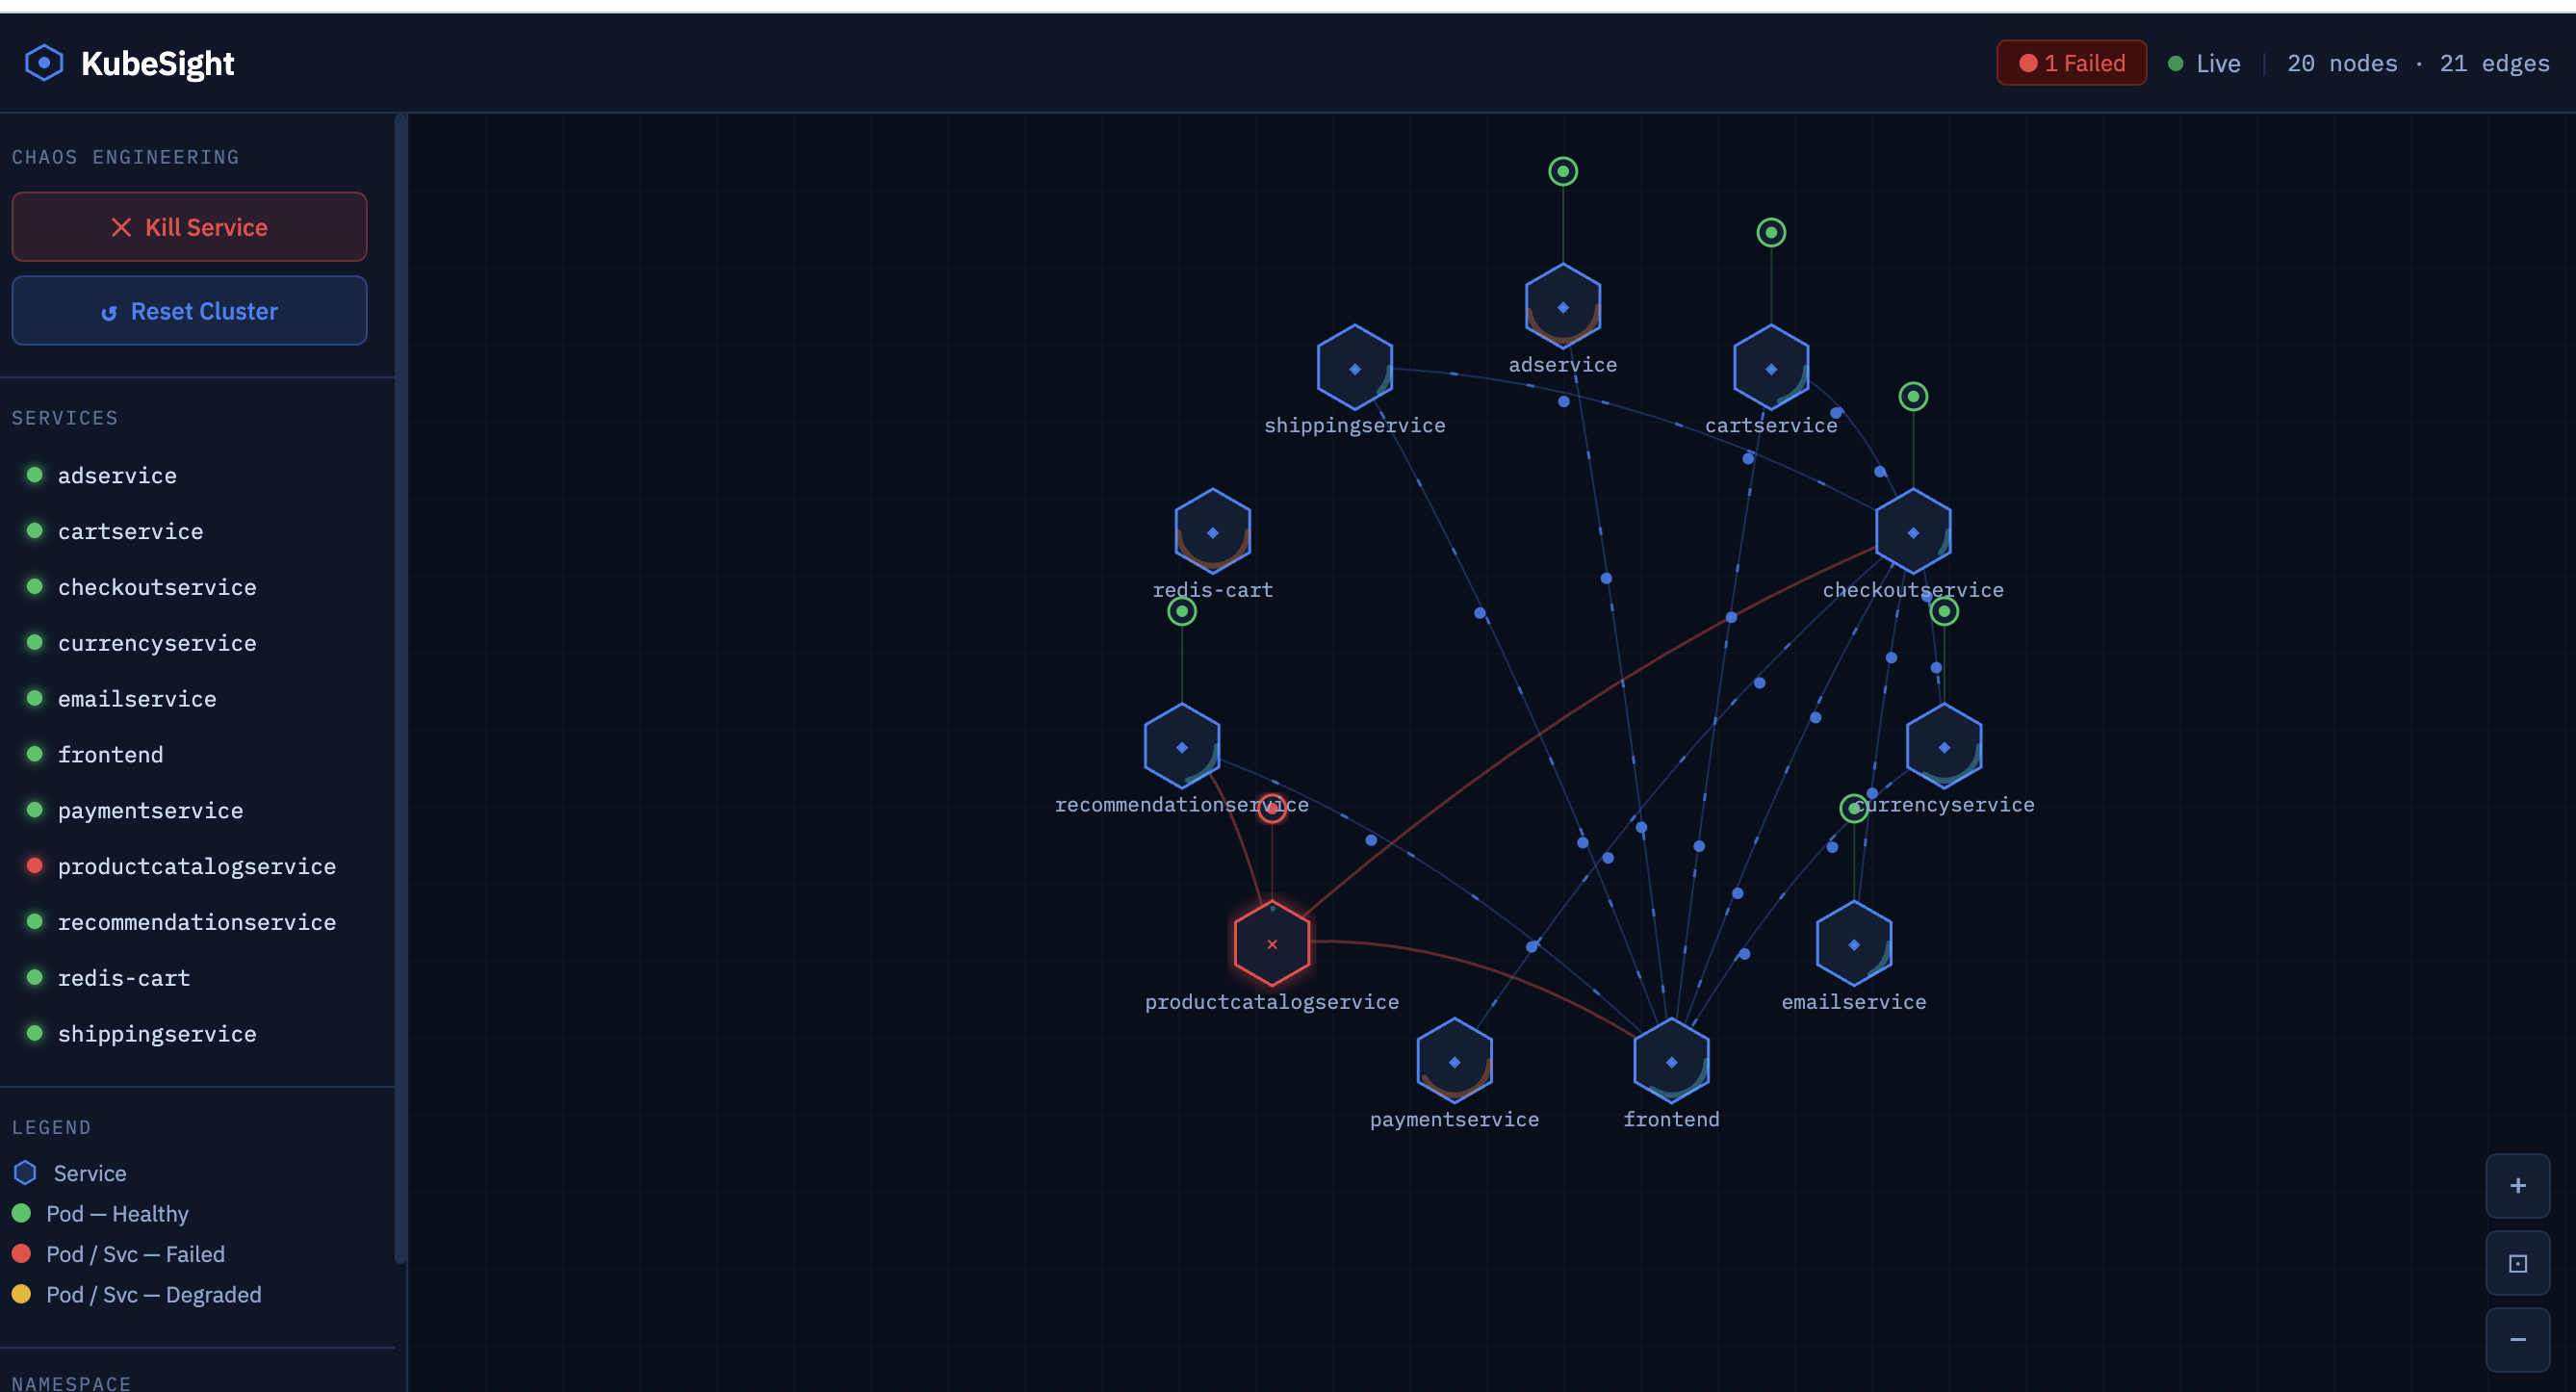
Chaos testing: Kill any service and watch failures cascade through dependent services in real-time
Inspiration
We wanted to solve a fundamental problem in Kubernetes development: understanding what's actually running in your cluster. When you deploy microservices architectures with dozens of interconnected services, it's nearly impossible to visualize dependencies, trace traffic flow, or debug failures. Existing tools either show static diagrams from documentation or require complex setup. We asked: "What if you could deploy any architecture and instantly see it come to life?"
What it does
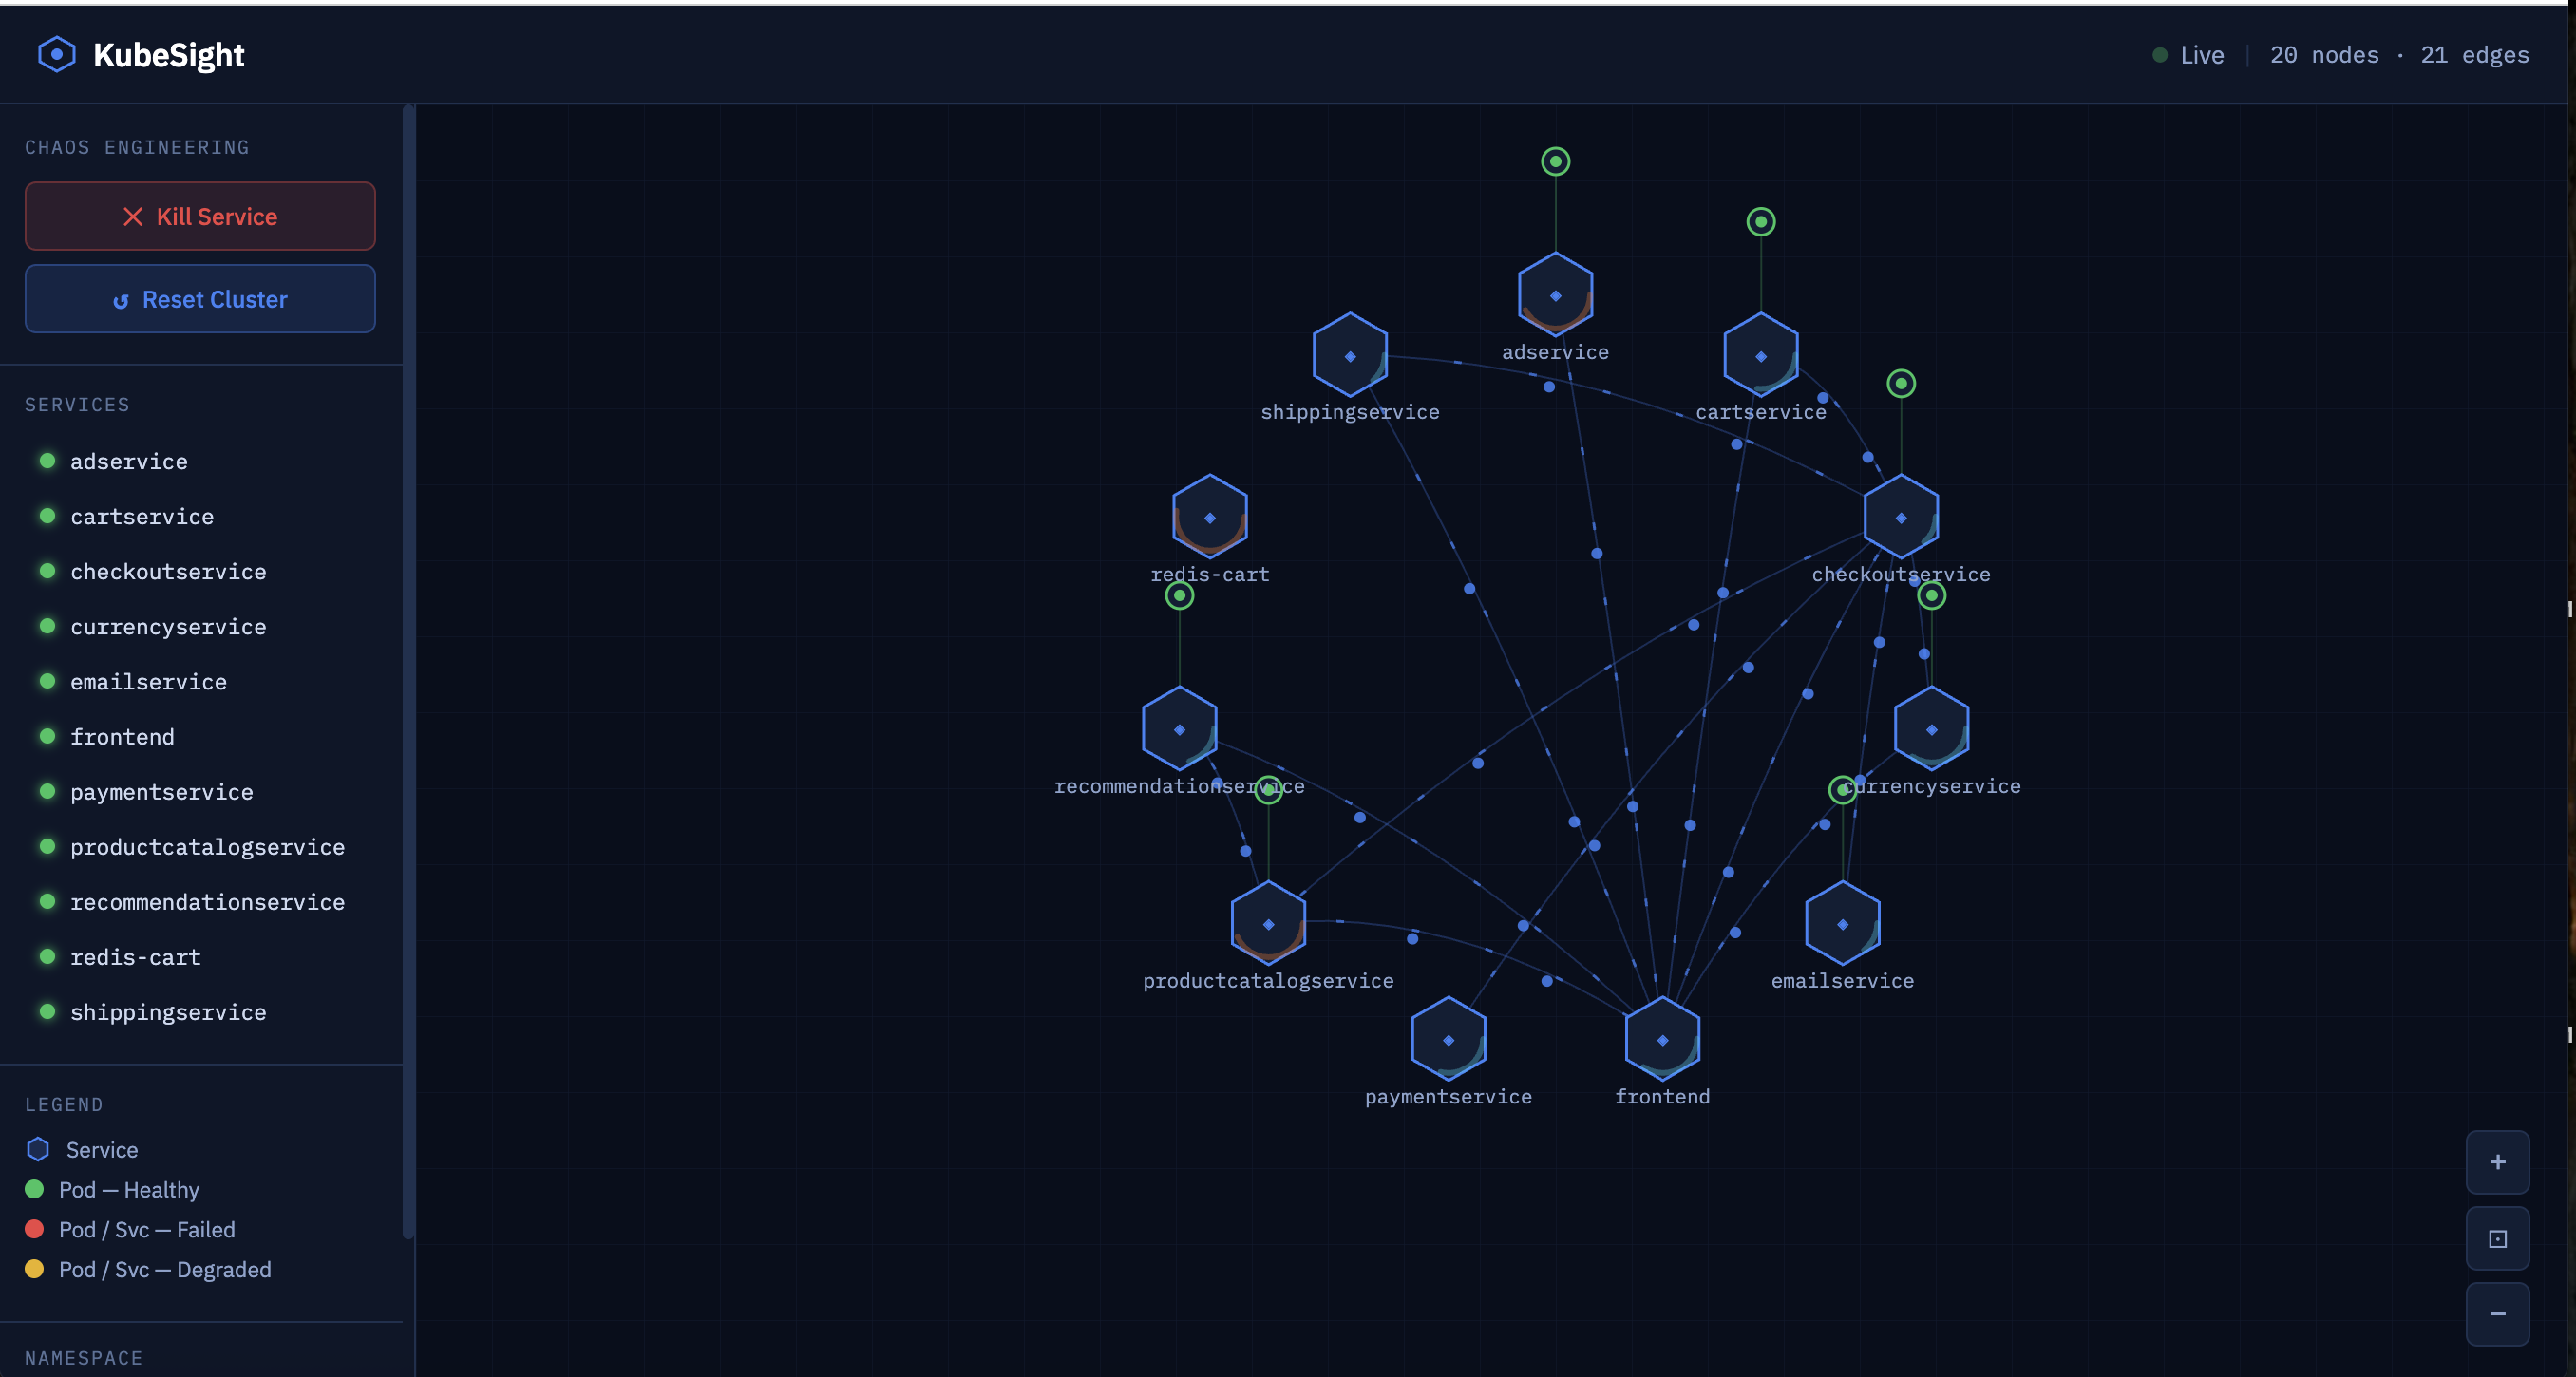
KubeSight is a real-time Kubernetes network visualizer that turns YAML manifests into interactive network graphs in seconds.
User Flow:
- Select an architecture - Choose from industry-standard demo architectures (Google Boutique, Sock Shop, Bookinfo, Yelb)
- Visualize live topology - Interactive graph displays services, pods, dependencies, and real-time traffic flow
- Test failures - Chaos controls let you kill services and watch cascading failures propagate through the system
How we built it
Backend: Go with Kubernetes client-go library. Custom topology discovery algorithm lists pods/services, matches them via label selectors, and detects dependencies by parsing environment variables. REST API handles deployment, status polling, and chaos testing.
Frontend: Landing page uses js-yaml to parse manifests with a loading overlay. React + Vis.js visualizer renders the network graph with real-time updates (2-second polling).
Infrastructure: Minikube cluster with 4 isolated namespaces.
Challenges we ran into
- Resource limits: Deploying 26 pods simultaneously crashed minikube's API server
- Dependency detection: K8s doesn't store service dependencies, so we extracted them from pod environment variables
- Hosting it non-locally: we had issues with having a lot of files.
Accomplishments that we're proud of
- Truly dynamic - works with any K8s architecture, not hardcoded demos
- 4 industry demo architecture - Google Boutique, Sock Shop, Bookinfo, Yelb all working
- Polished UX - landing page → loading screen → interactive visualizer
- Chaos testing - kill services and watch cascading failures in real-time
What we learned
- Resource management: namespace isolation, cleanup strategies
- Async patterns: polling mechanisms, timeout handling, progress feedback
- Kubernetes internals: label selectors, pod specs, API querying
- Graph visualization: node positioning, edge routing for complex networks
What's next for KubeMicro-Visualizer
- Custom YAML uploads beyond the 4 presets
- WebSocket streaming for instant topology updates
- Multi-cluster support across GKE/EKS/AKS
- Traffic metrics from Prometheus/Istio to show real load
- Historical playback to replay incidents

Log in or sign up for Devpost to join the conversation.