Inspiration Every day in ICUs, monitors beep with false alarms while real danger creeps in silently. Doctors are overwhelmed with data but starved of insight. We asked: what if we could see the hidden shape of a patient's illness—the moment their body starts to fall apart—before vital signs crash? That question led us to topology, chaos theory, and the birth of KCTHO.
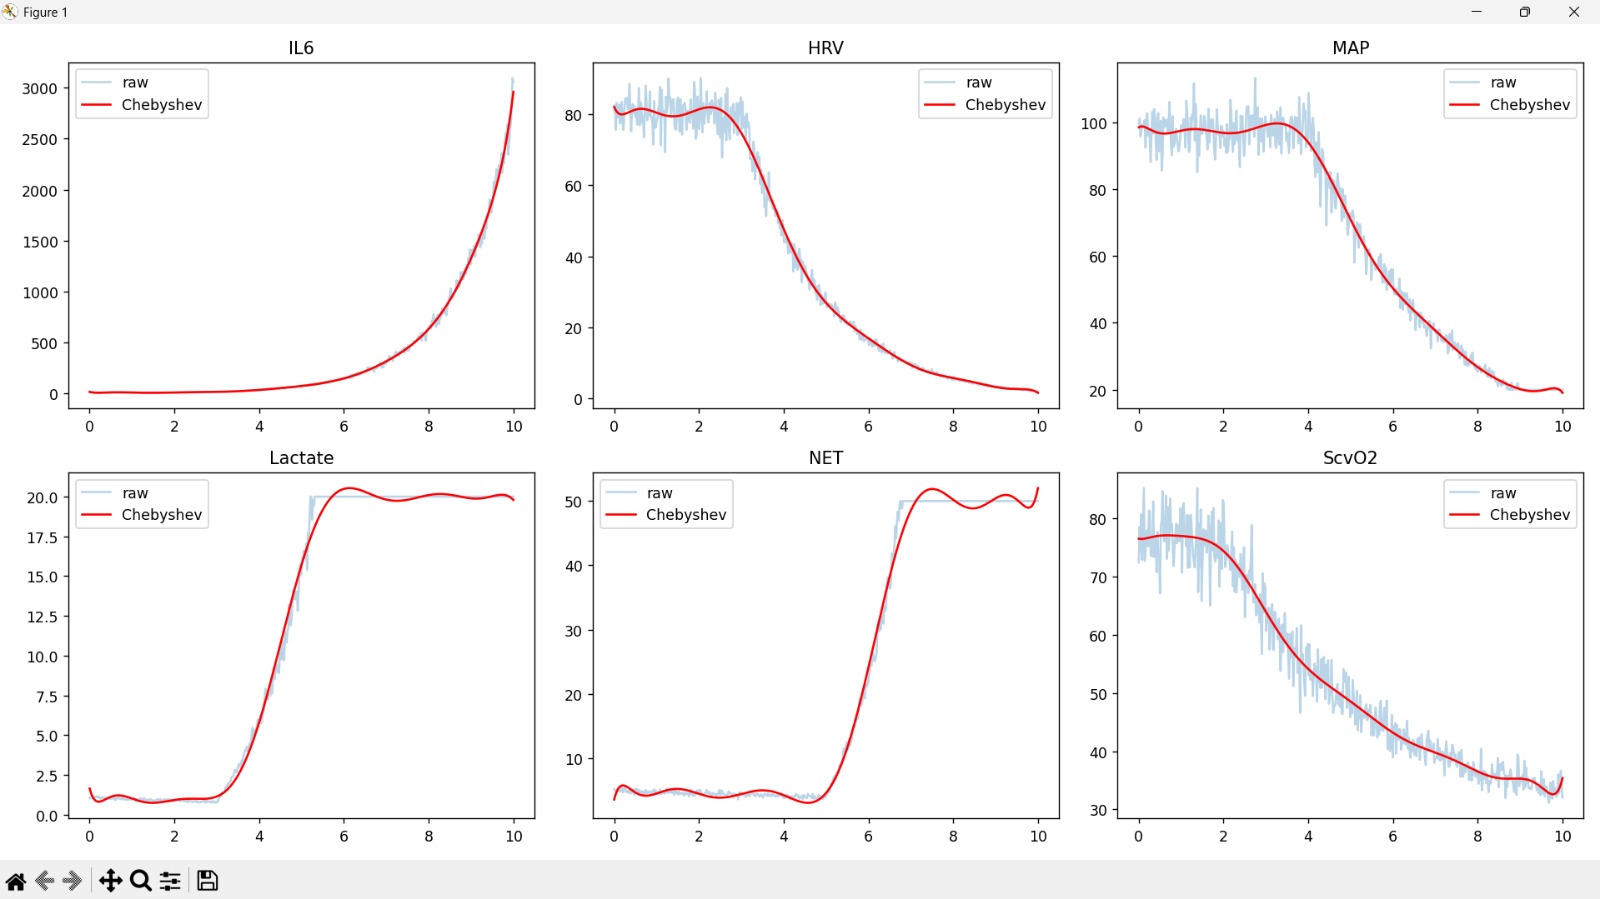
What it does KCTHO turns streams of vital signs (MAP, lactate, HRV, ScvO₂, IL‑6, NETs) into a living mathematical portrait of the patient. It:
Detects early warning signs using persistent homology – when the body’s regulatory loops break (β₁=0) or micro‑circulation fails (β₂>0), it raises the flag hours before traditional alarms.
Measures chaos with Lyapunov exponents – tells doctors if the patient’s trajectory is predictable or spinning out of control.
Identifies the real driver of deterioration – which variable (inflammation? heart rate?) holds the key.
Simulates treatments – “What if I give fluids?” – and shows exactly how every metric would change.
Compares with real cases from a curated dataset of clinical examples, grounding the math in reality.
Explains it all in plain language, powered by Gemini AI, so any clinician can act with confidence.
How we built it We built KCTHO as a modular Python pipeline:
Data generation: Ordinary differential equations (ODEs) model sepsis, cardiac arrest, and hemorrhage, with randomised parameters to create endless unique patient trajectories.
Chebyshev smoothing cleans noise while preserving physiological trends.
Topological analysis: Using ripser and persim, we compute persistent homology – Betti numbers and entropy.
Dynamical systems: nolds gives us Lyapunov exponents and correlation dimensions.
Kolmogorov‑Arnold Networks: Custom B‑spline fitting quantifies the complexity of variable interactions.
Ricci curvature: Nearest‑neighbour graphs estimate geometric stability.
Clinical interpretation: Reference ranges from medical literature turn numbers into meanings.
Gemini integration: Google’s latest models generate doctor‑ and patient‑friendly summaries.
Example matching: A custom loader finds the closest real‑world cases from CSV datasets.
The whole system runs from the command line, with rich visual outputs and an interactive treatment simulator.

Log in or sign up for Devpost to join the conversation.