-
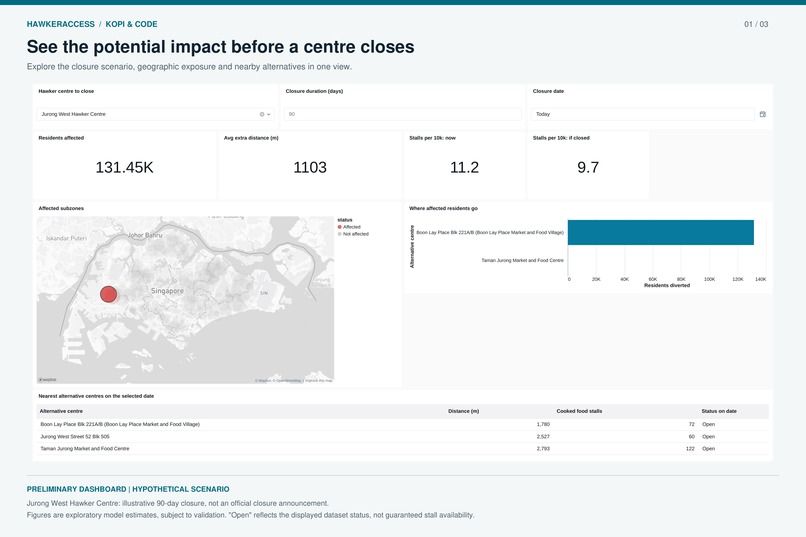
Preliminary HawkerAccess dashboard exploring a hypothetical hawker centre closure and modelled changes in local food access.
-
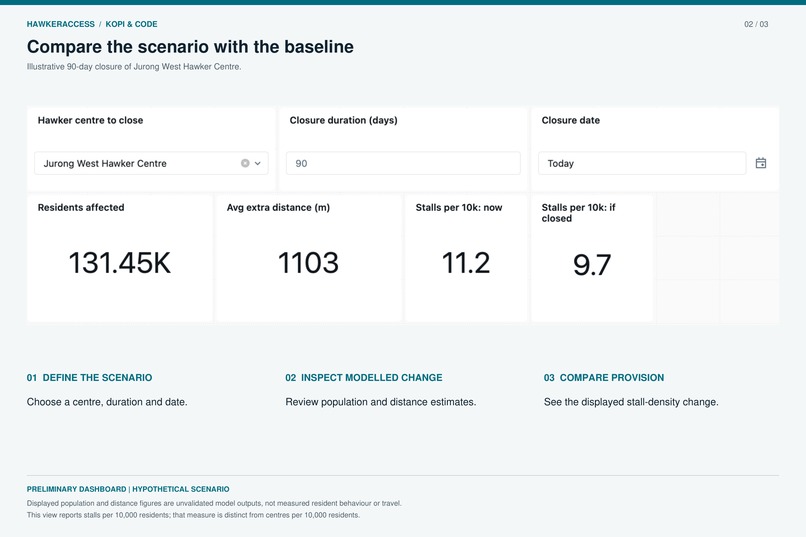
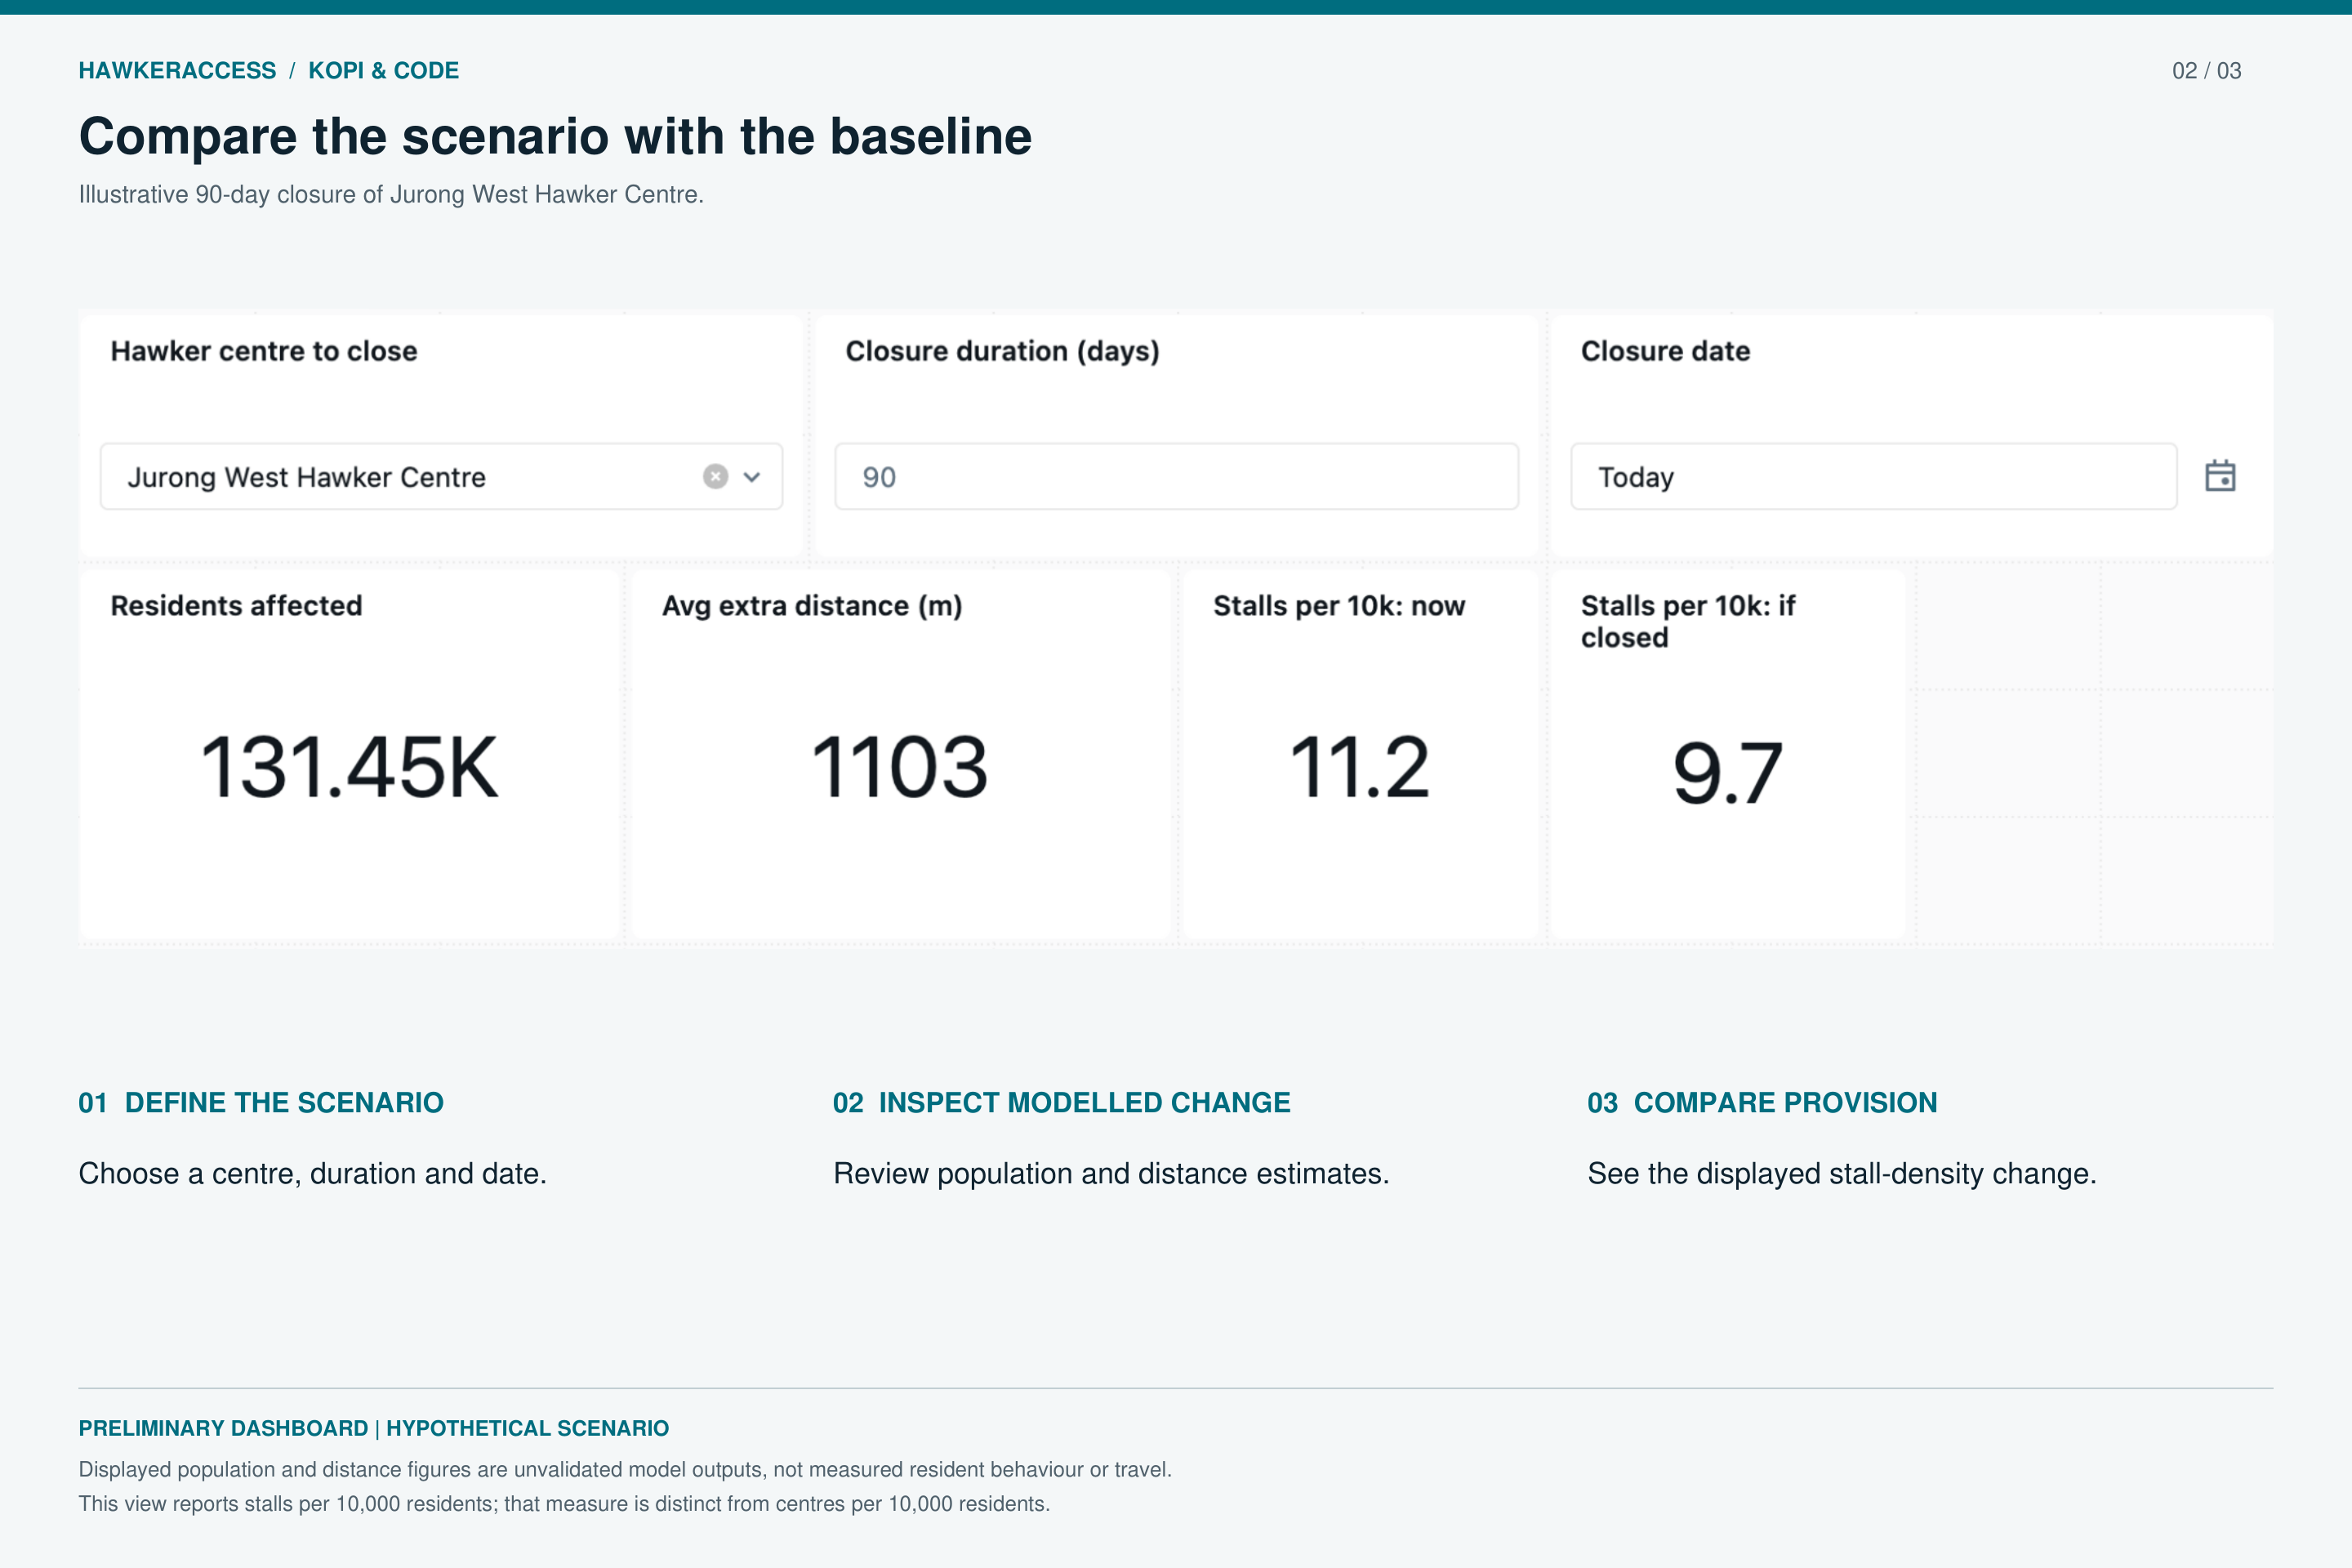
Hypothetical 90-day closure of Jurong West Hawker Centre. Exploratory model estimates, subject to validation; not an official closure notice
-
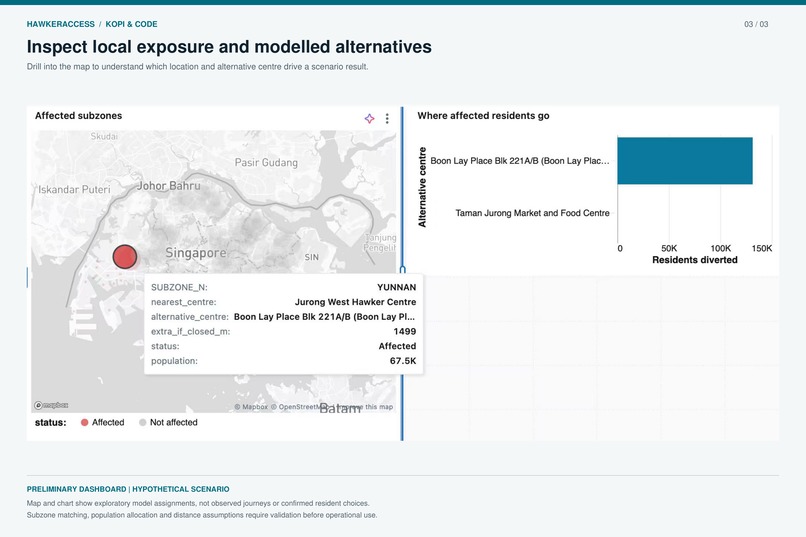
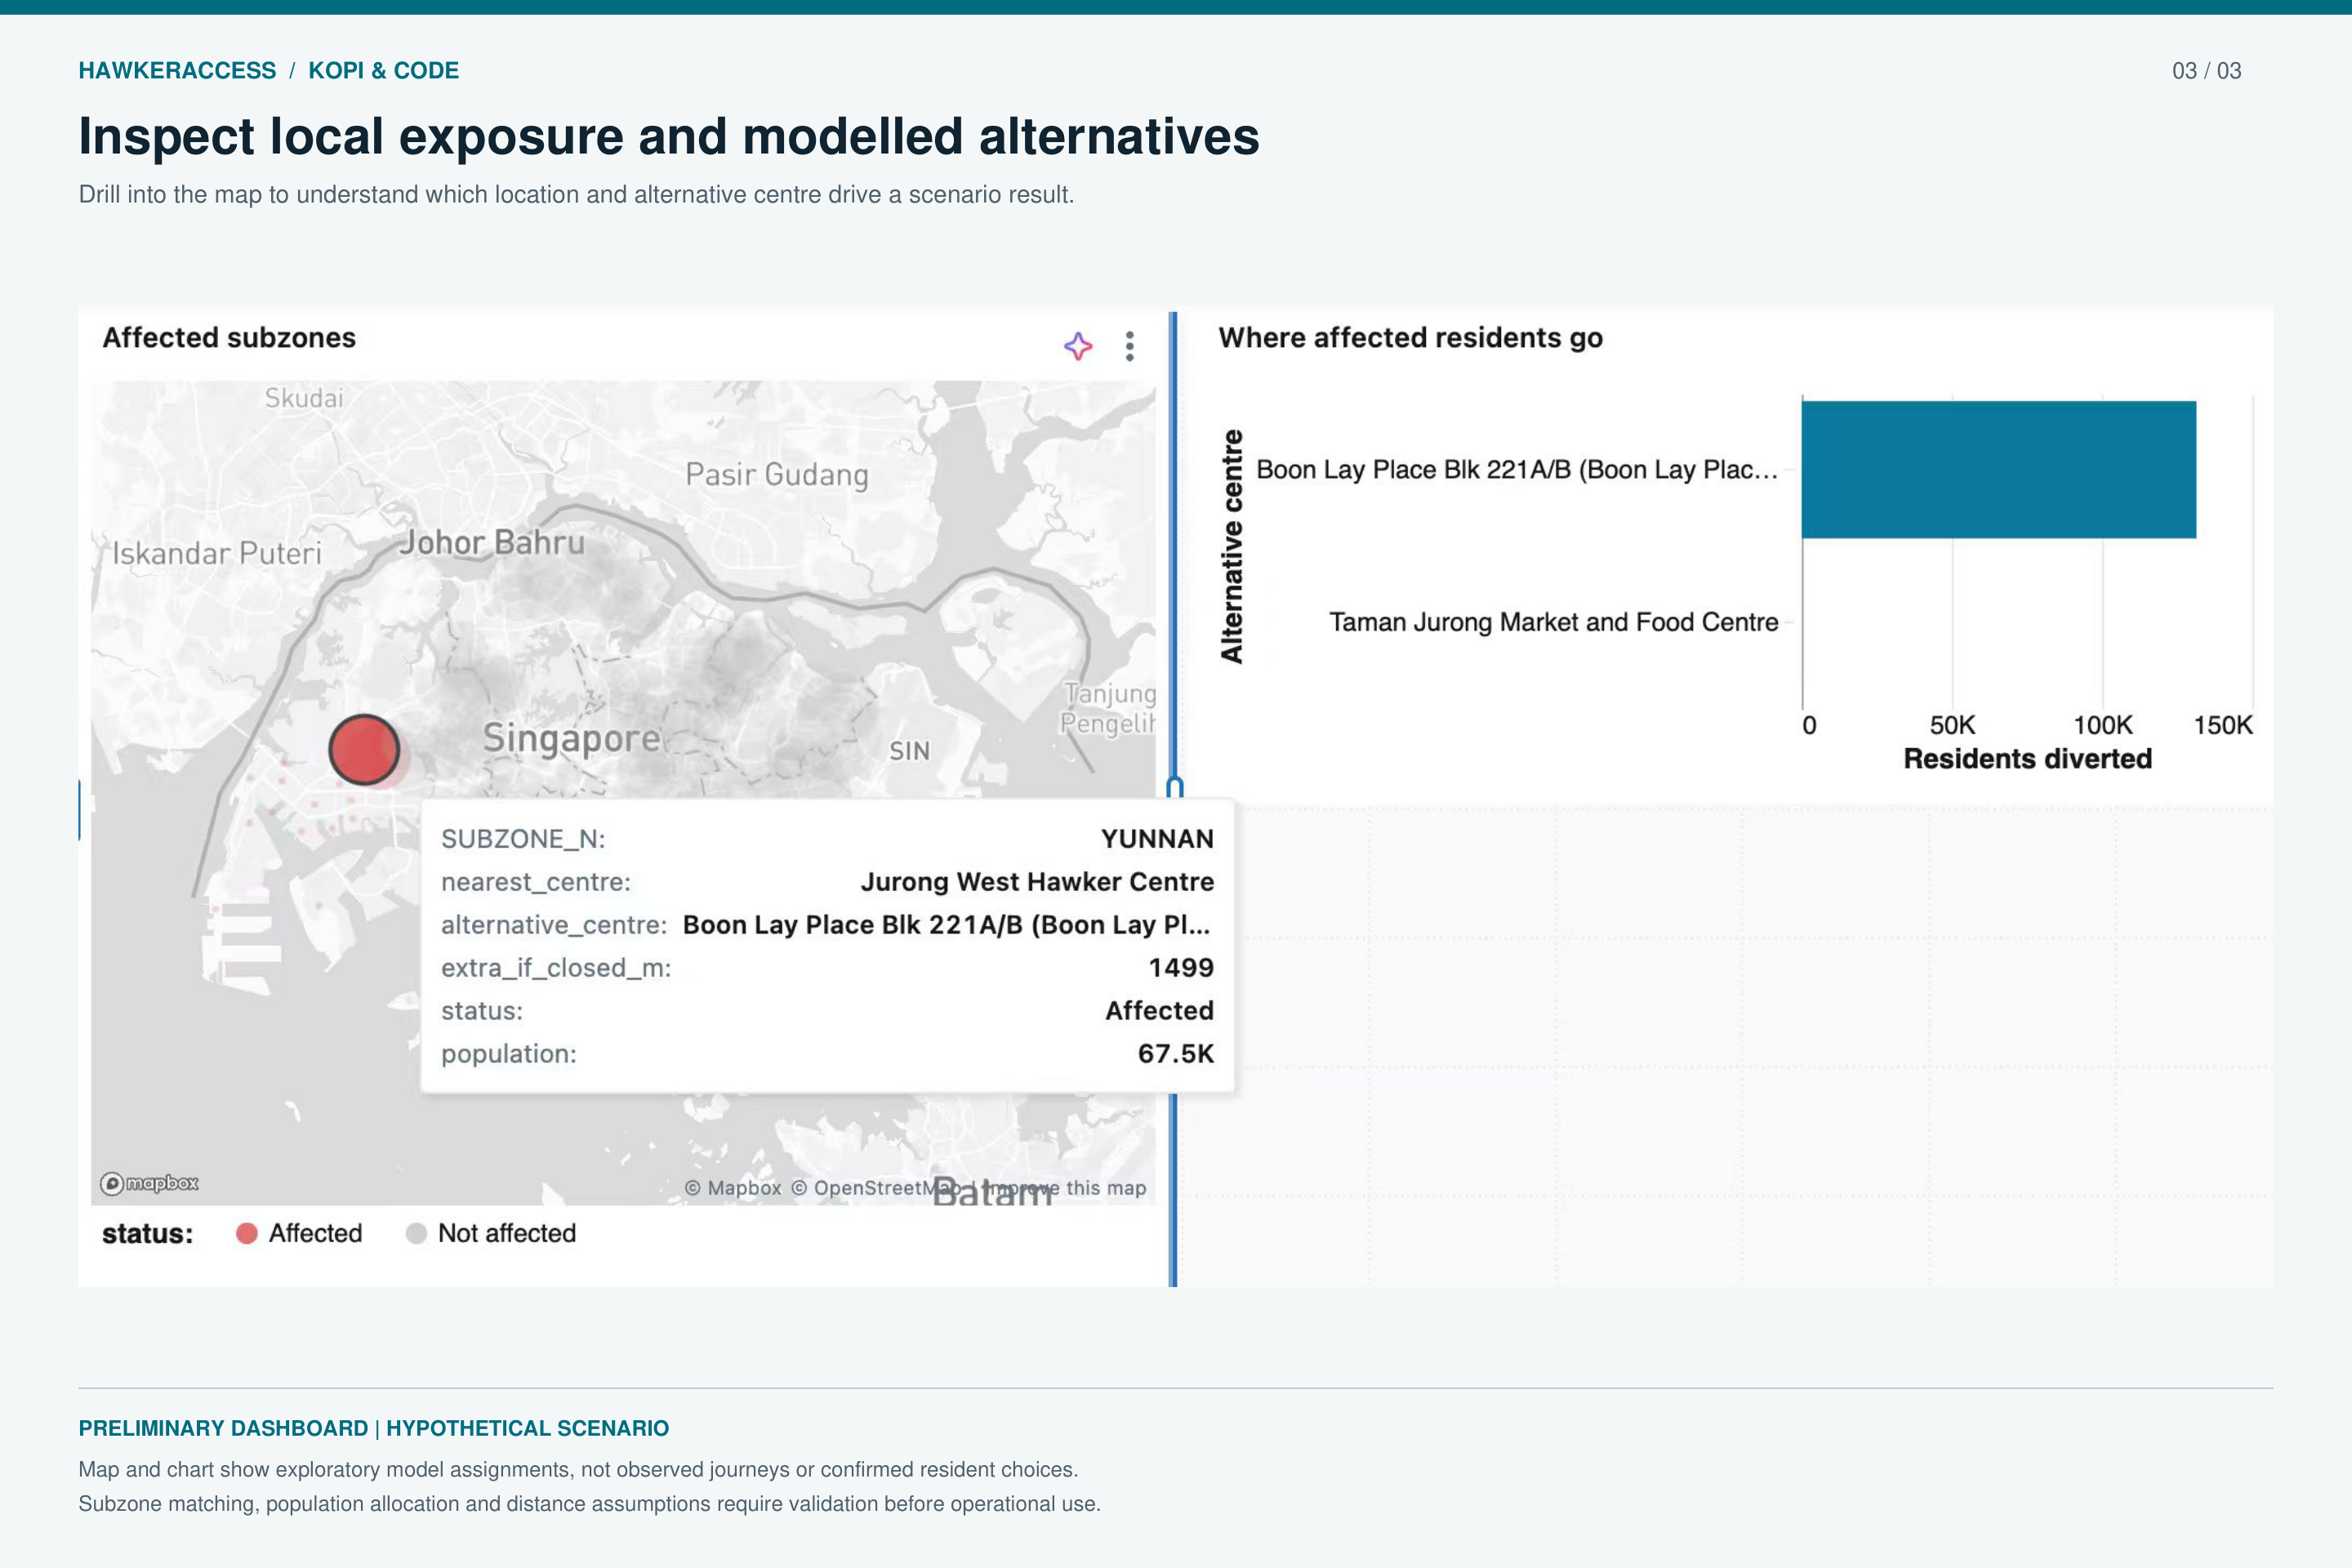
Map detail showing modelled local exposure and nearby alternative hawker centres. Results do not represent observed resident behaviour.
Inspiration
When a hawker centre closes for cleaning or works, residents who usually eat there need to find somewhere else. That can be harder for people with limited mobility, especially if nearby alternatives are limited.
Closure notices tell us when a centre will close. They leave community planners to work out what that means for the surrounding neighbourhoods.
We looked at Adam Road’s scheduled closure on 7–8 December 2026. Our preliminary calculation puts Empress Road, the nearest listed alternative without a recorded scheduled closure on 7 December, about 1.28 km away. That is a straight-line distance between centres, not the extra distance residents would travel. It gave us a concrete question to explore: how can planners see the local consequences of a closure before it happens?
Our team, Kopi & Code, proposed HawkerAccess for C3 — KopilamAI: Hawker culture, food access & community sustainability.
What it does
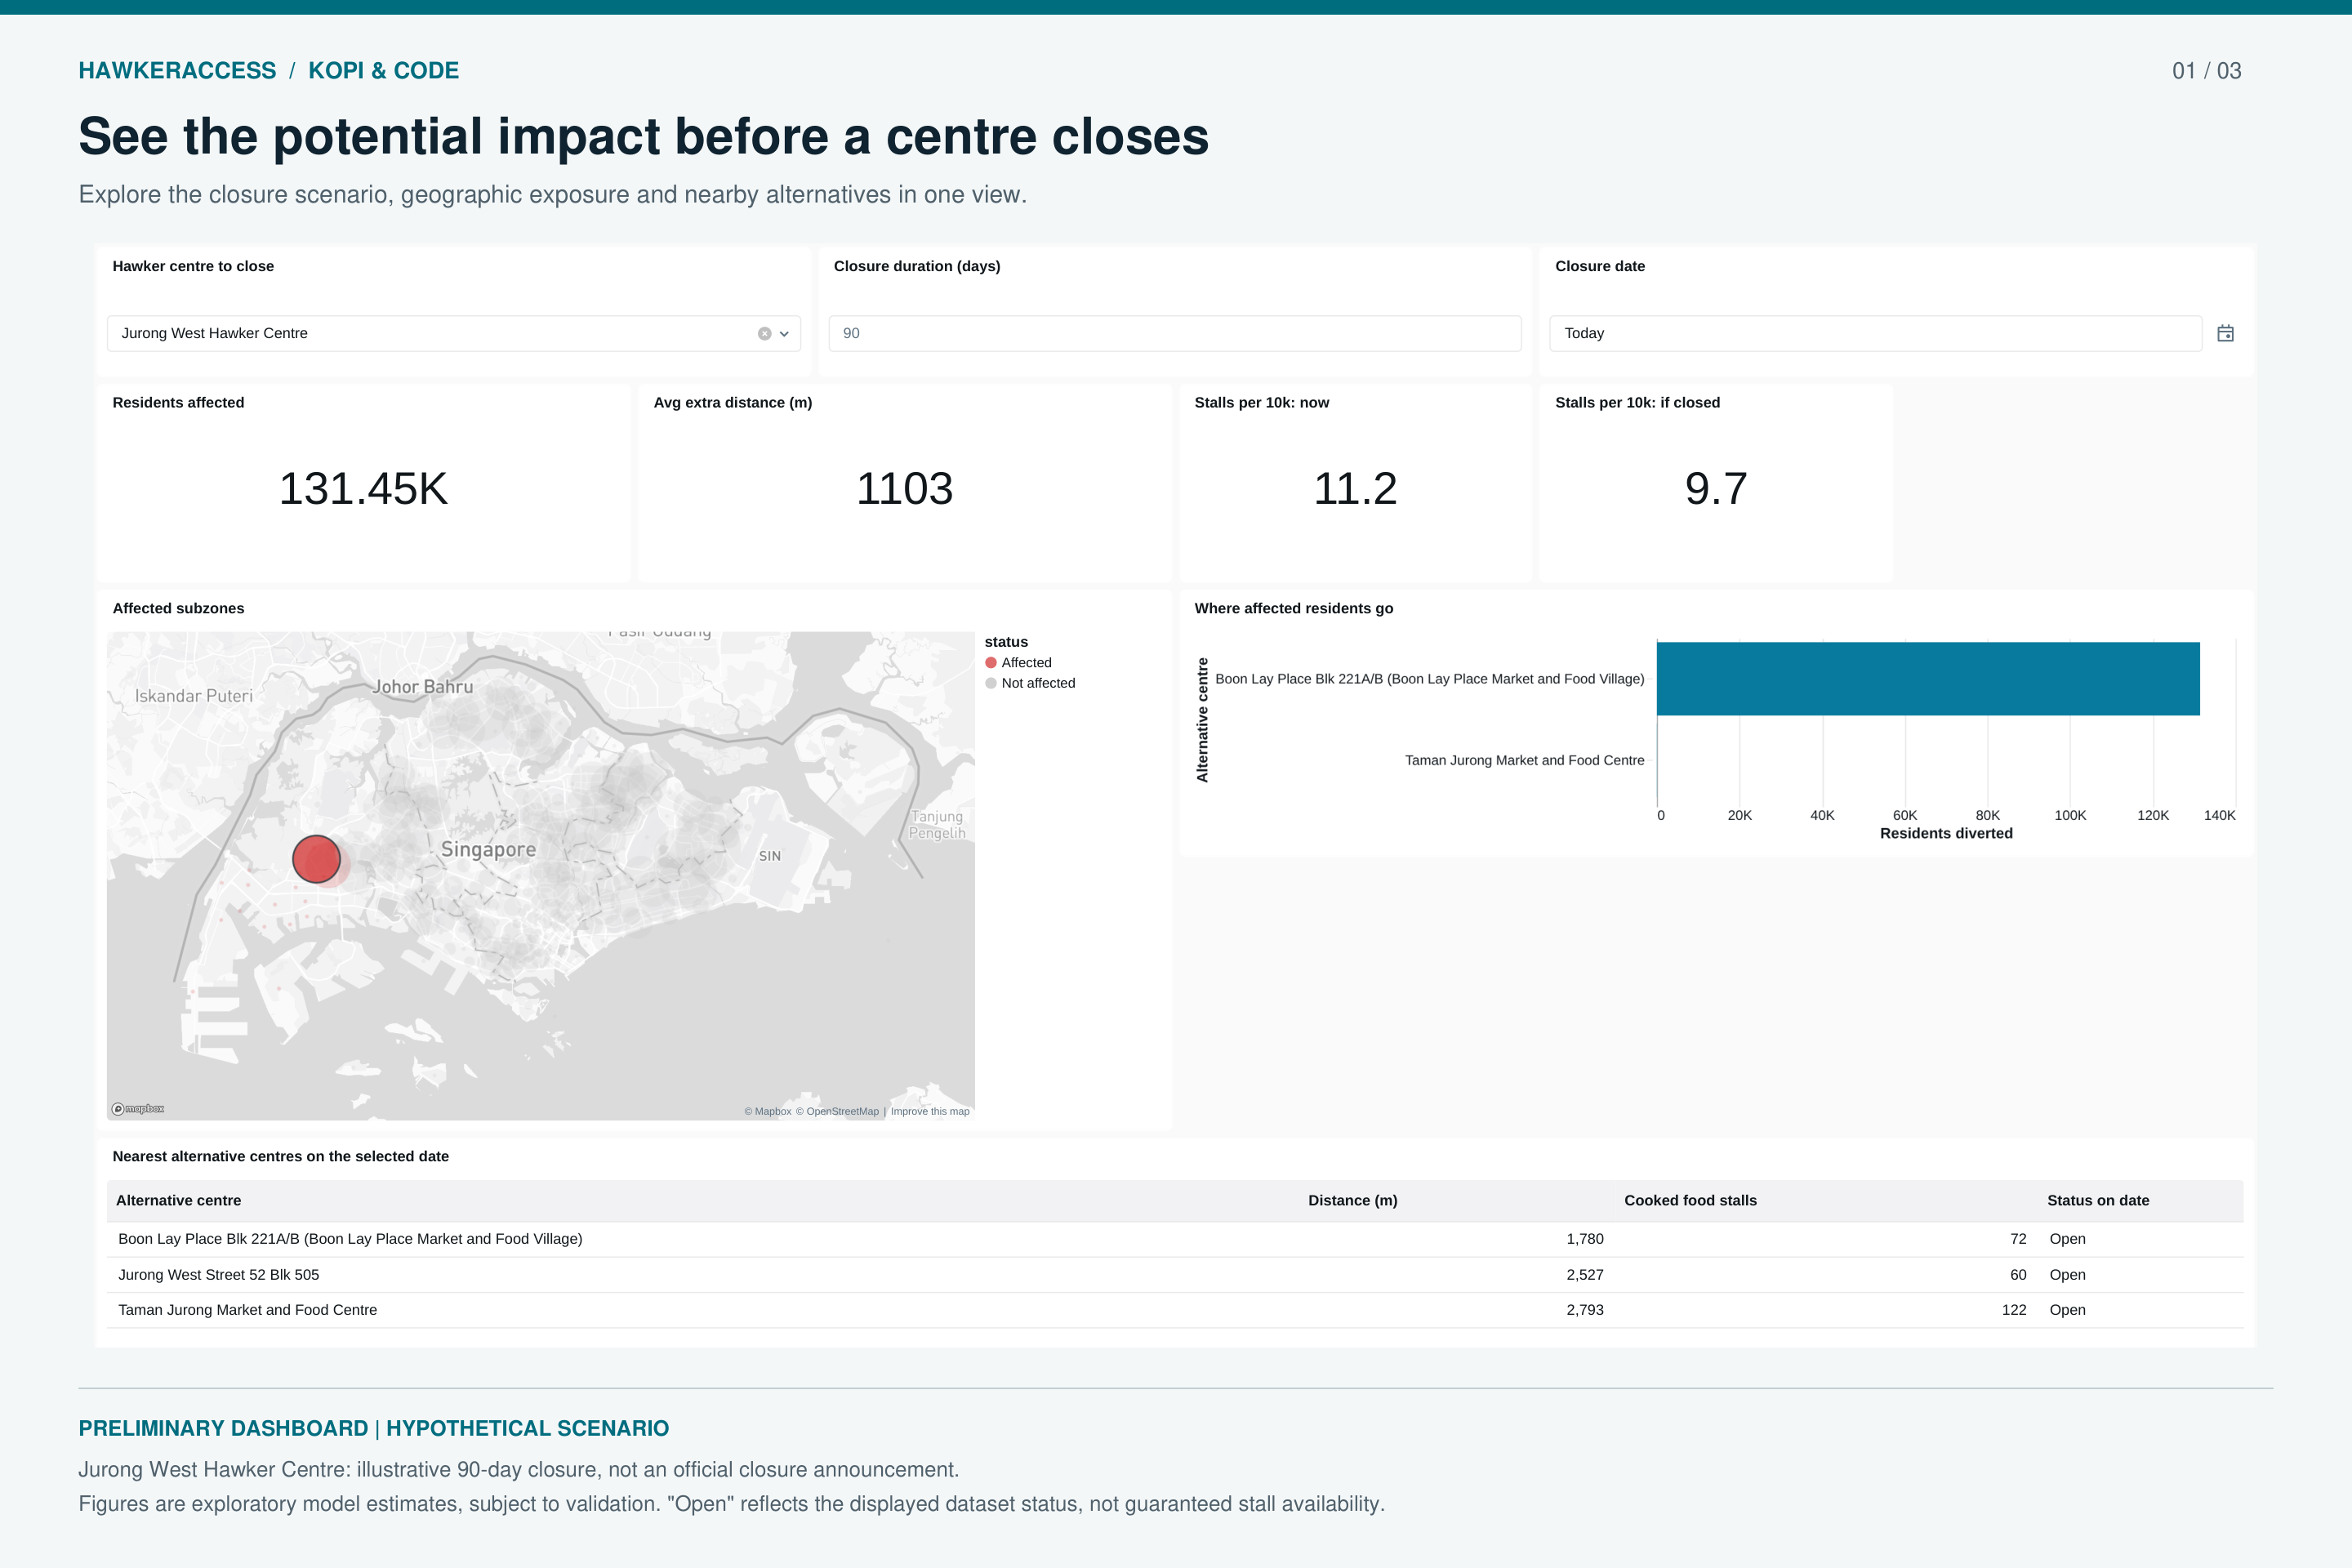
HawkerAccess is a proposed interactive geospatial dashboard for hawker centre managers and community planners.
Users select a centre and closure period to see how nearby access changes. The map compares a baseline with a simulated closure, showing which analysis locations lose a hawker centre within a chosen distance threshold. Users can examine the change in nearest-centre distance and find nearby alternatives.
The comparison uses the same date and assumptions for both scenarios. Only the selected centre’s closure status changes.
Where closure dates are flexible, planners can explore different dates. Where dates are fixed, they can use the results to prepare alternative dining information and decide which areas need further attention.
How we plan to build it
This is our Round 1 concept submission. We plan to build the working prototype during the two-week mentored sprint.
The proposal uses three public datasets:
- NEA Hawker Closure Schedule (2026), via data.gov.sg, for centre locations and scheduled cleaning and works closures.
- URA Planning Area Boundaries (2019), via data.gov.sg, for spatial matching and map display.
- SingStat Resident Population (Census 2020), via data.gov.sg, for planning-area population denominators.
We will stage CSV and GeoJSON files in Unity Catalog Volumes, then use Lakeflow Jobs to load the raw data into Bronze Delta tables.
Python and SQL notebooks will standardise dates and flag incomplete records. They will also turn closure schedules into structured events and assign centres to planning areas, producing Silver tables.
Gold tables will hold centres per 10,000 residents and the closure-scenario results. Distance calculations will use clearly defined analysis points so users can understand what each result represents.
A parameterised AI/BI dashboard will display the comparisons and nearby alternatives. We may use Databricks Apps for custom map interactions. Genie is an optional extension for questions about the curated results.
Unity Catalog will govern the data and tables so we can trace results back to their sources.
Challenges we anticipate
Distance needs careful interpretation. Our prototype will use straight-line distance, which does not account for walking routes or mobility barriers. It also cannot tell us about meal prices or individual stall opening hours.
A centre with no recorded scheduled closure is not necessarily operating. We will make that distinction clear. The analysis covers listed hawker centres, excludes other dining venues, and includes nearby centres across planning-area boundaries.
The population data also has a different reference year from the centre data. Combining the 2026 inventory with Census 2020 population gives us a historical population baseline. We will label the years and use population figures only at their supported geographic level. Estimating how many residents are affected within a smaller catchment would require more detailed data or explicit assumptions.
Accomplishments that we're proud of
We have narrowed the project to a planning decision we can demonstrate within two weeks and identified candidate public datasets for it.
Working through the Adam Road example helped us catch an important distinction: the distance between two centres does not tell us how far each resident would need to travel. That has shaped our choice of metrics and how we will explain them.
Our planned demonstration covers one selected area and its surroundings, using a verified scheduled closure to compare nearby access with and without that closure.
What we learned
Food provision and proximity measure different things. A planning area may have several centres relative to its population while some locations within it are still far from the nearest one.
We will use centres per 10,000 residents to describe area-level provision, then examine distance and coverage to understand a specific closure. Keeping those measures separate should make the results easier to interpret.
The closure schedule also gives planners time to respond. Our dashboard needs to help them use that time to assess alternatives and prepare local guidance.
What's next for HawkerAccess
During the sprint, we will build the data pipeline and map, followed by the closure simulation and nearby-alternative view for our selected area.
We will measure the change in nearest-centre distance and count analysis locations that lose coverage within a stated threshold. Testing several thresholds will help us understand how much the results depend on that choice.
Where alternative closure dates are feasible, we will compare their modelled disruption. We will report any improvement as a scenario result. Assessing real-world benefits will require later validation with centre managers and community organisations.

Log in or sign up for Devpost to join the conversation.