-
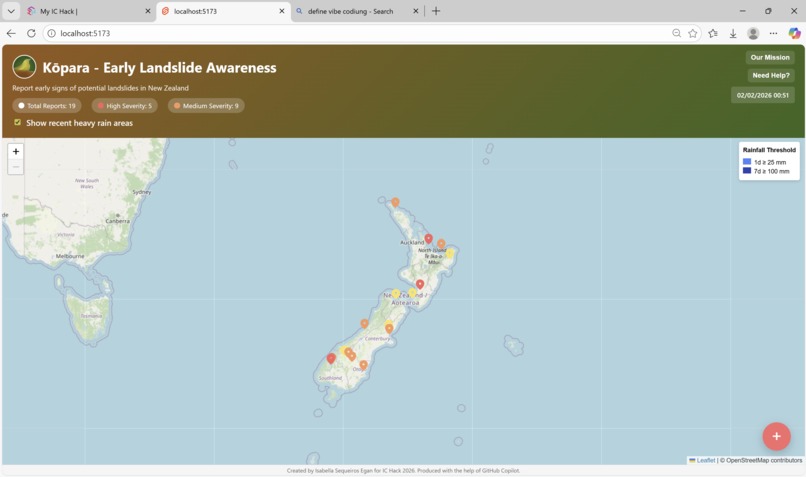
Main interface
-
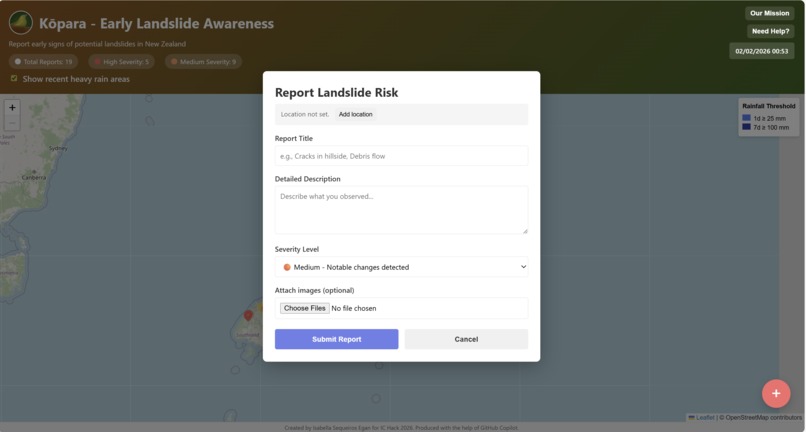
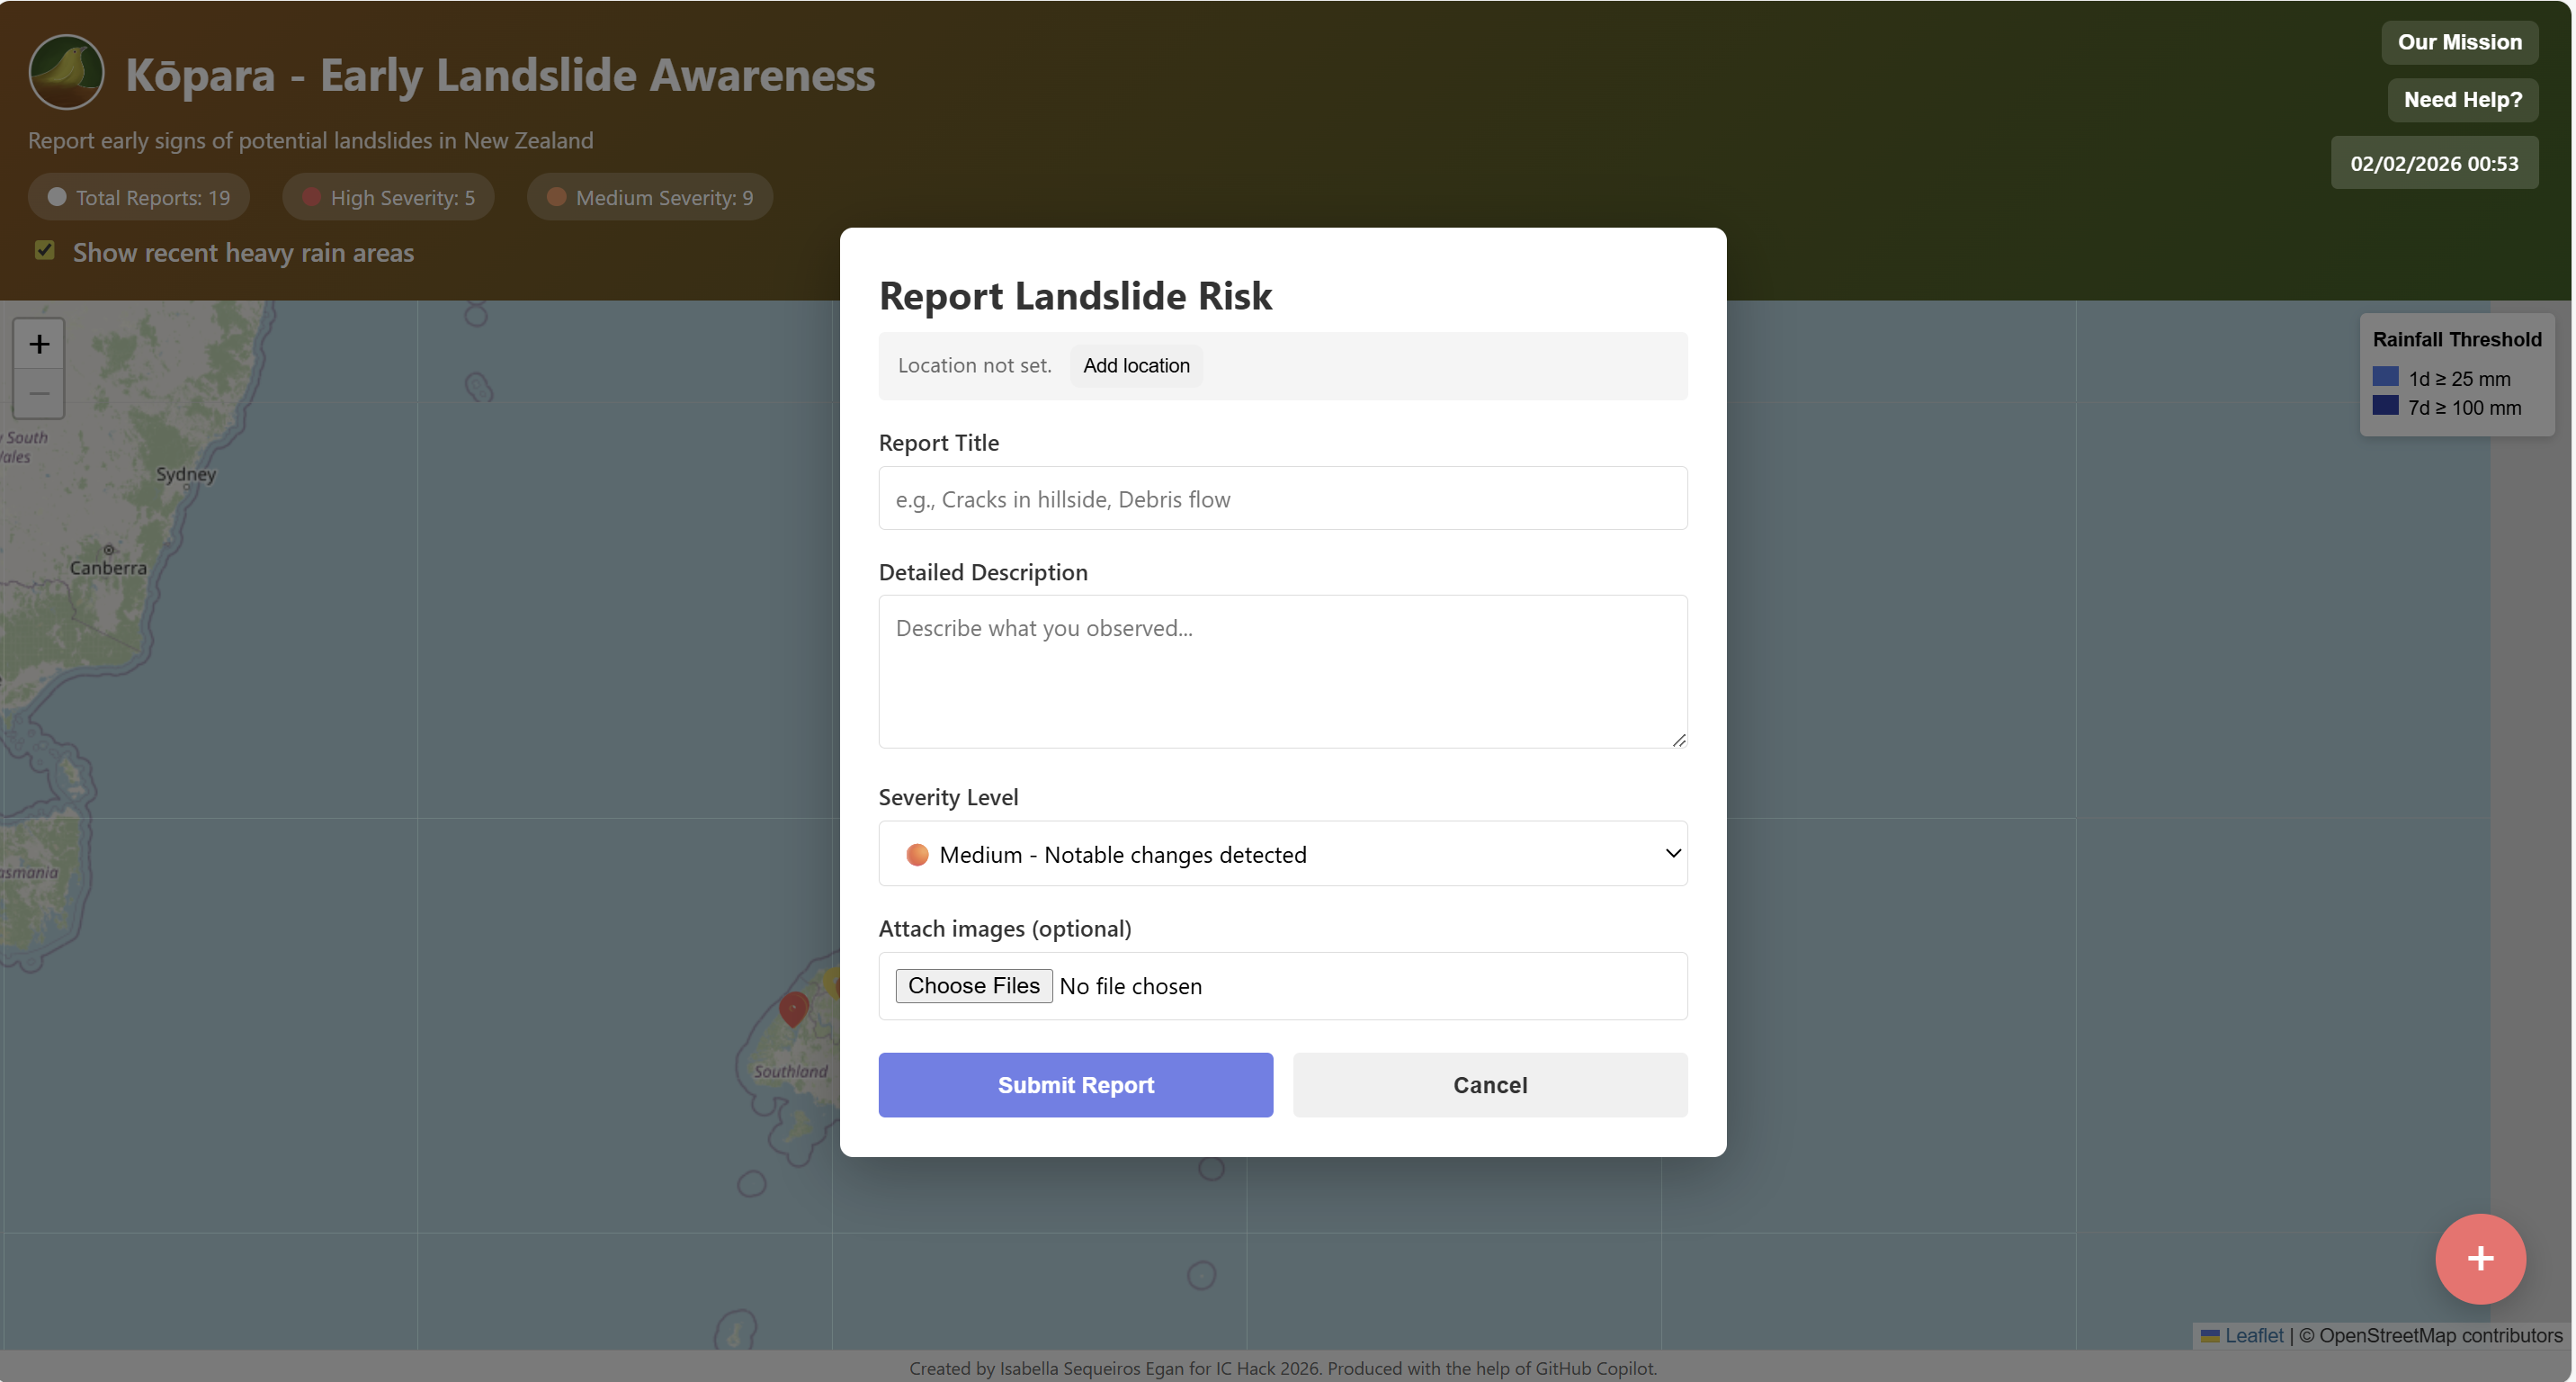
Enter report details
-
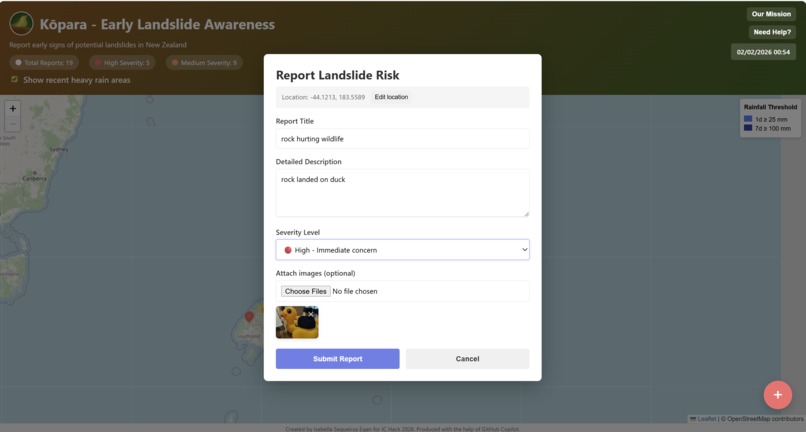
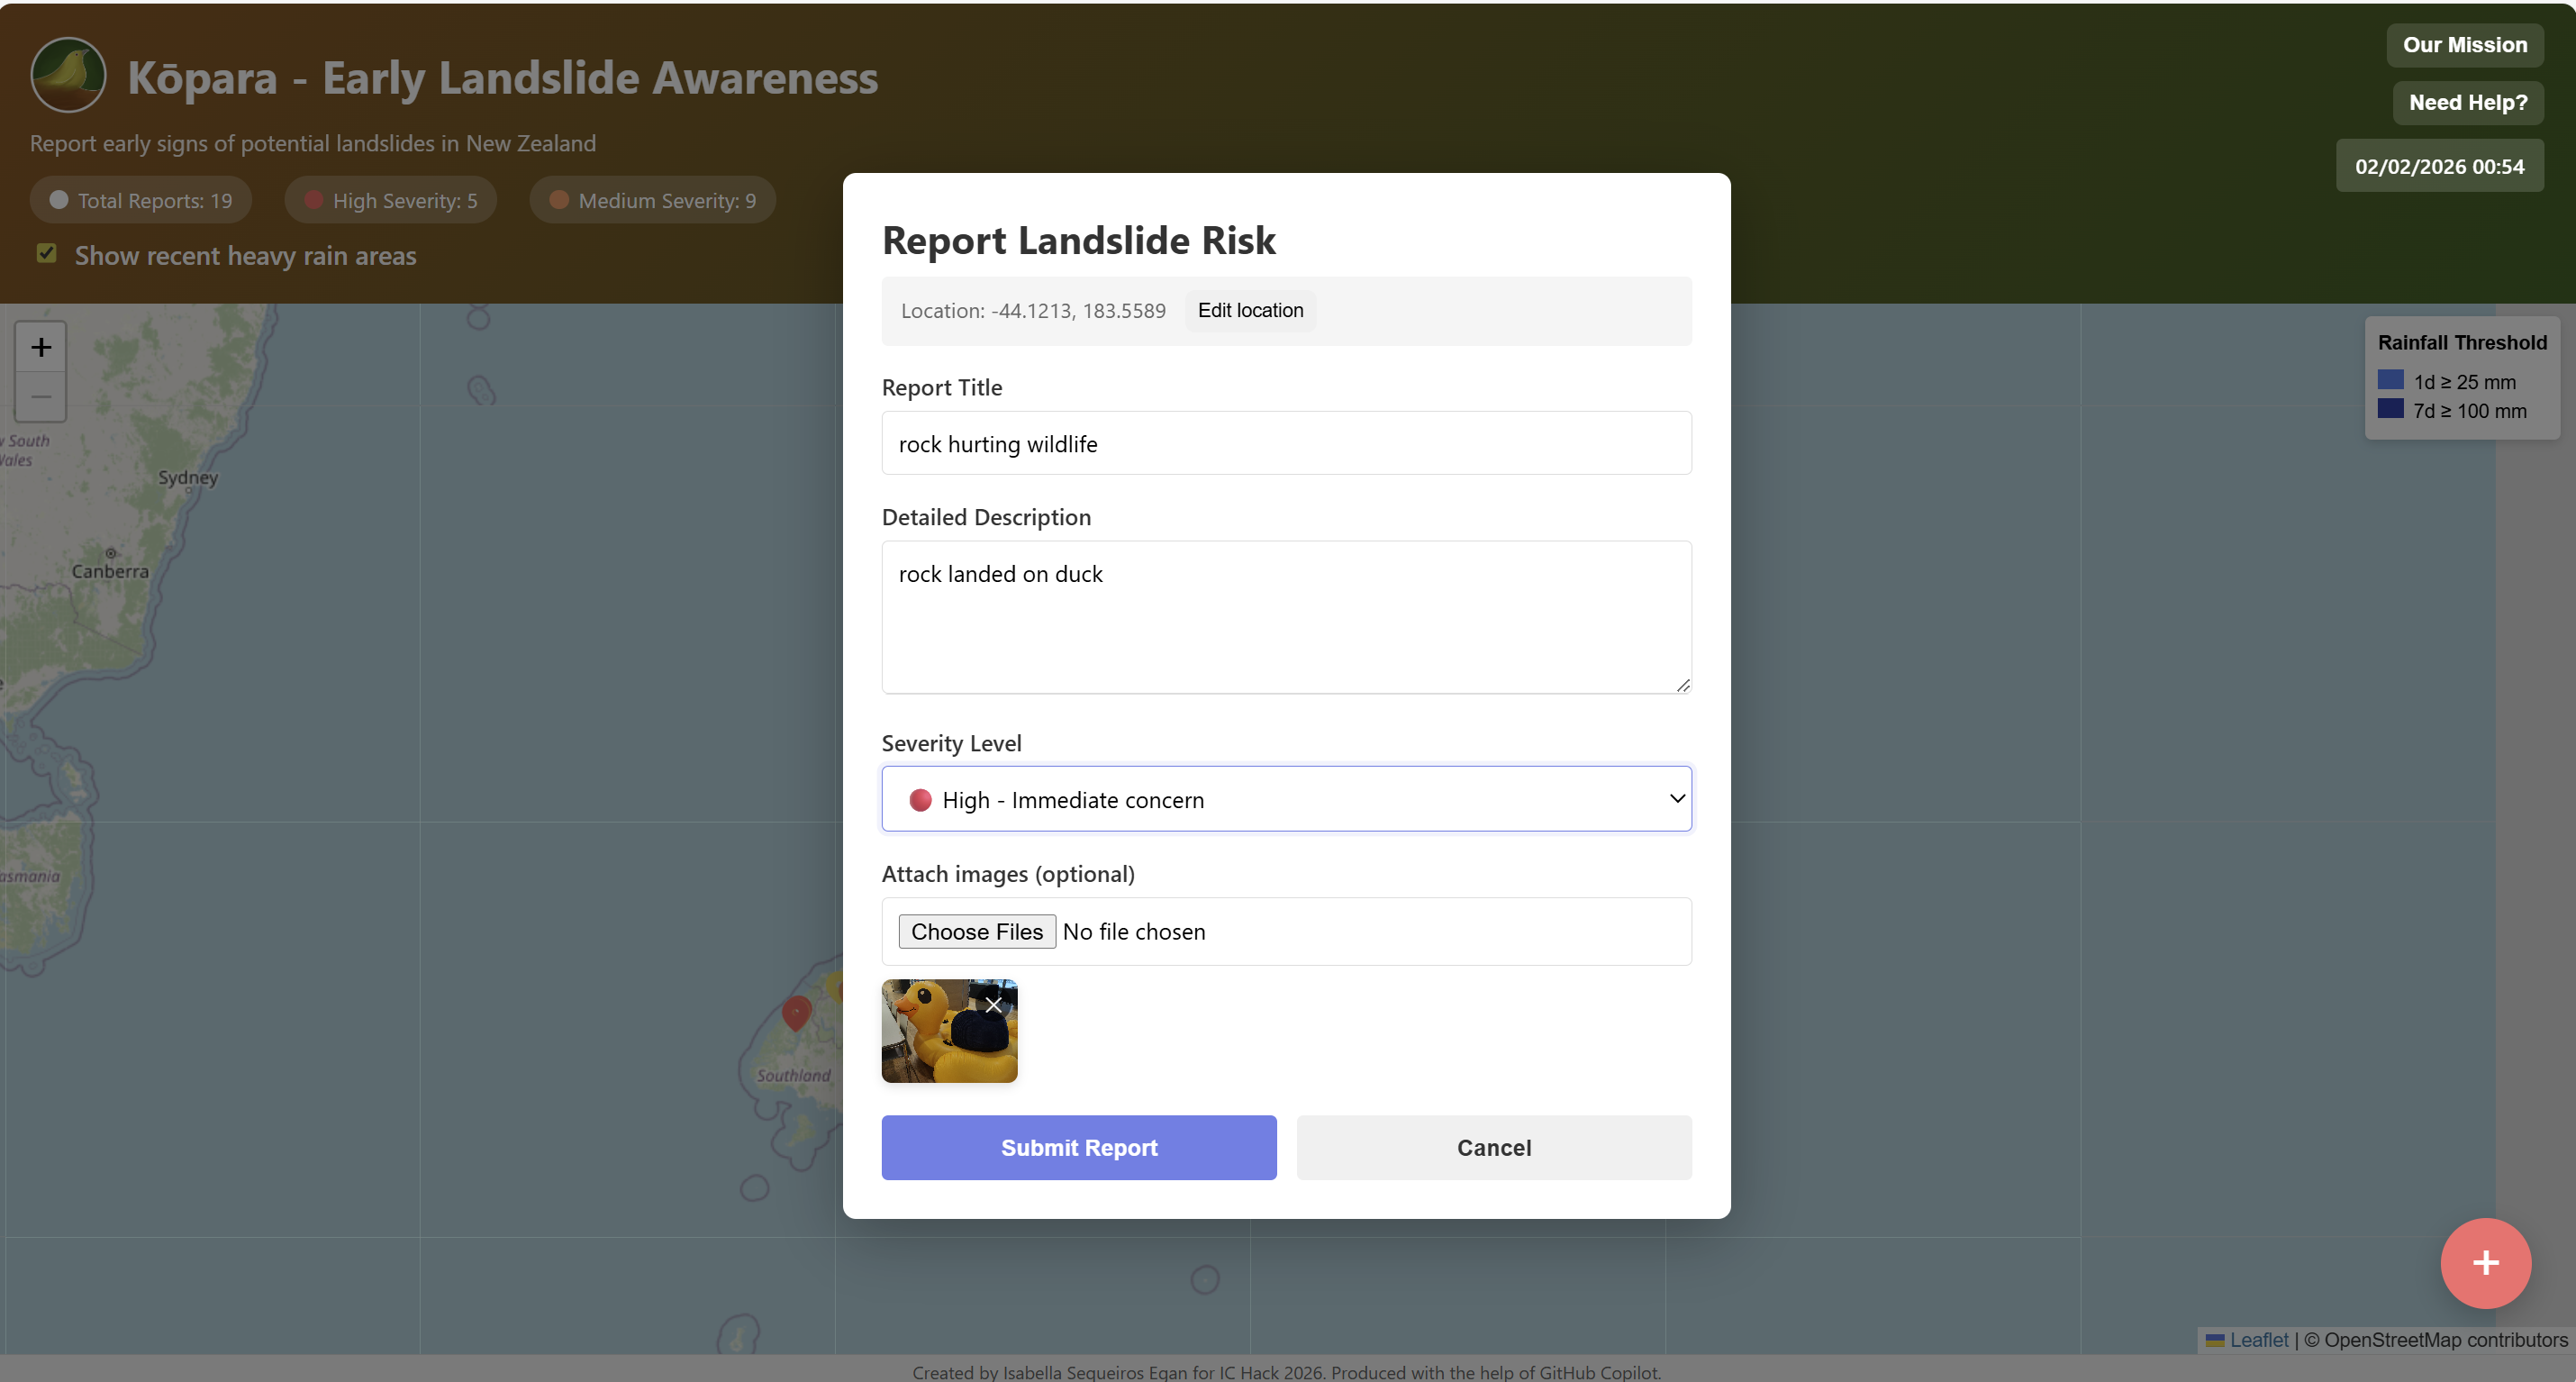
Enter report details and picture
-
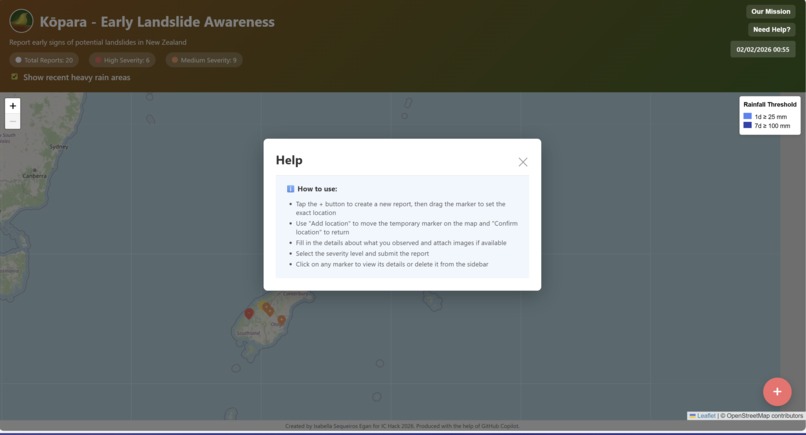
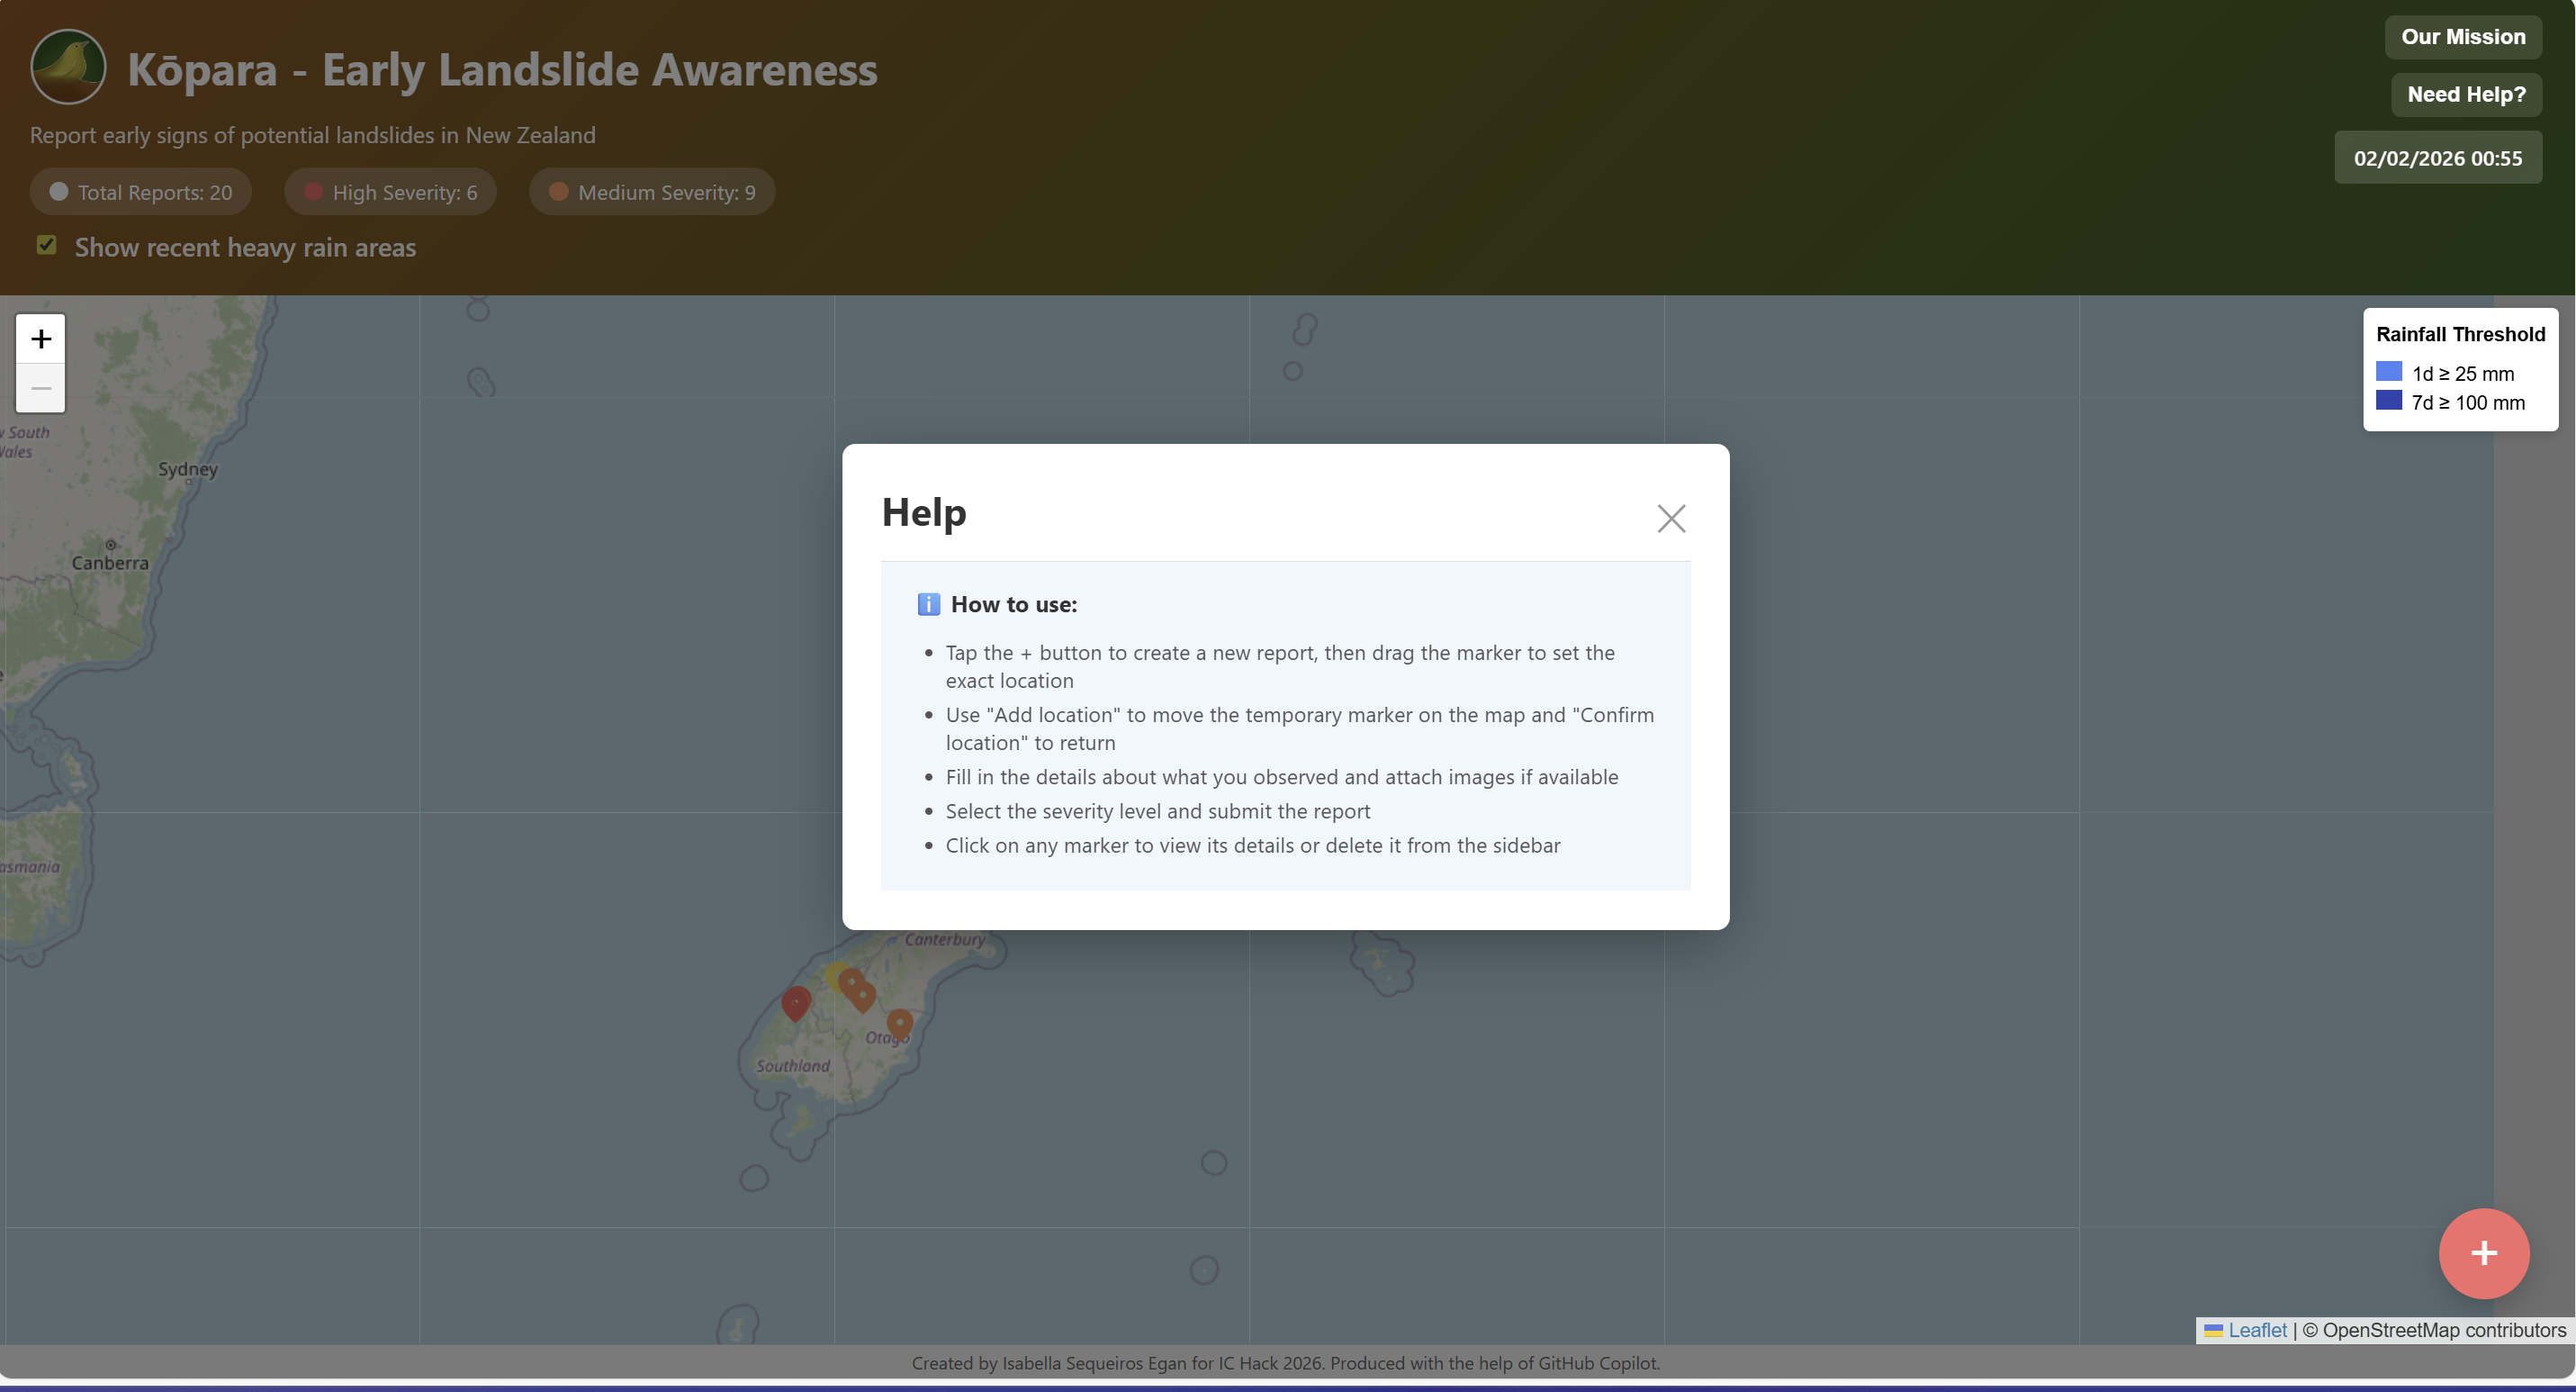
If you click Need Help?
-
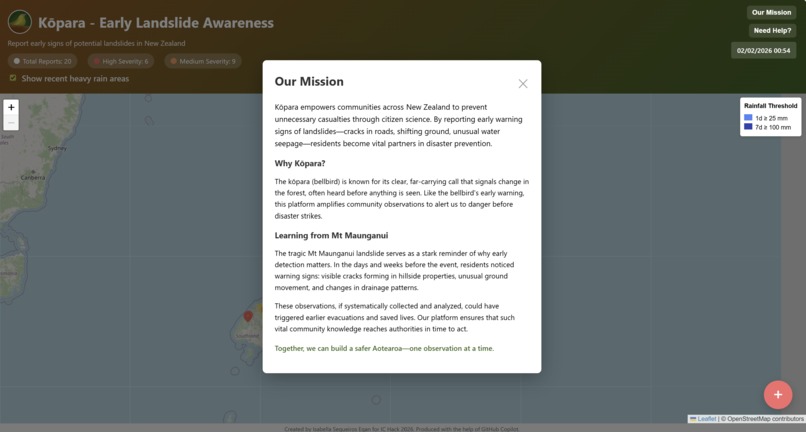
Our mission
-
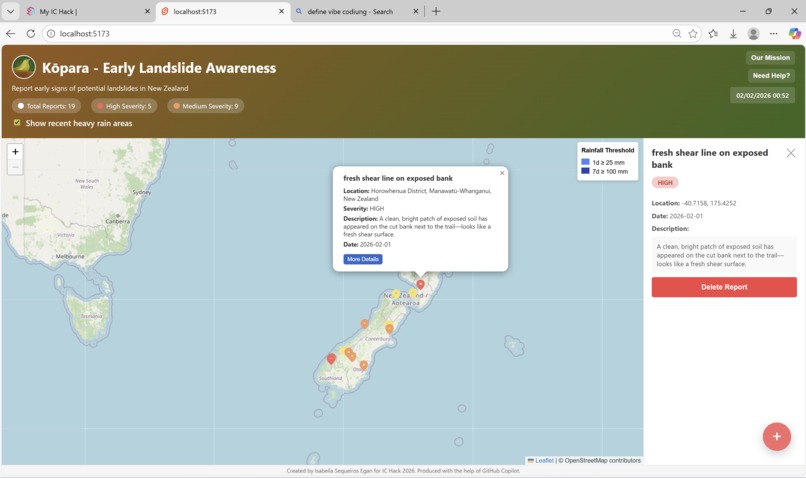
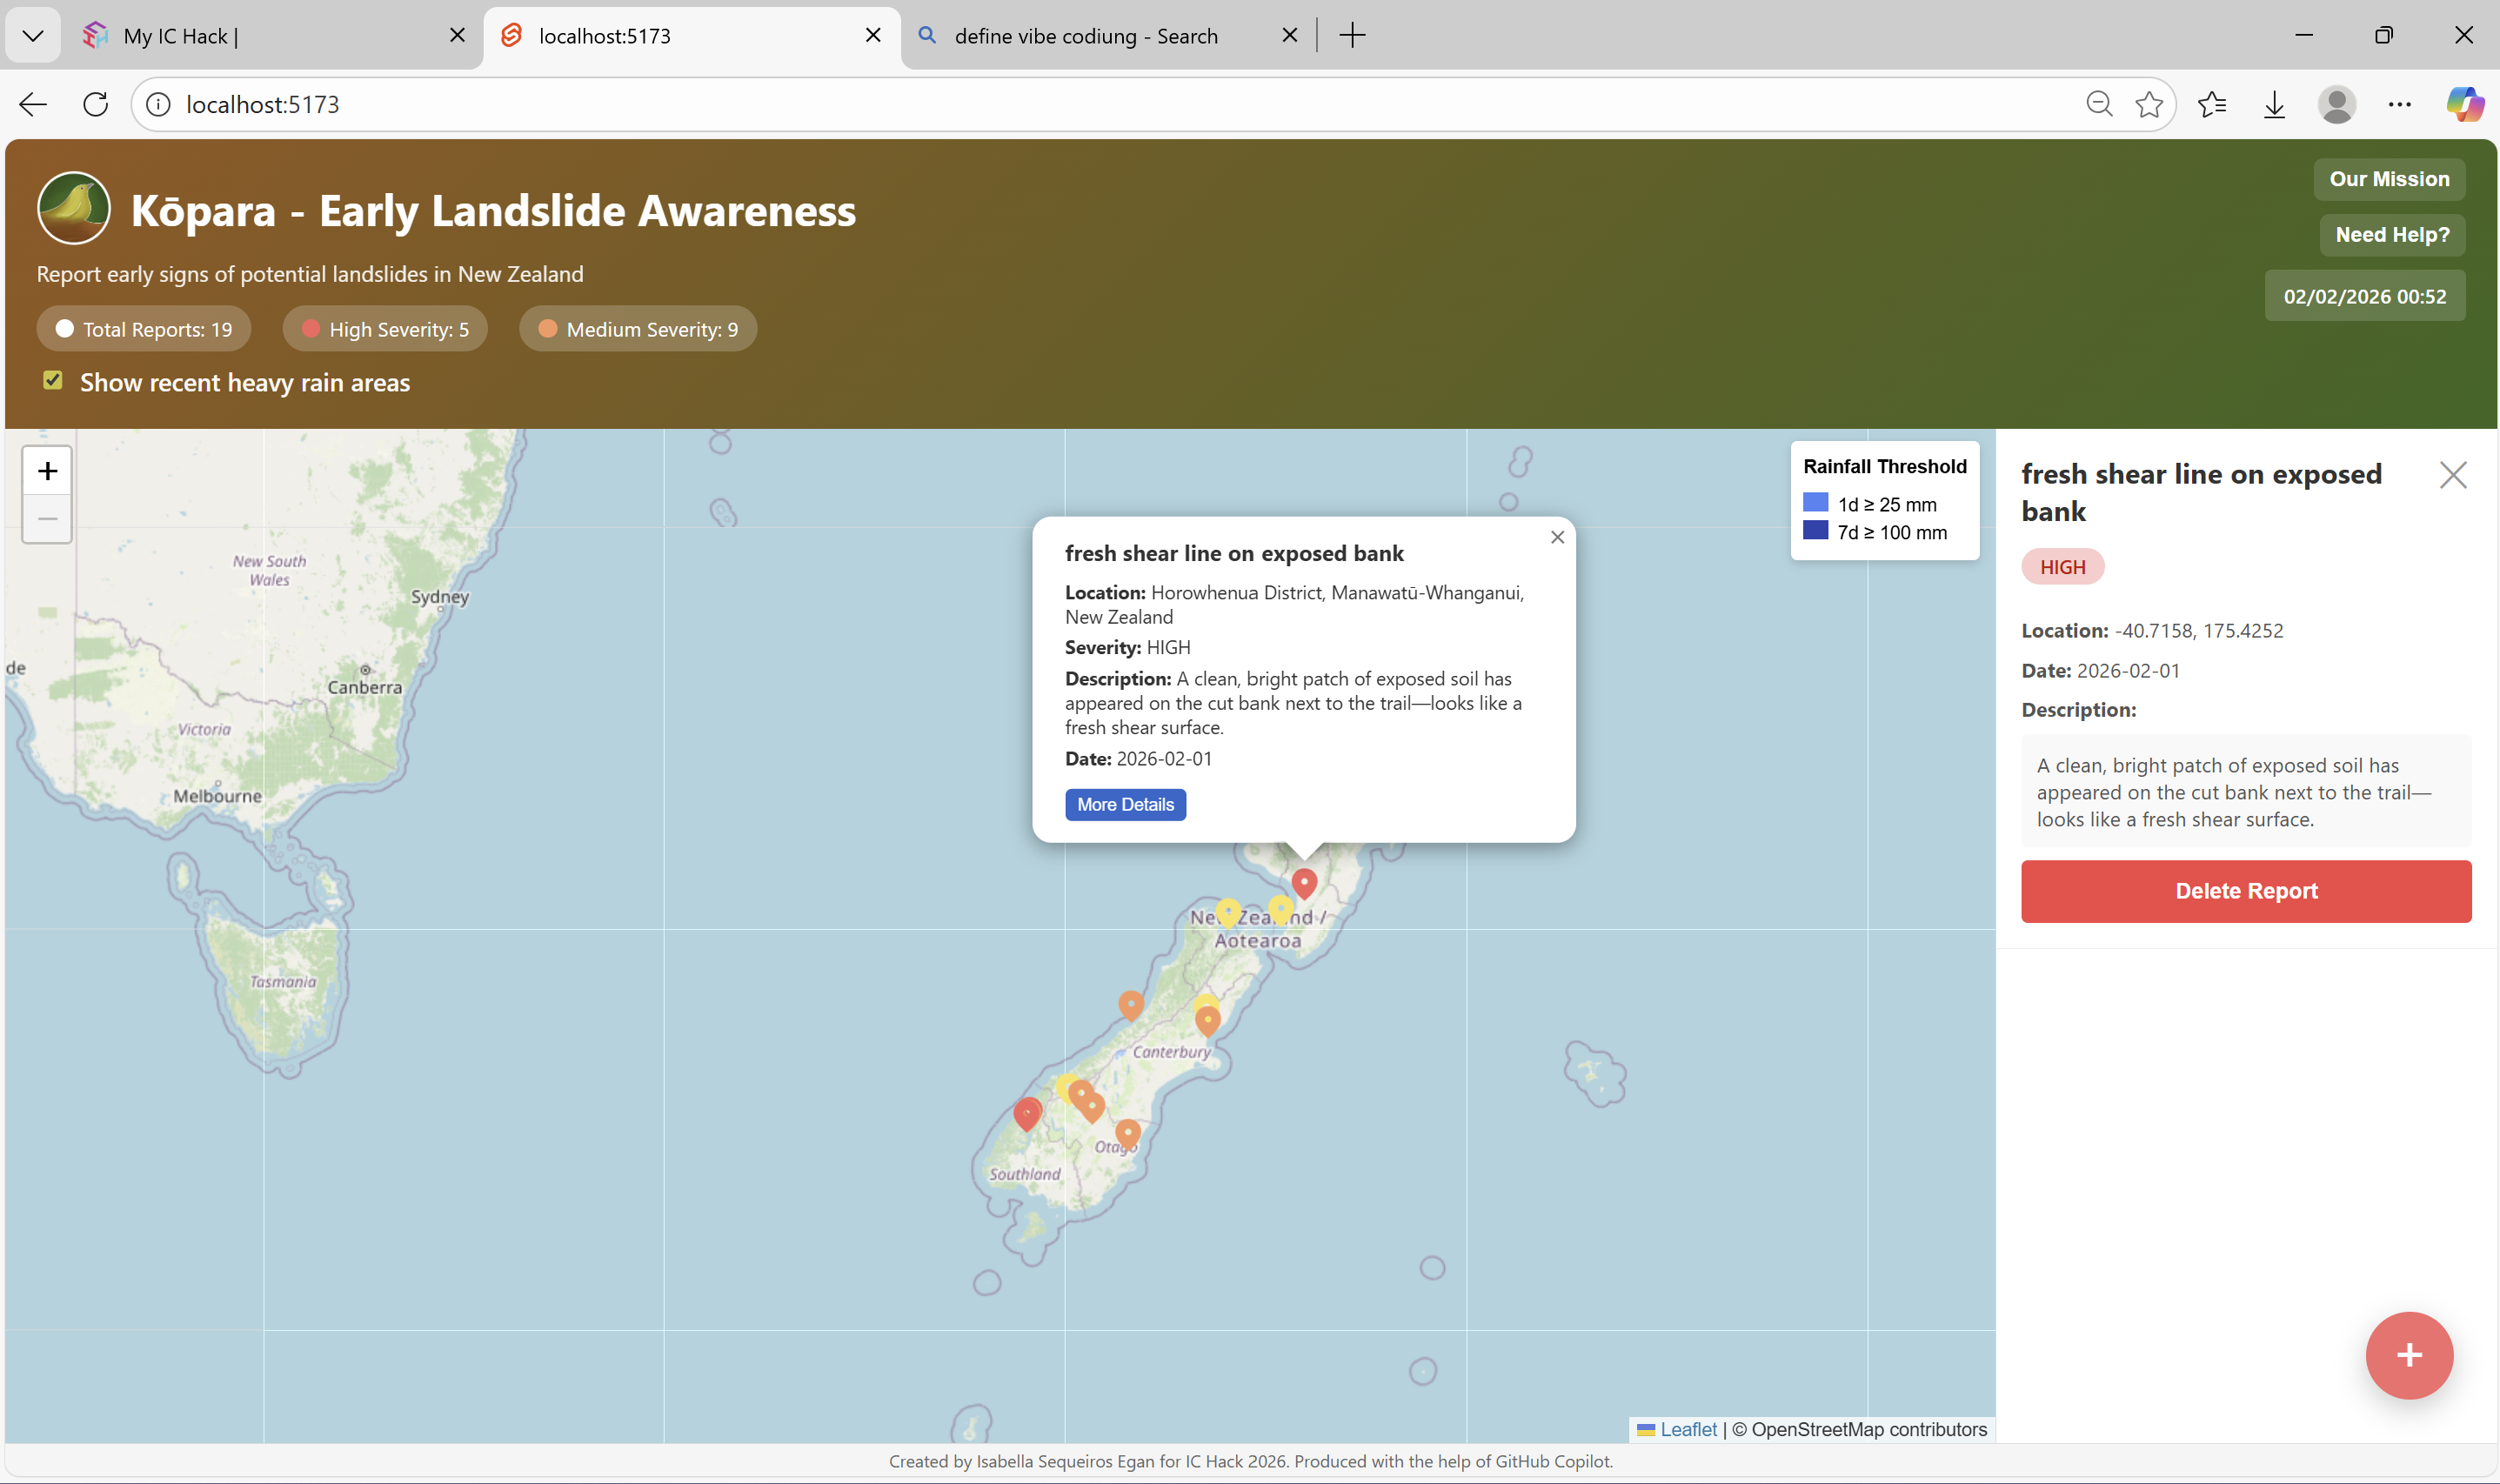
Looking at a previously reported alert


Inspiration
Our project, Kōpara, was inspired by the devastating landslides that occurred across the Bay of Plenty during the January 2026 storms. These events showed how small early warning signs often appear long before a major slope failure - cracks, tilted trees, pooling water - yet ordinary people have no simple way to report what they see. We wanted to create a tool that empowers communities to collectively surface these micro‑signals, helping protect both ecosystems and people.
What it does
Kōpara is a minimalistic citizen‑science app that lets anyone quickly report early signs of slope instability. Users tap the map, add a short description, choose a severity level, and submit. The map then displays these sightings as pins across Aotearoa, creating a shared, real‑time picture of subtle environmental shifts. No predictions, no modelling — just the simplest possible way to turn individual observations into collective insight.
How we built it
We built Kōpara using Svelte for the front end and Leaflet for the interactive New Zealand map. We used a lot of vibe coding with GitHub Co-pilot and manually tweaking things in order to have it look and act the way we wanted.
Challenges we ran into
As using Svelte was entirely new to me, there was a steep learning curve and I had particular issue with the rainfall threshold function, which after all the struggle of using the API stopped working an hour before the deadline, likely due to it turning midnight in New Zealand and that affecting the 24 hour reading. (7 day didn't show anything at any point - likely as it's summer). But the 24 hours was working (I promise)!
Accomplishments that we're proud of
I am proud of the general interface, it's easy to use and understand. I also hand-drew the logo for this and I do truly believe that such a website/app would really benefit New Zealand
What we learned
Throughout building Kōpara, we learned how to transform ideas into a functional, user‑friendly tool. We picked up vibe‑coding skills — rapidly prototyping features based on feel rather than over‑engineering — and learned how to work with APIs to store and retrieve data cleanly. We also became comfortable using VS Code as a full development environment, from extension tooling to live debugging. Most importantly, we learned how to build a real user interface from scratch, designing interactions that feel simple, smooth, and intuitive while keeping the entire project aligned with the principle of radical simplicity.
What's next for Kopara
Next, we want to refine Kōpara so it becomes even more useful while staying true to its simple core. Our priority is to shift the 24‑hour filter into a true rolling 24‑hour window, ensuring that recent reports always reflect live conditions rather than resetting at midnight. We also plan to experiment with a lightweight risk metric that blends historic landslide data with basic elevation indicators—just enough to help users understand context without introducing unnecessary complexity. Another step is to connect the app to New Zealand’s emergency alert infrastructure, so if a local or national state of emergency is declared, Kōpara can reflect that instantly and give users clearer situational awareness. Finally, we hope to seek funding and support from the New Zealand government to continue developing the platform, improve data integration, and explore partnerships with conservation, hazard monitoring, and civil defence teams.
Built With
- leaflet.js
- meteo
- svelte

Log in or sign up for Devpost to join the conversation.