-
-
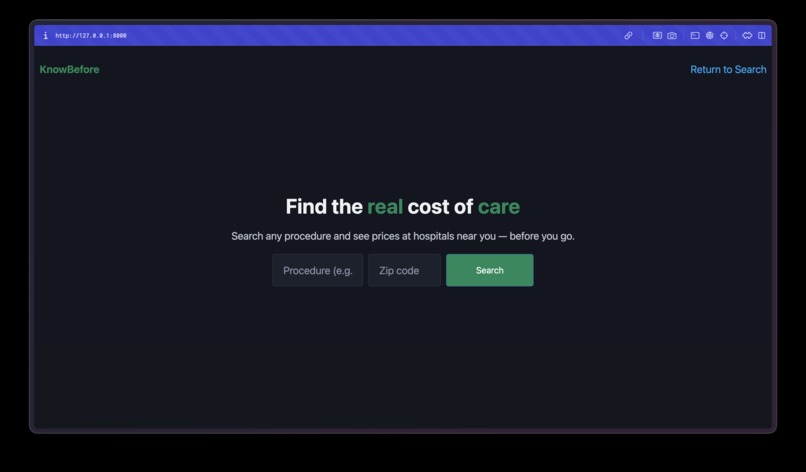
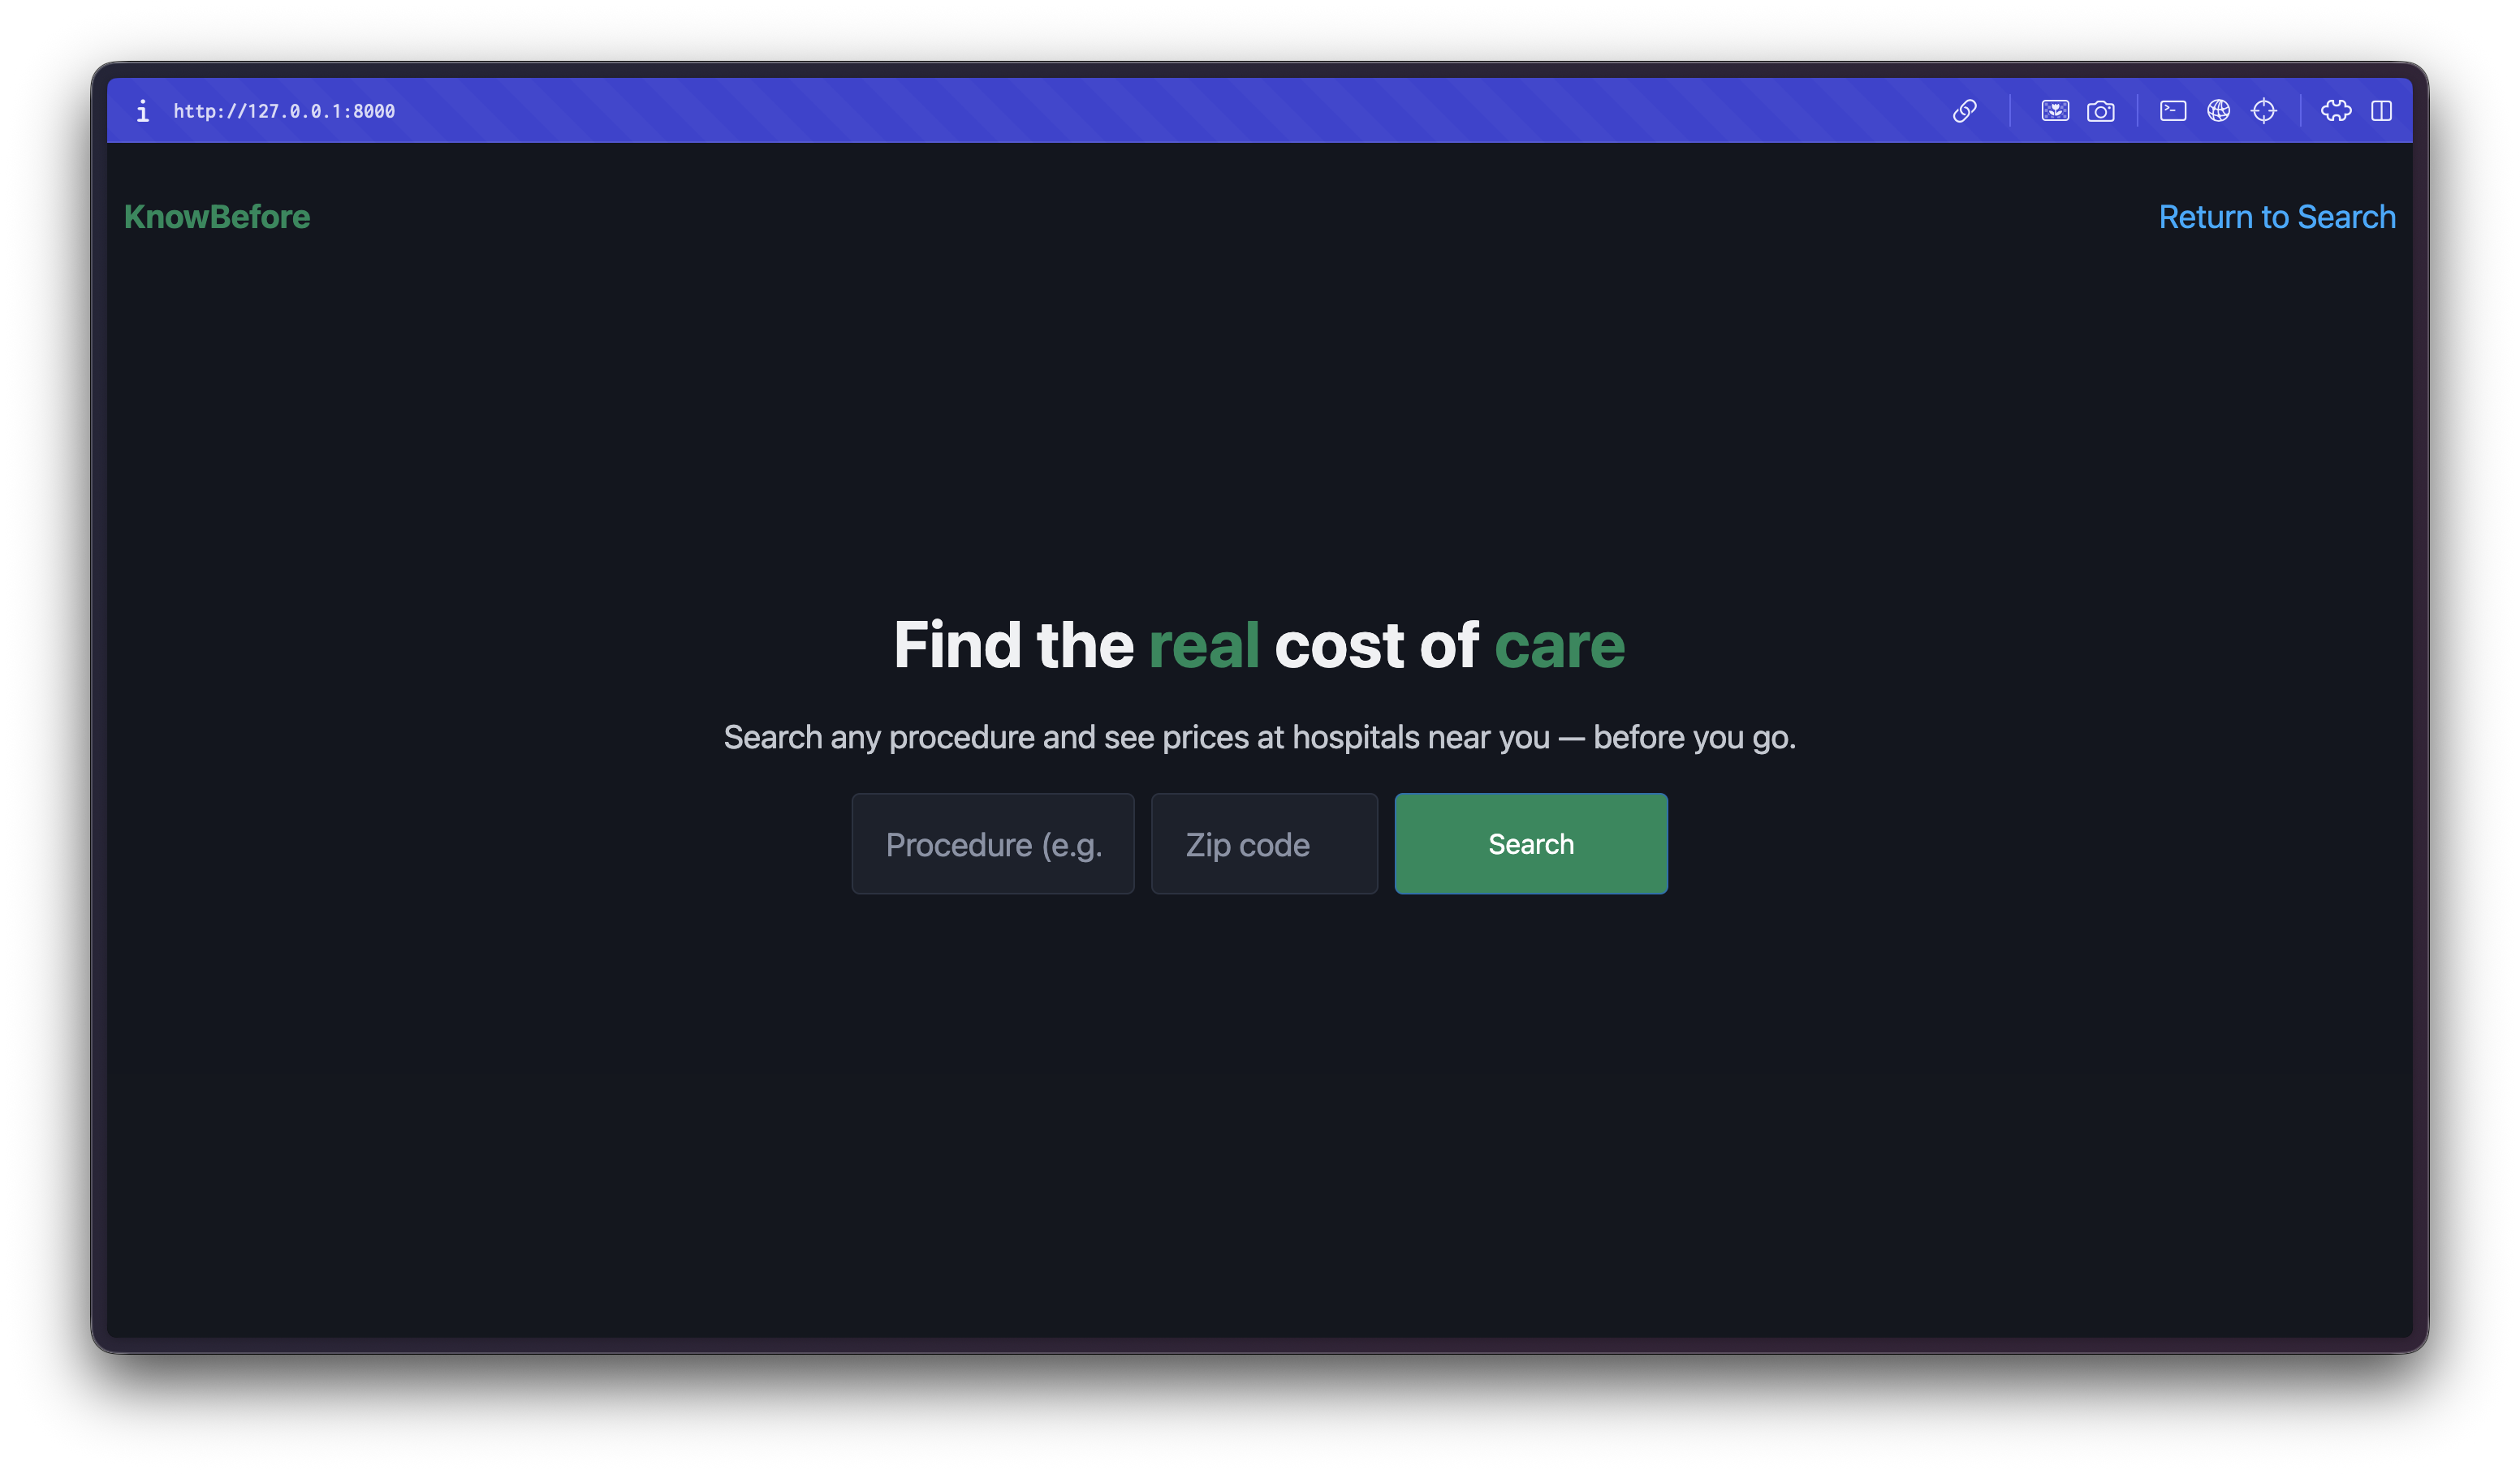
Dark Mode
-
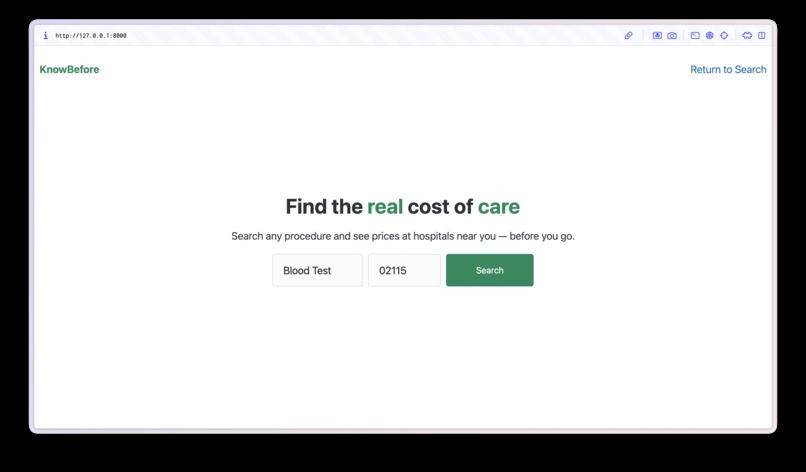
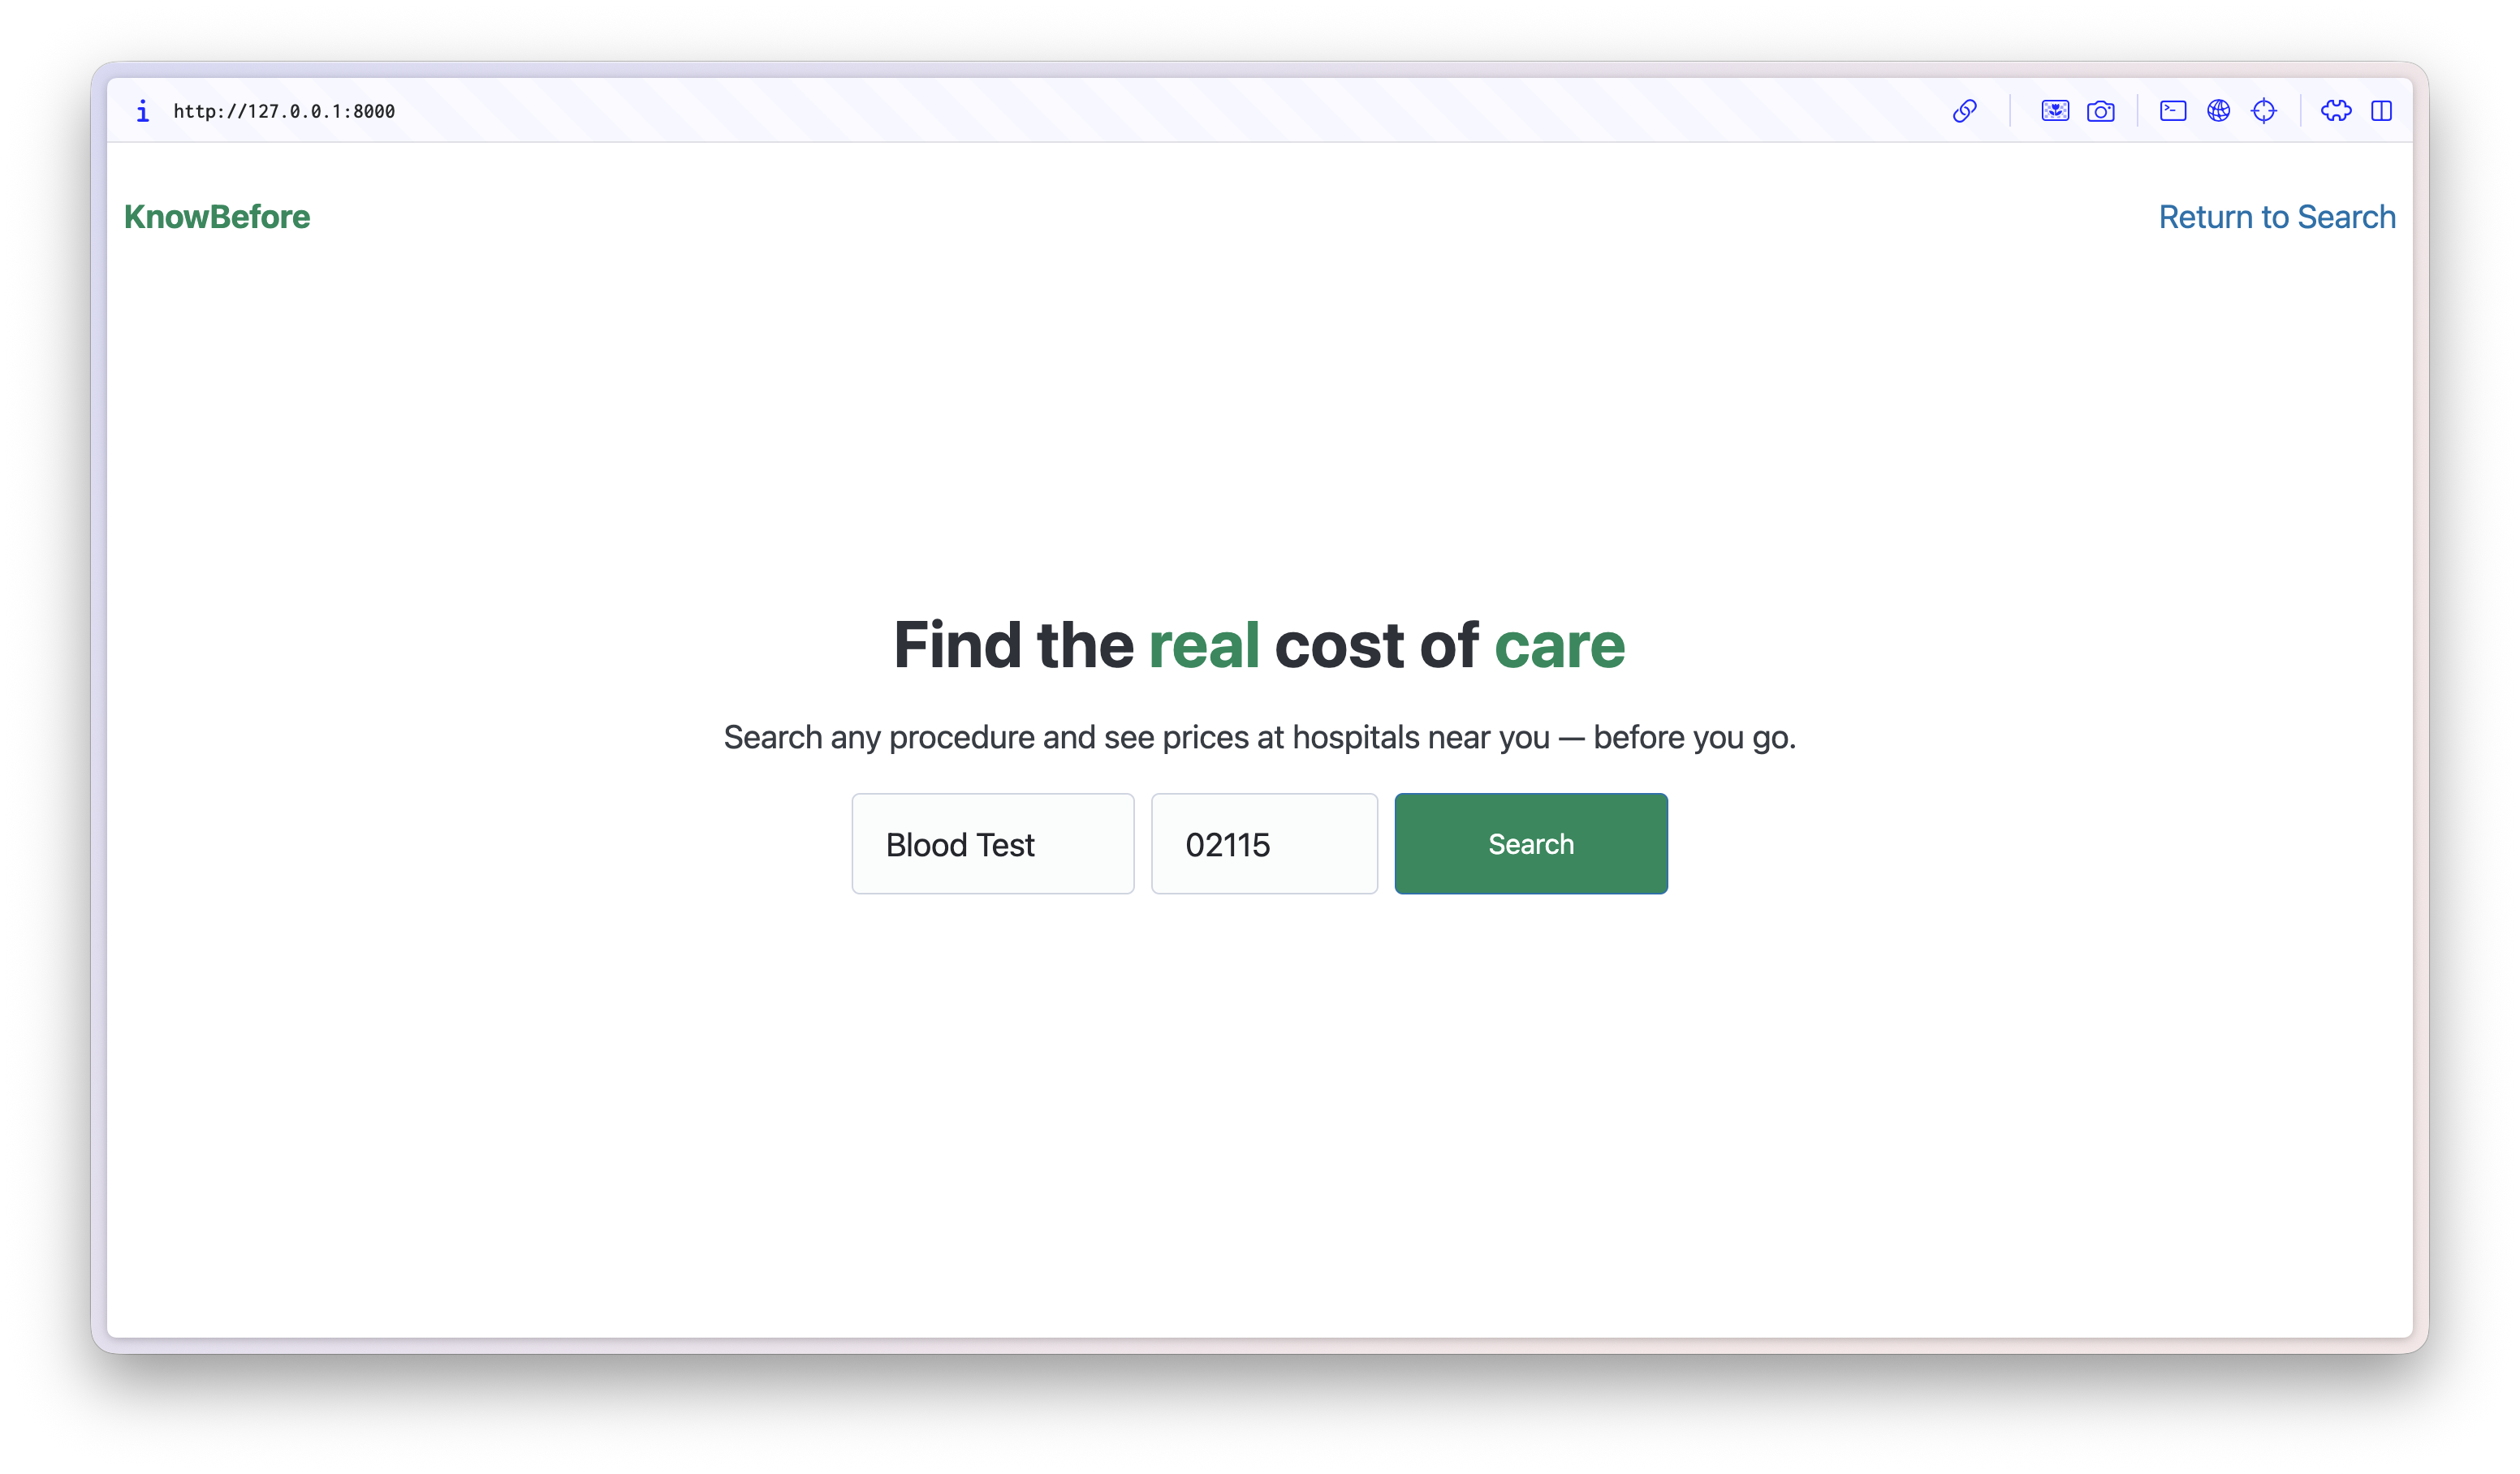
Light Mode
-
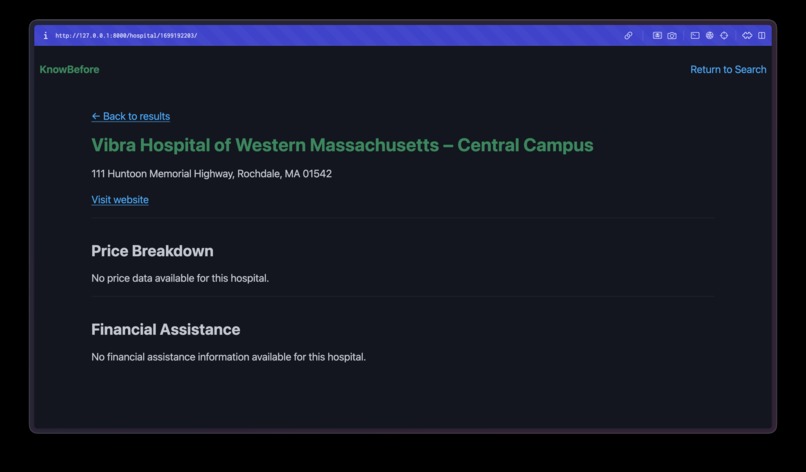
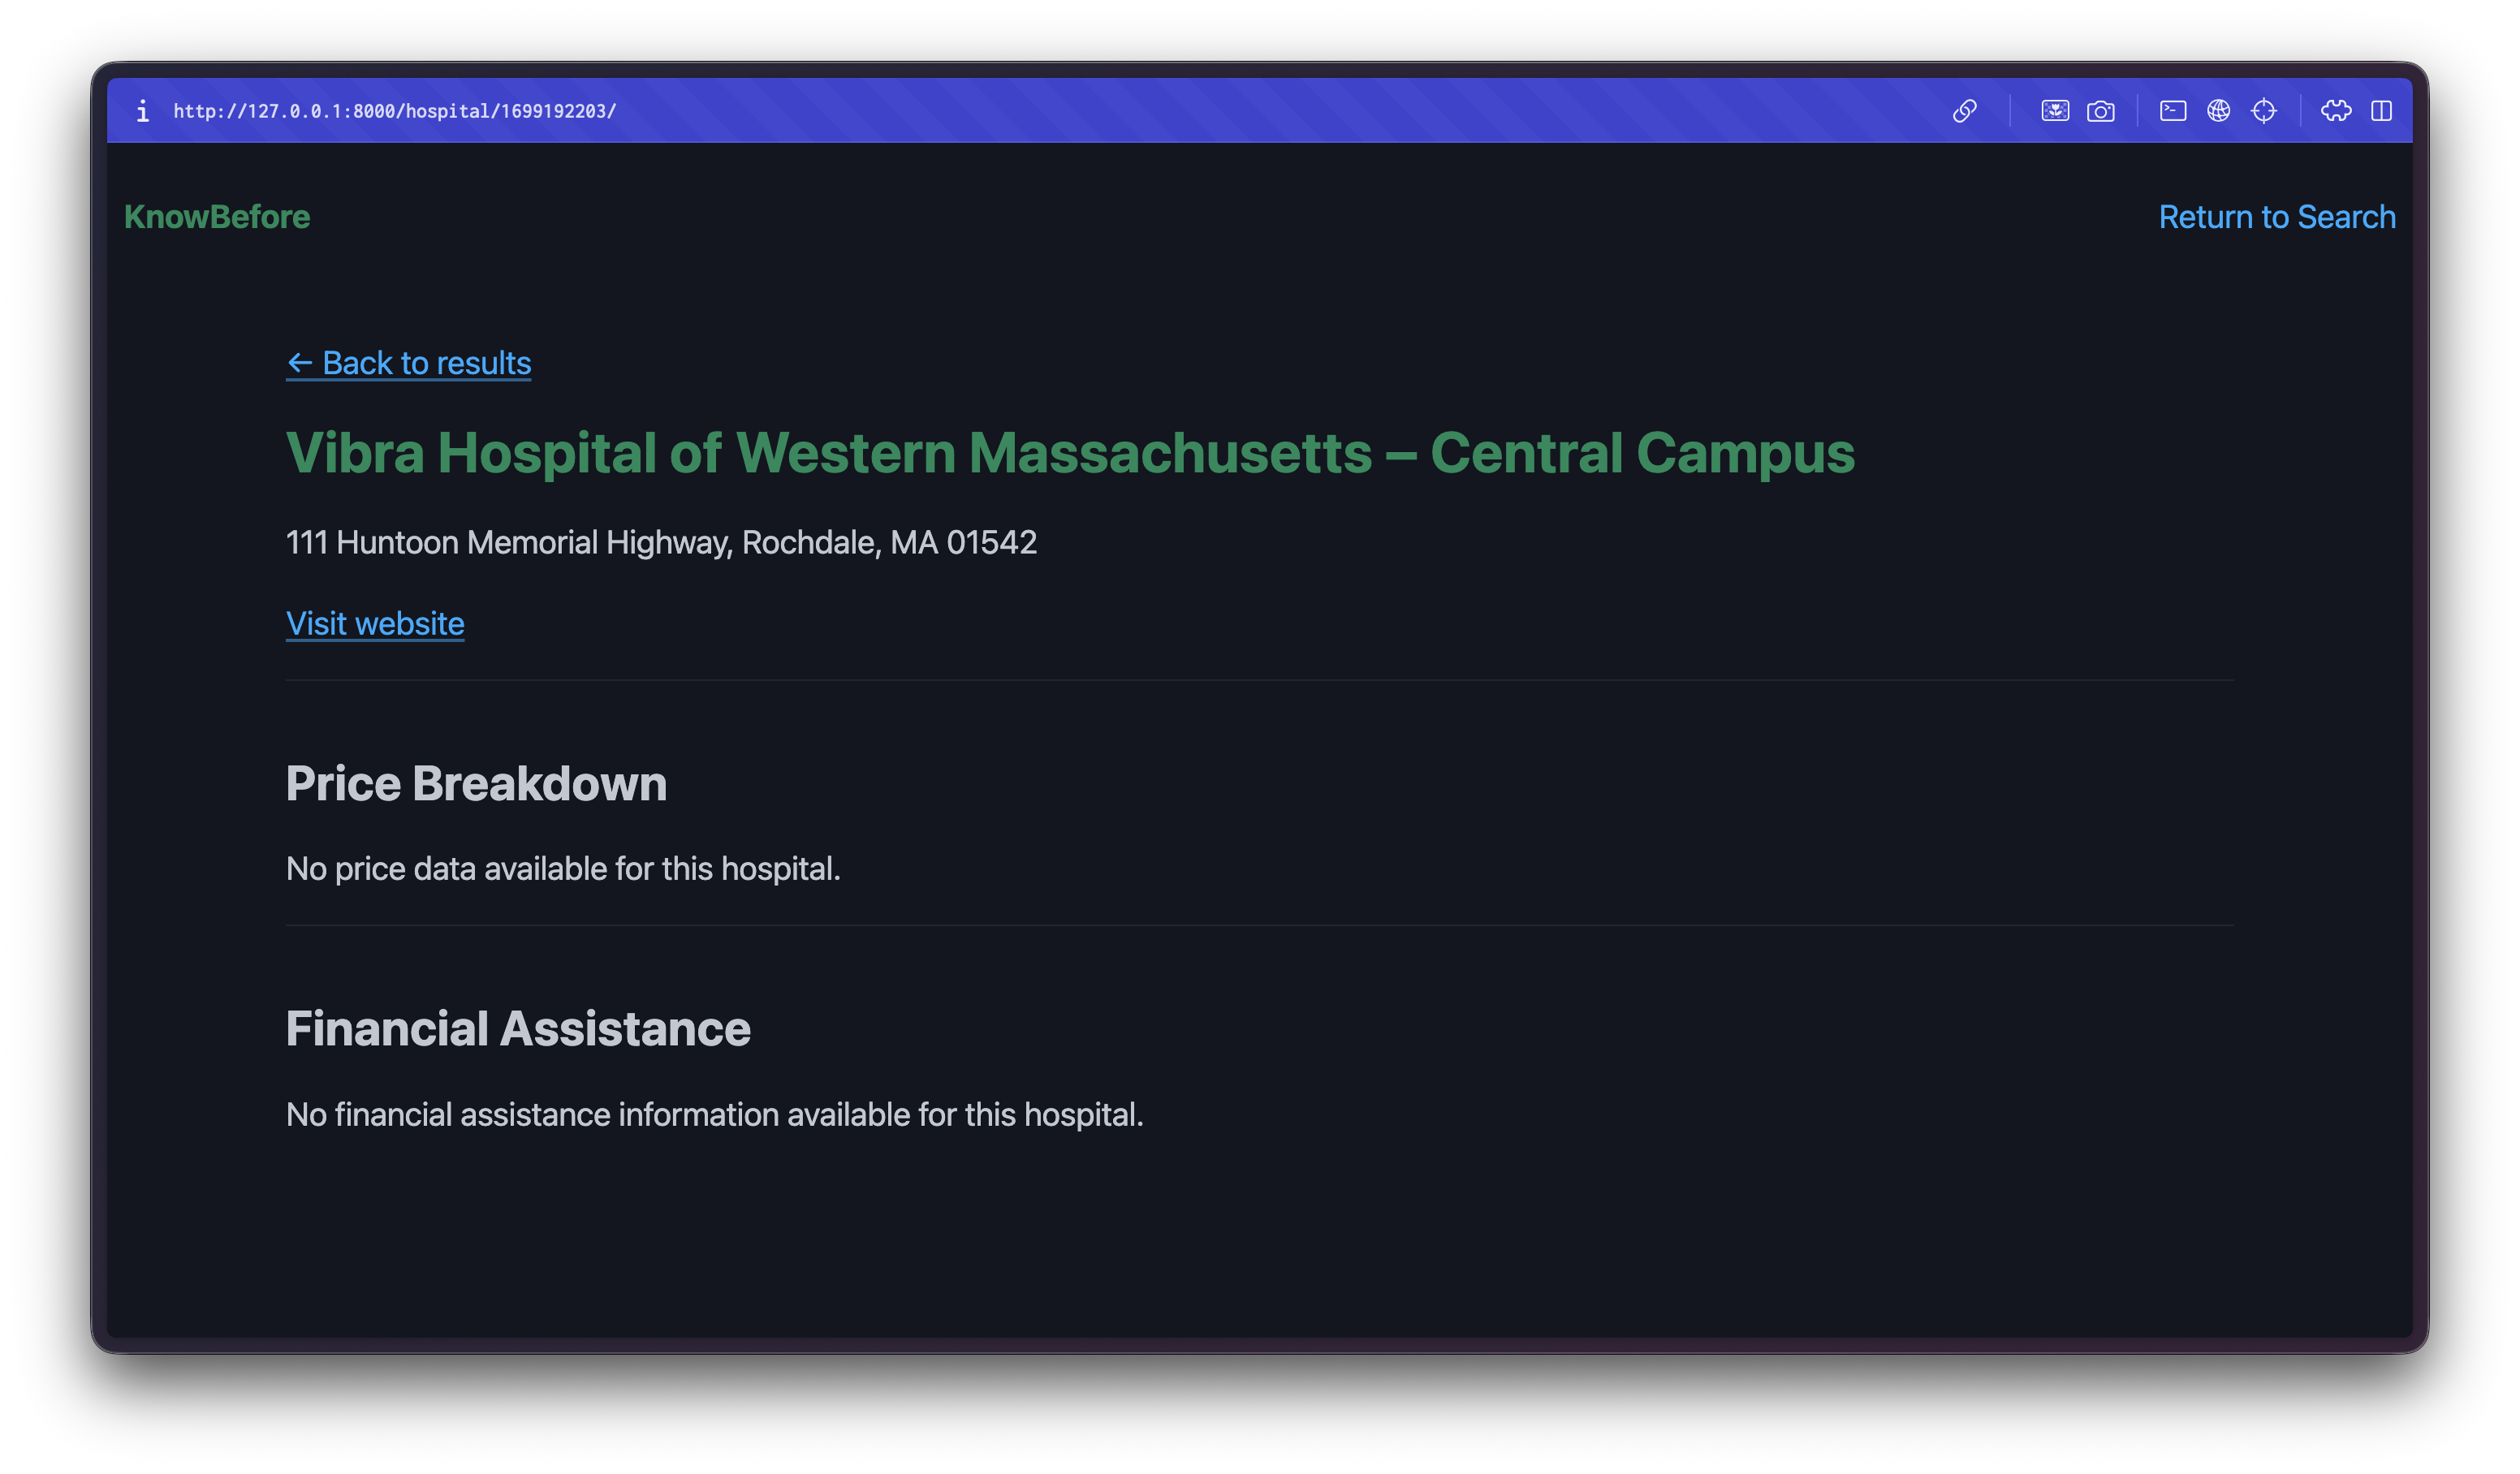
Specific service info
-
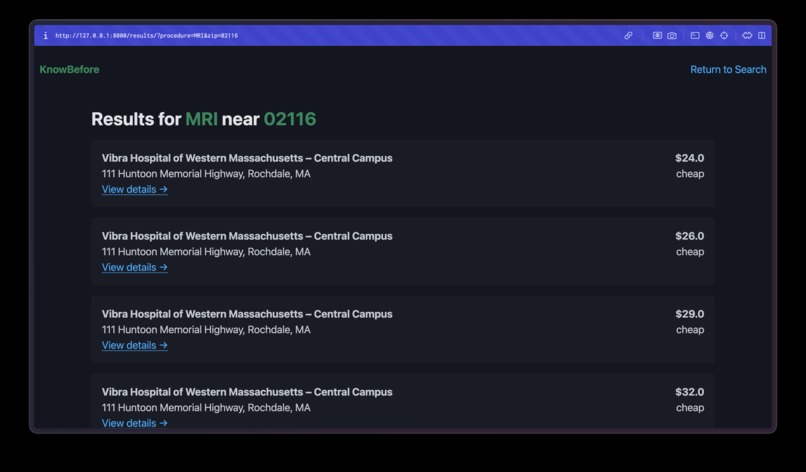
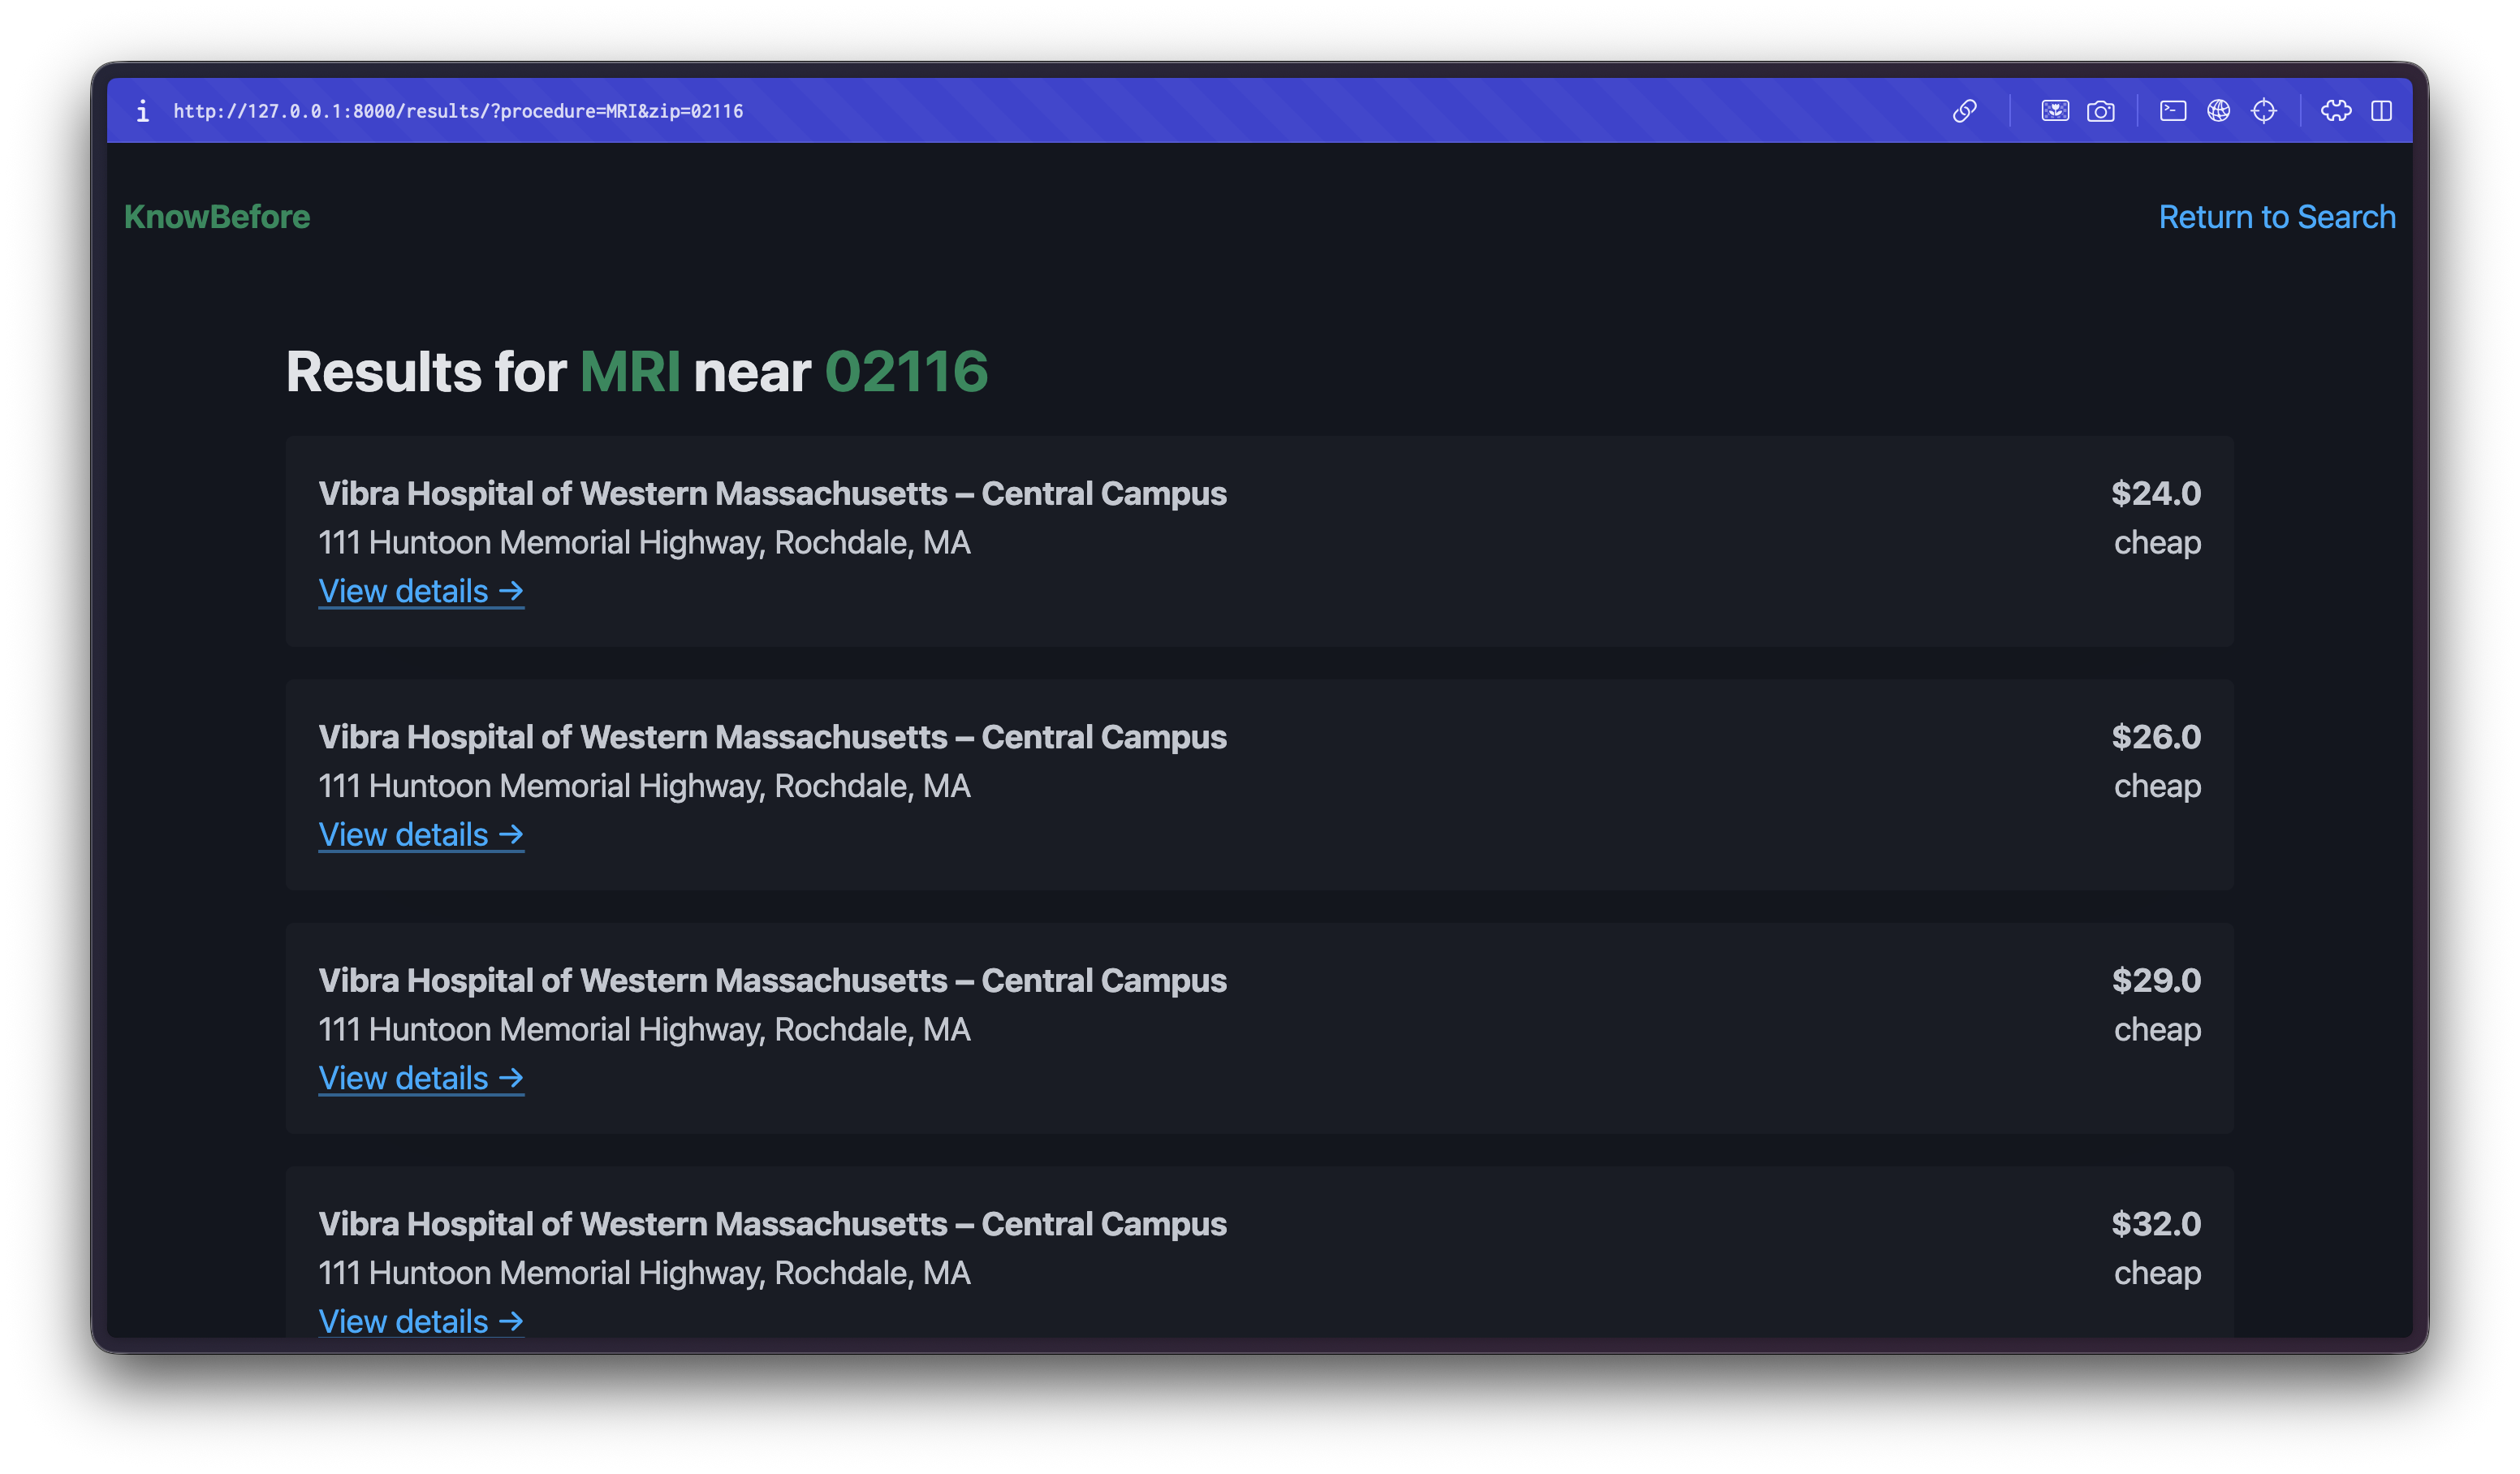
Service View
Inspiration
Healthcare in the US is notoriously opaque. A simple MRI can cost $400 at one hospital and $4,000 at another just a few miles away — and patients have no way of knowing until the bill arrives. We were inspired by a real frustration: a family member who skipped a follow-up scan because they couldn't afford the uncertainty. That moment stuck with us. When we discovered that hospitals are now legally required to publish their cash prices, we knew there was an opportunity to turn buried government data into something genuinely useful for everyday people. KnowBefore was built to close that gap.
What it does
KnowBefore is a healthcare price transparency dashboard that lets anyone search for a medical procedure by name, enter their zip code, and instantly see real cash prices from hospitals in their area. Results are pulled from a live hospital price database and ranked by cost, with each price labeled as cheap, average, or expensive relative to the regional average. Users can also drill into any individual hospital to see a full price breakdown for their specific procedure. No account. No insurance jargon. Just answers.
How we built it
We built KnowBefore as a full-stack web application:
- Frontend: A responsive UI built with HTML, CSS, and JavaScript, designed to be fast and accessible on both desktop and mobile.
- Backend: A Python/Flask API that handles procedure search, zip code resolution, and hospital lookups.
- Data: We query the DoltHub Hospital Price Transparency database in real time via their public API. This database contains prices from hundreds of hospitals across the US, sourced from mandatory government disclosures.
- Location filtering: We convert the user's zip code to a state using the zippopotam.us API, then filter hospital results by state — giving a practical and reliable geographic scope given the dataset's coverage.
- Autocomplete: Procedure search is powered by a cached subset of CPT/HCPCS codes, with smart ranking that surfaces the most relevant results first.
Challenges we ran into
- Dirty data: Hospital price data is notoriously inconsistent. NPI numbers were sometimes stored as floats (e.g. 1234567890.0), zip codes were missing or malformatted, and payer labels varied wildly between hospitals.
- No geolocation in the dataset: The hospitals table contains no latitude or longitude — just state and zip code. This meant we couldn't do radius-based filtering and had to rethink our location strategy entirely.
- Sparse coverage: The dataset covers roughly 1,800 of the ~6,000 US hospitals, so exact zip code matching returned zero results most of the time. Switching to state-level filtering was a key fix. API latency: Querying DoltHub's API in real time introduced latency, especially when chaining multiple queries (CPT lookup → price lookup → hospital detail). We mitigated this with caching and query optimization.
Accomplishments that we're proud of
- Built a fully functional, end-to-end price transparency tool in a short time using entirely free and open data.
- Solved a real location-filtering bug that was silently returning wrong results — and replaced it with a robust zip-to-state pipeline.
- Designed an experience simple enough for someone with zero healthcare knowledge to use in under 30 seconds.
- Connected publicly available government-mandated data to a UI that makes it actually actionable.
What we learned
- Open data is powerful but messy. Getting value out of real-world datasets requires a lot of defensive coding, normalization, and fallback logic.
- Geographic assumptions matter. We initially assumed the database had lat/lng coordinates — it didn't. Always verify your data schema before building on top of it.
- Simplicity is a feature. The most important design decision we made was to show one input, one result list, and one clear price label. Users don't need more than that to make a better decision.
- Price transparency is just the start. What patients really need is price context — and we learned that even a simple above/below average label can make raw numbers feel meaningful and actionable.

Log in or sign up for Devpost to join the conversation.