-
-

In One Click
-

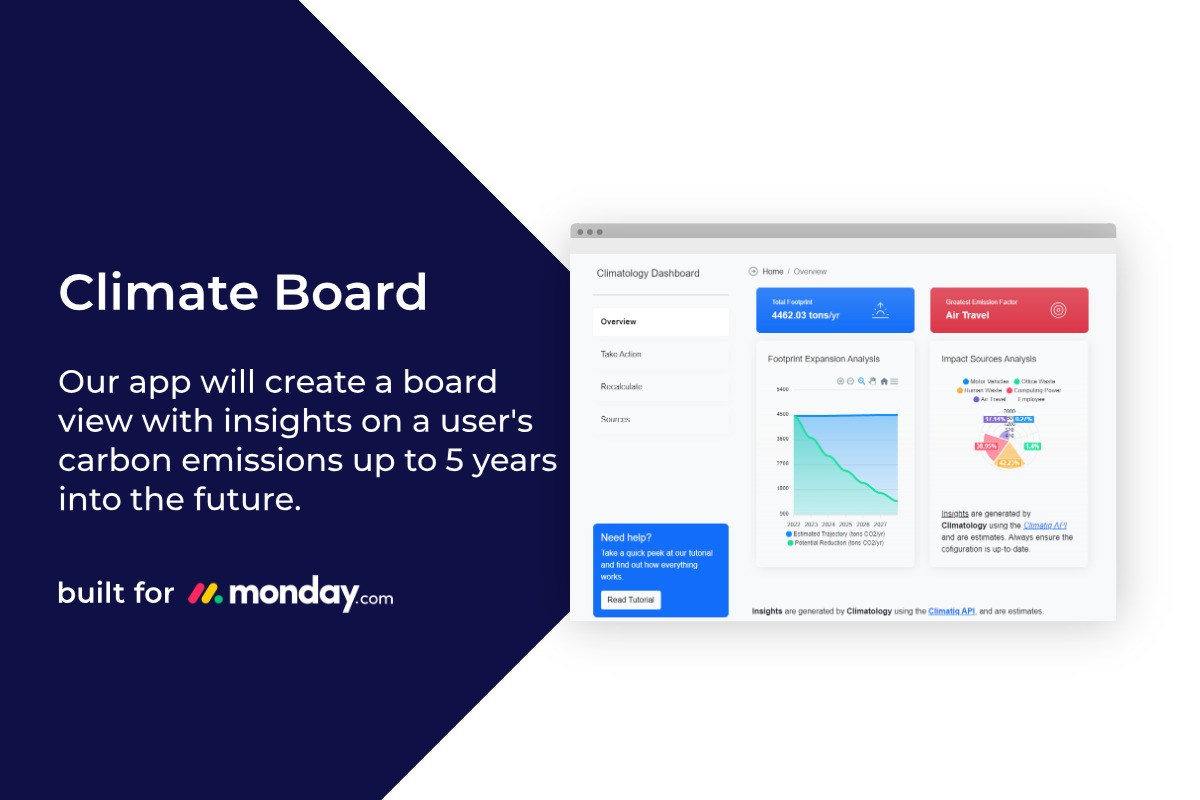
Climate Board Preview
-

Take Action Board Preview
-

Online Guide Page
-

New Features


The Problem:
How do we help companies find the most effective ways to reduce their environmental impact?
Challenging Questions
- How do we reduce carbon emissions at the organizational level?
- How can we make emissions reduction strategies more accessible?
- How do we improve an organization's awareness of their emissions?
Inspiration: Real Climate Action
Some of Monday.com's most common users are growing tech and ecommerce startups that are given little insight into their environmental impact as small companies. Given that industrial practices are making up for more and more of our planet's carbon footprint, this project provided the opportunity to create an easy and accessible solution to presenting paths to reducing emissions for companies of any size.
Climatology is my biggest and most complex project to date. The app is built using React, and of course, the monday.com apps sdk.
Features
Emissions Dashboard: A delightfully handcrafted board view, which includes:
- 📊 Up-To-Date Emissions Data: Climatology will estimate an organization's entire carbon footprint, which is calculated from information on the monday.com workspace the user has selected, alongside industry-specific data.
- 🧭 Beautiful, Meaningful Graphics: Responsive graphics that detail represent emissions data, which are interactive and print-friendly.
- 👣 Footprint Projections: Algorithmically visualizes two potential trajectories for the organization's emissions, up to five years into the future.
Footprint Reduction Strategies:
- 🤖 With help from technologies developed by OpenAI, Climatology will generate methods of reducing emissions specific to the organization's situation. These are based on the organization's greatest contributing factors to their emissions.
- 📉 Emissions Reduction Strategies are displayed on a panel of their own ("Take Action"), and are ranked based on effectiveness and simplicity.
Printable and Presentable
- 📈 Thorough Data Visualizations: Many organizations are creating impact reports to show executives and investors their sustainability goals. Climatology's data visualizations are printable in three formats, and can be easily implemented into an impact report.
Completely Free: Thanks to Climatiq and monday.com's APIs being free, the Climatology app is extremely accessible.
What's next for Climatology?
- Public Beta! Let's see what the public can do with greater emissions data in their hands.
- Increased range for Climatiq emissions factors
- Industry-tailored guides on sustainable practices
- More on the GitHub!
Conclusion
I believe that presenting organizations with easy-to-read, informative data on their emissions is the best way to encourage them to make a conscious effort to reduce them.
The cherry on top - AI-generated emissions reduction strategies - makes it easy for organizations of any size to begin to take steps to reduce their carbon emissions.
There is no better way shrink your carbon footprint, when the instructions are presented right in front of you, is there?

Built With
- apexcharts
- bootstrap
- digitalocean
- monday.com
- node.js
- react


Log in or sign up for Devpost to join the conversation.