Inspiration
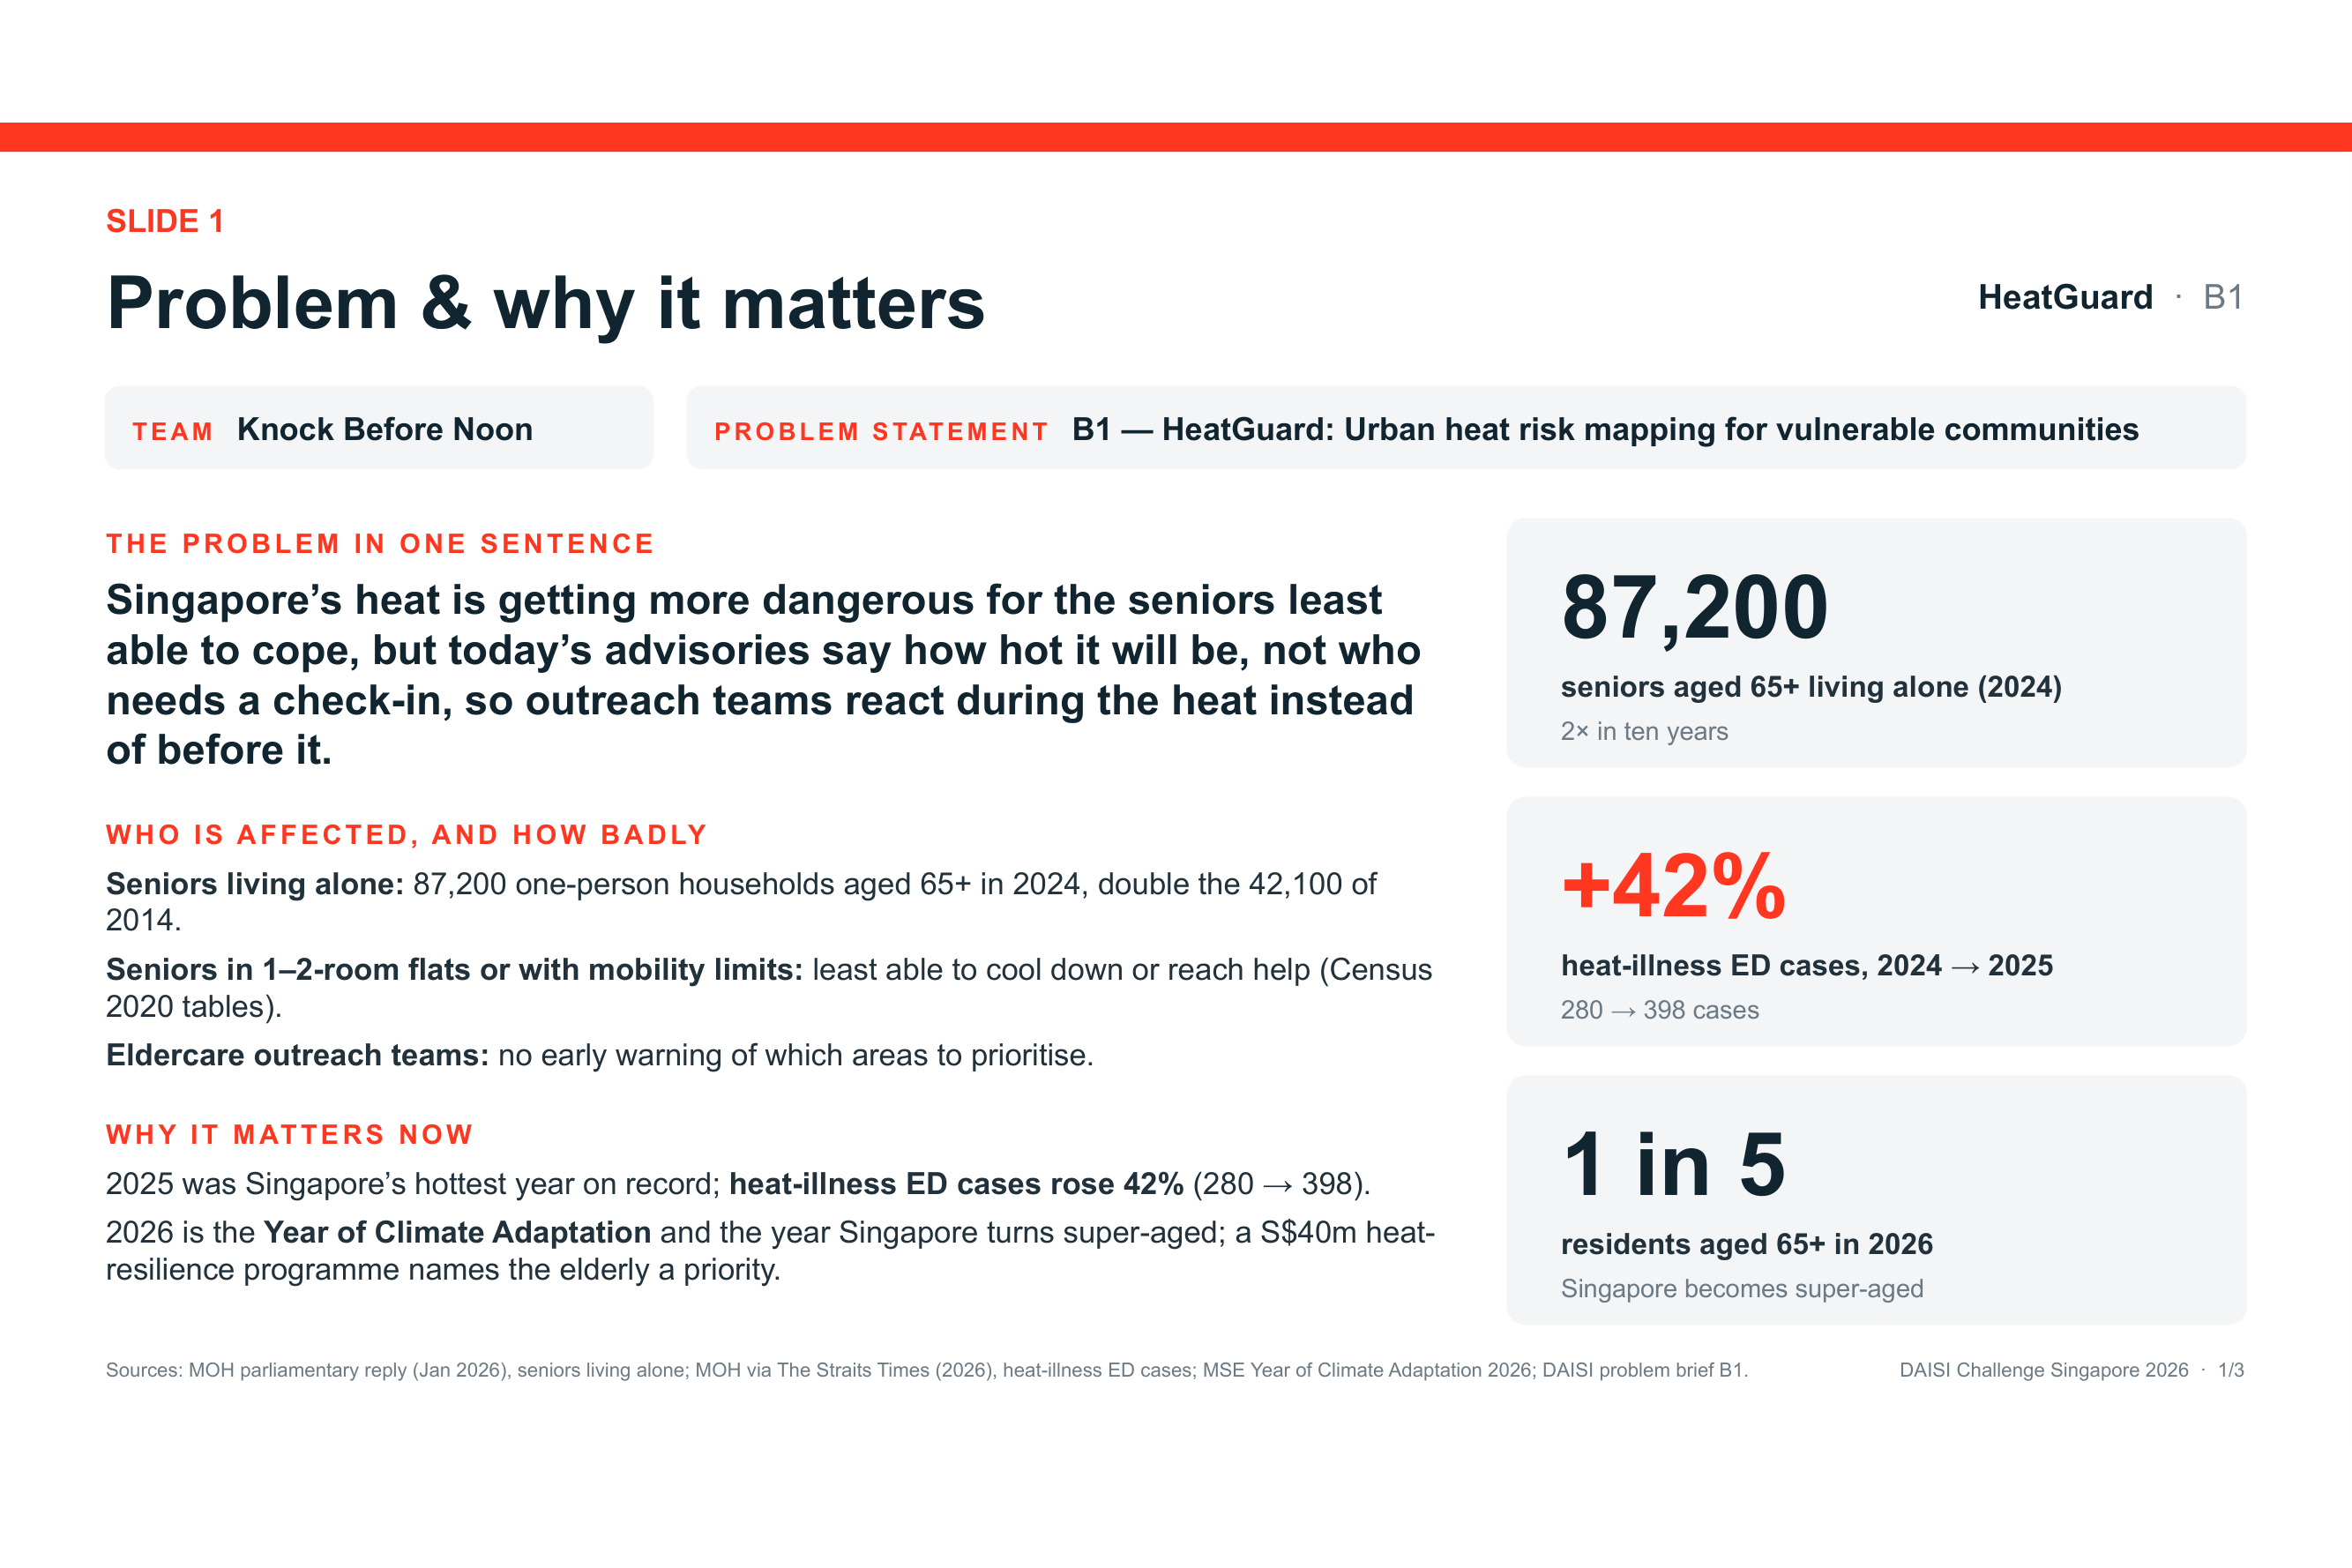
Singapore becomes a super-aged society in 2026, and 2025 was its hottest year on record. The number of seniors aged 65+ living alone doubled in ten years, from 42,100 in 2014 to 87,200 in 2024 (MOH, Jan 2026). Heat-illness cases at emergency departments rose 42%, from 280 in 2024 to 398 in 2025.
NEA already publishes live heat-stress readings (Wet Bulb Globe Temperature, WBGT) with Low / Moderate / High bands. But an advisory tells you how hot it will be, not who needs a check-in. Active Ageing Centre coordinators and Silver Generation Office volunteers have limited time, and today they have no early signal of which neighbourhoods to prioritise before a hot day. So outreach tends to happen during the heat, not before it.
We wanted to connect the hazard to the people: if tomorrow afternoon will be dangerously hot, which neighbourhoods have the most vulnerable seniors, and what should outreach teams do this morning?
What it does
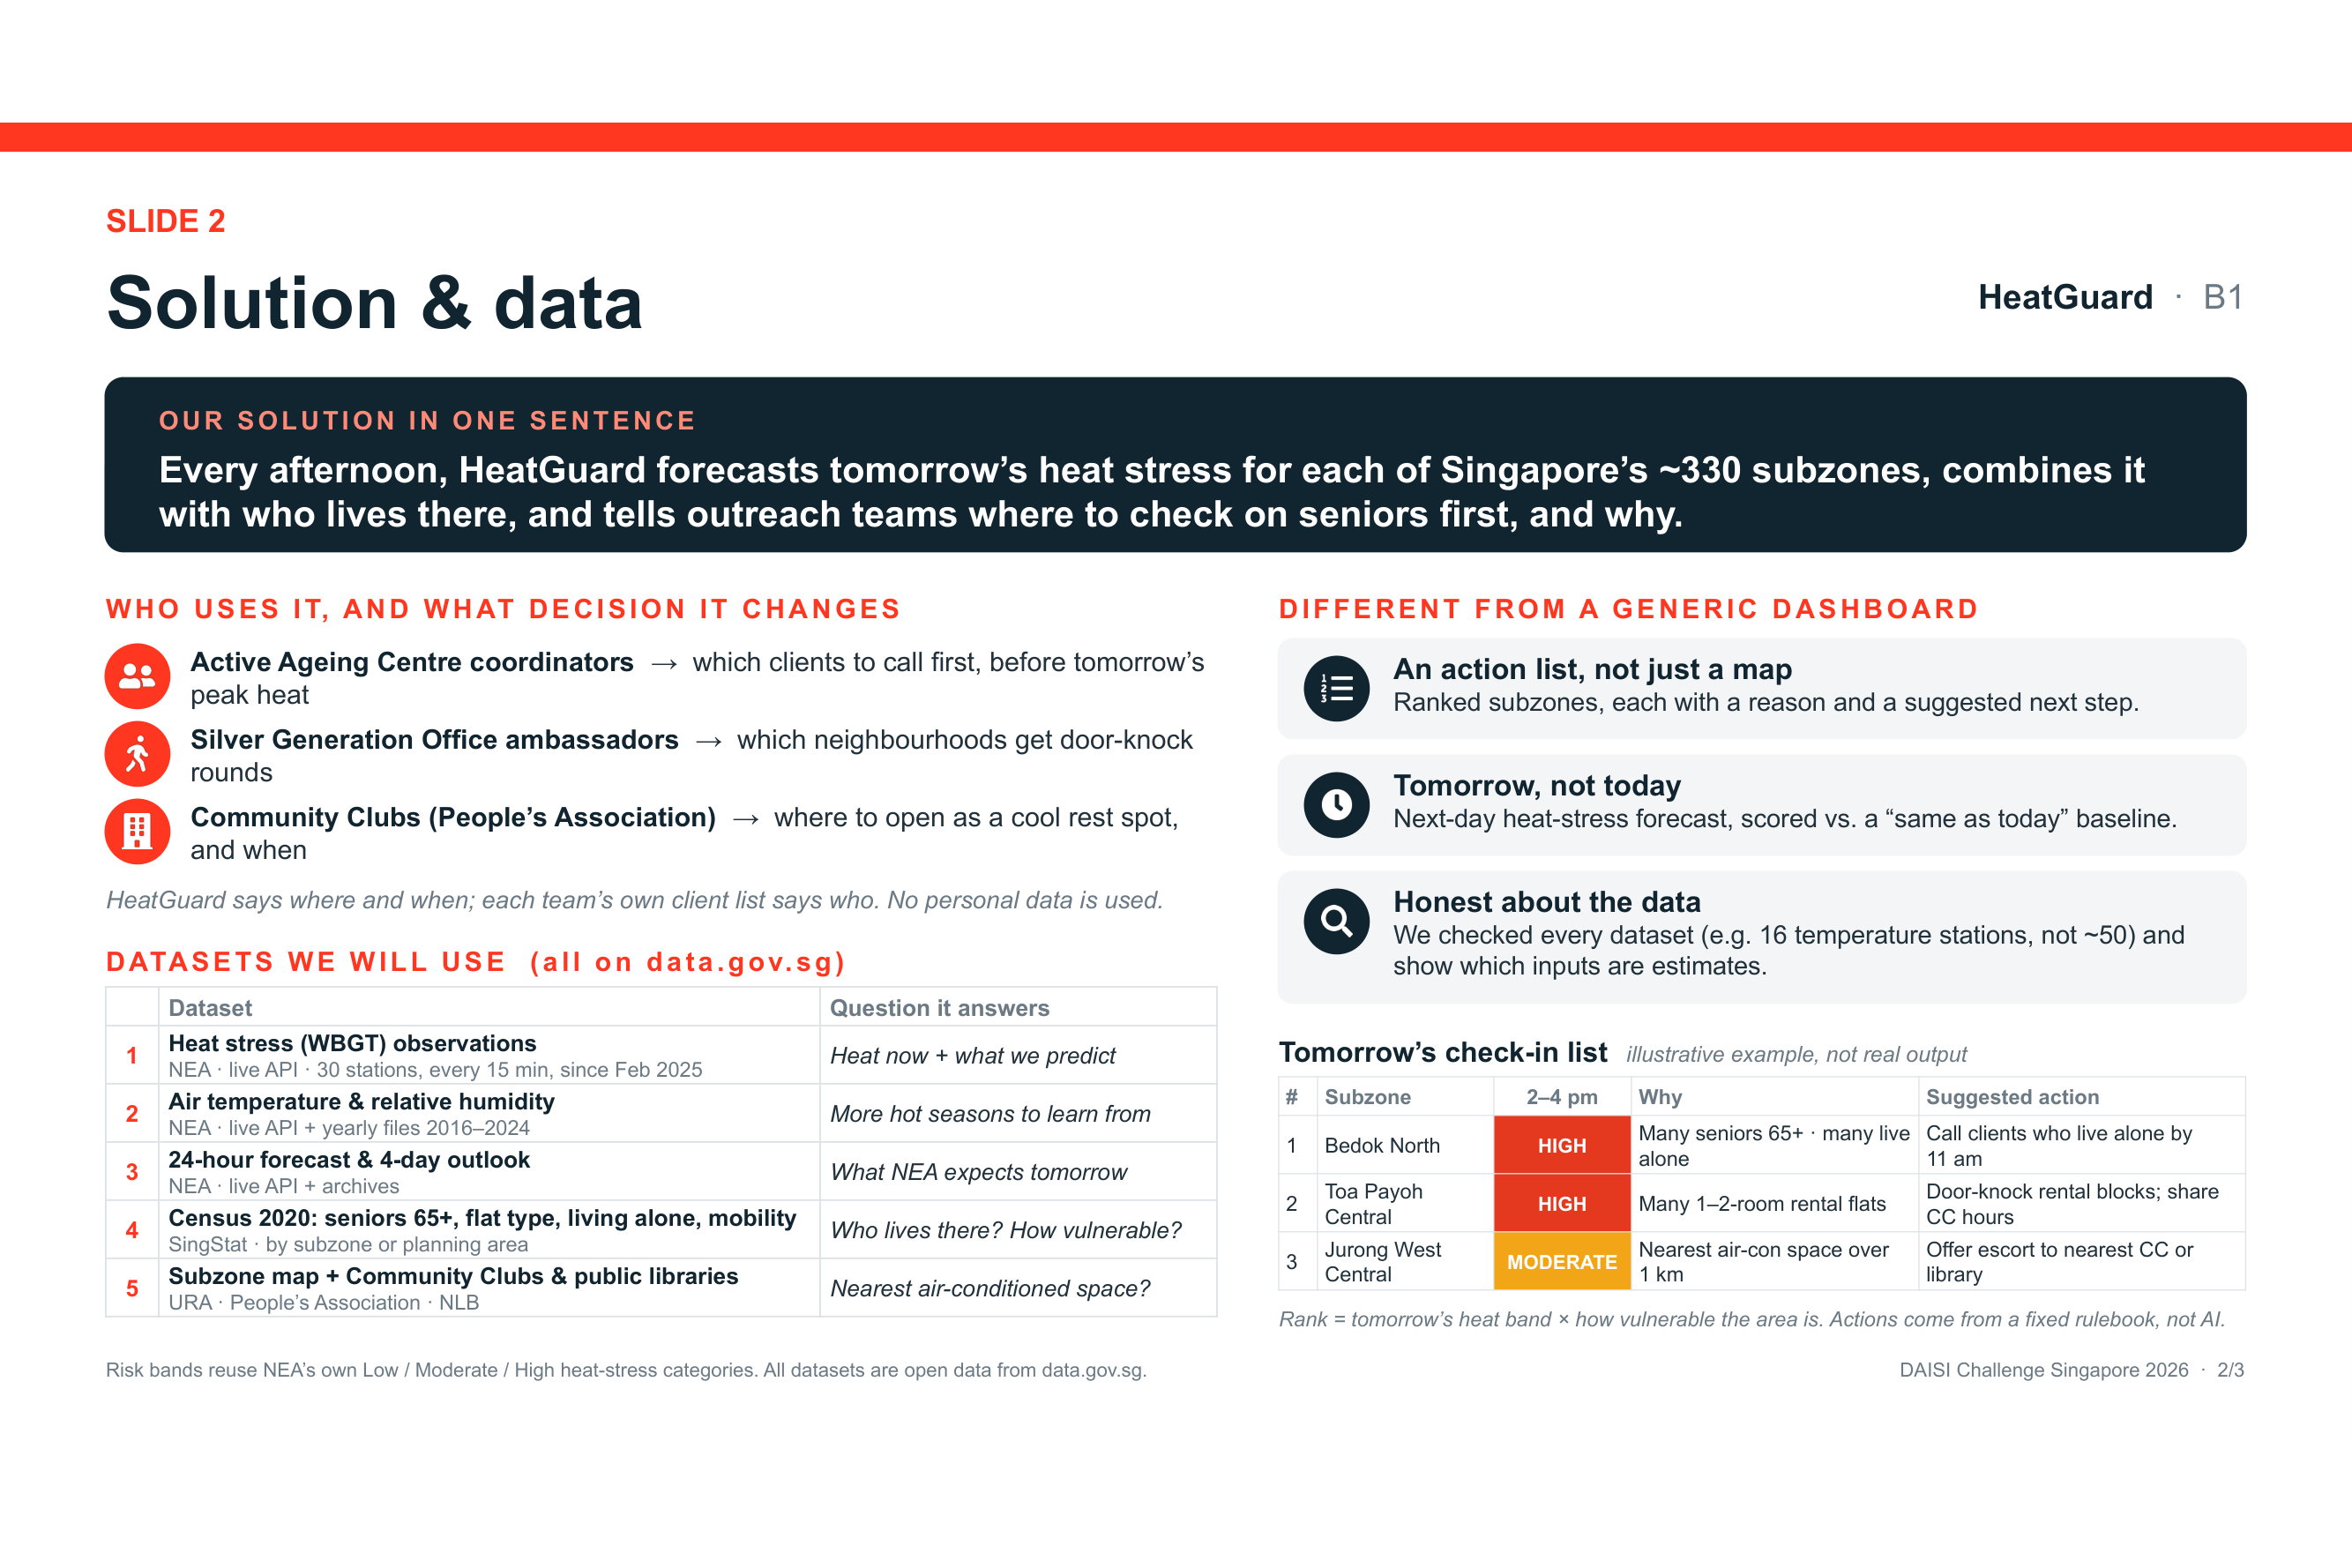
HeatGuard runs every afternoon and produces tomorrow's check-in list:
- Forecasts tomorrow's afternoon heat stress at each of NEA's 30 WBGT stations, using NEA's own forecast plus recent heat-stress, temperature and humidity readings.
- Maps the forecast onto Singapore's ~330 subzones and assigns NEA's official Low / Moderate / High band.
- Scores how vulnerable each subzone is, using Census 2020 (share of seniors 65+, 1–2-room flats, one-person households, households with someone who has difficulty with daily activities) and distance to the nearest air-conditioned Community Club or public library.
- Ranks subzones by heat band × vulnerability, and gives each one a plain-English reason and a suggested action from a transparent rulebook. For example, "Many one-person households → call clients who live alone by 11 am".
HeatGuard works at area level and uses no personal data. It tells teams where and when; each team's own client list tells them who.
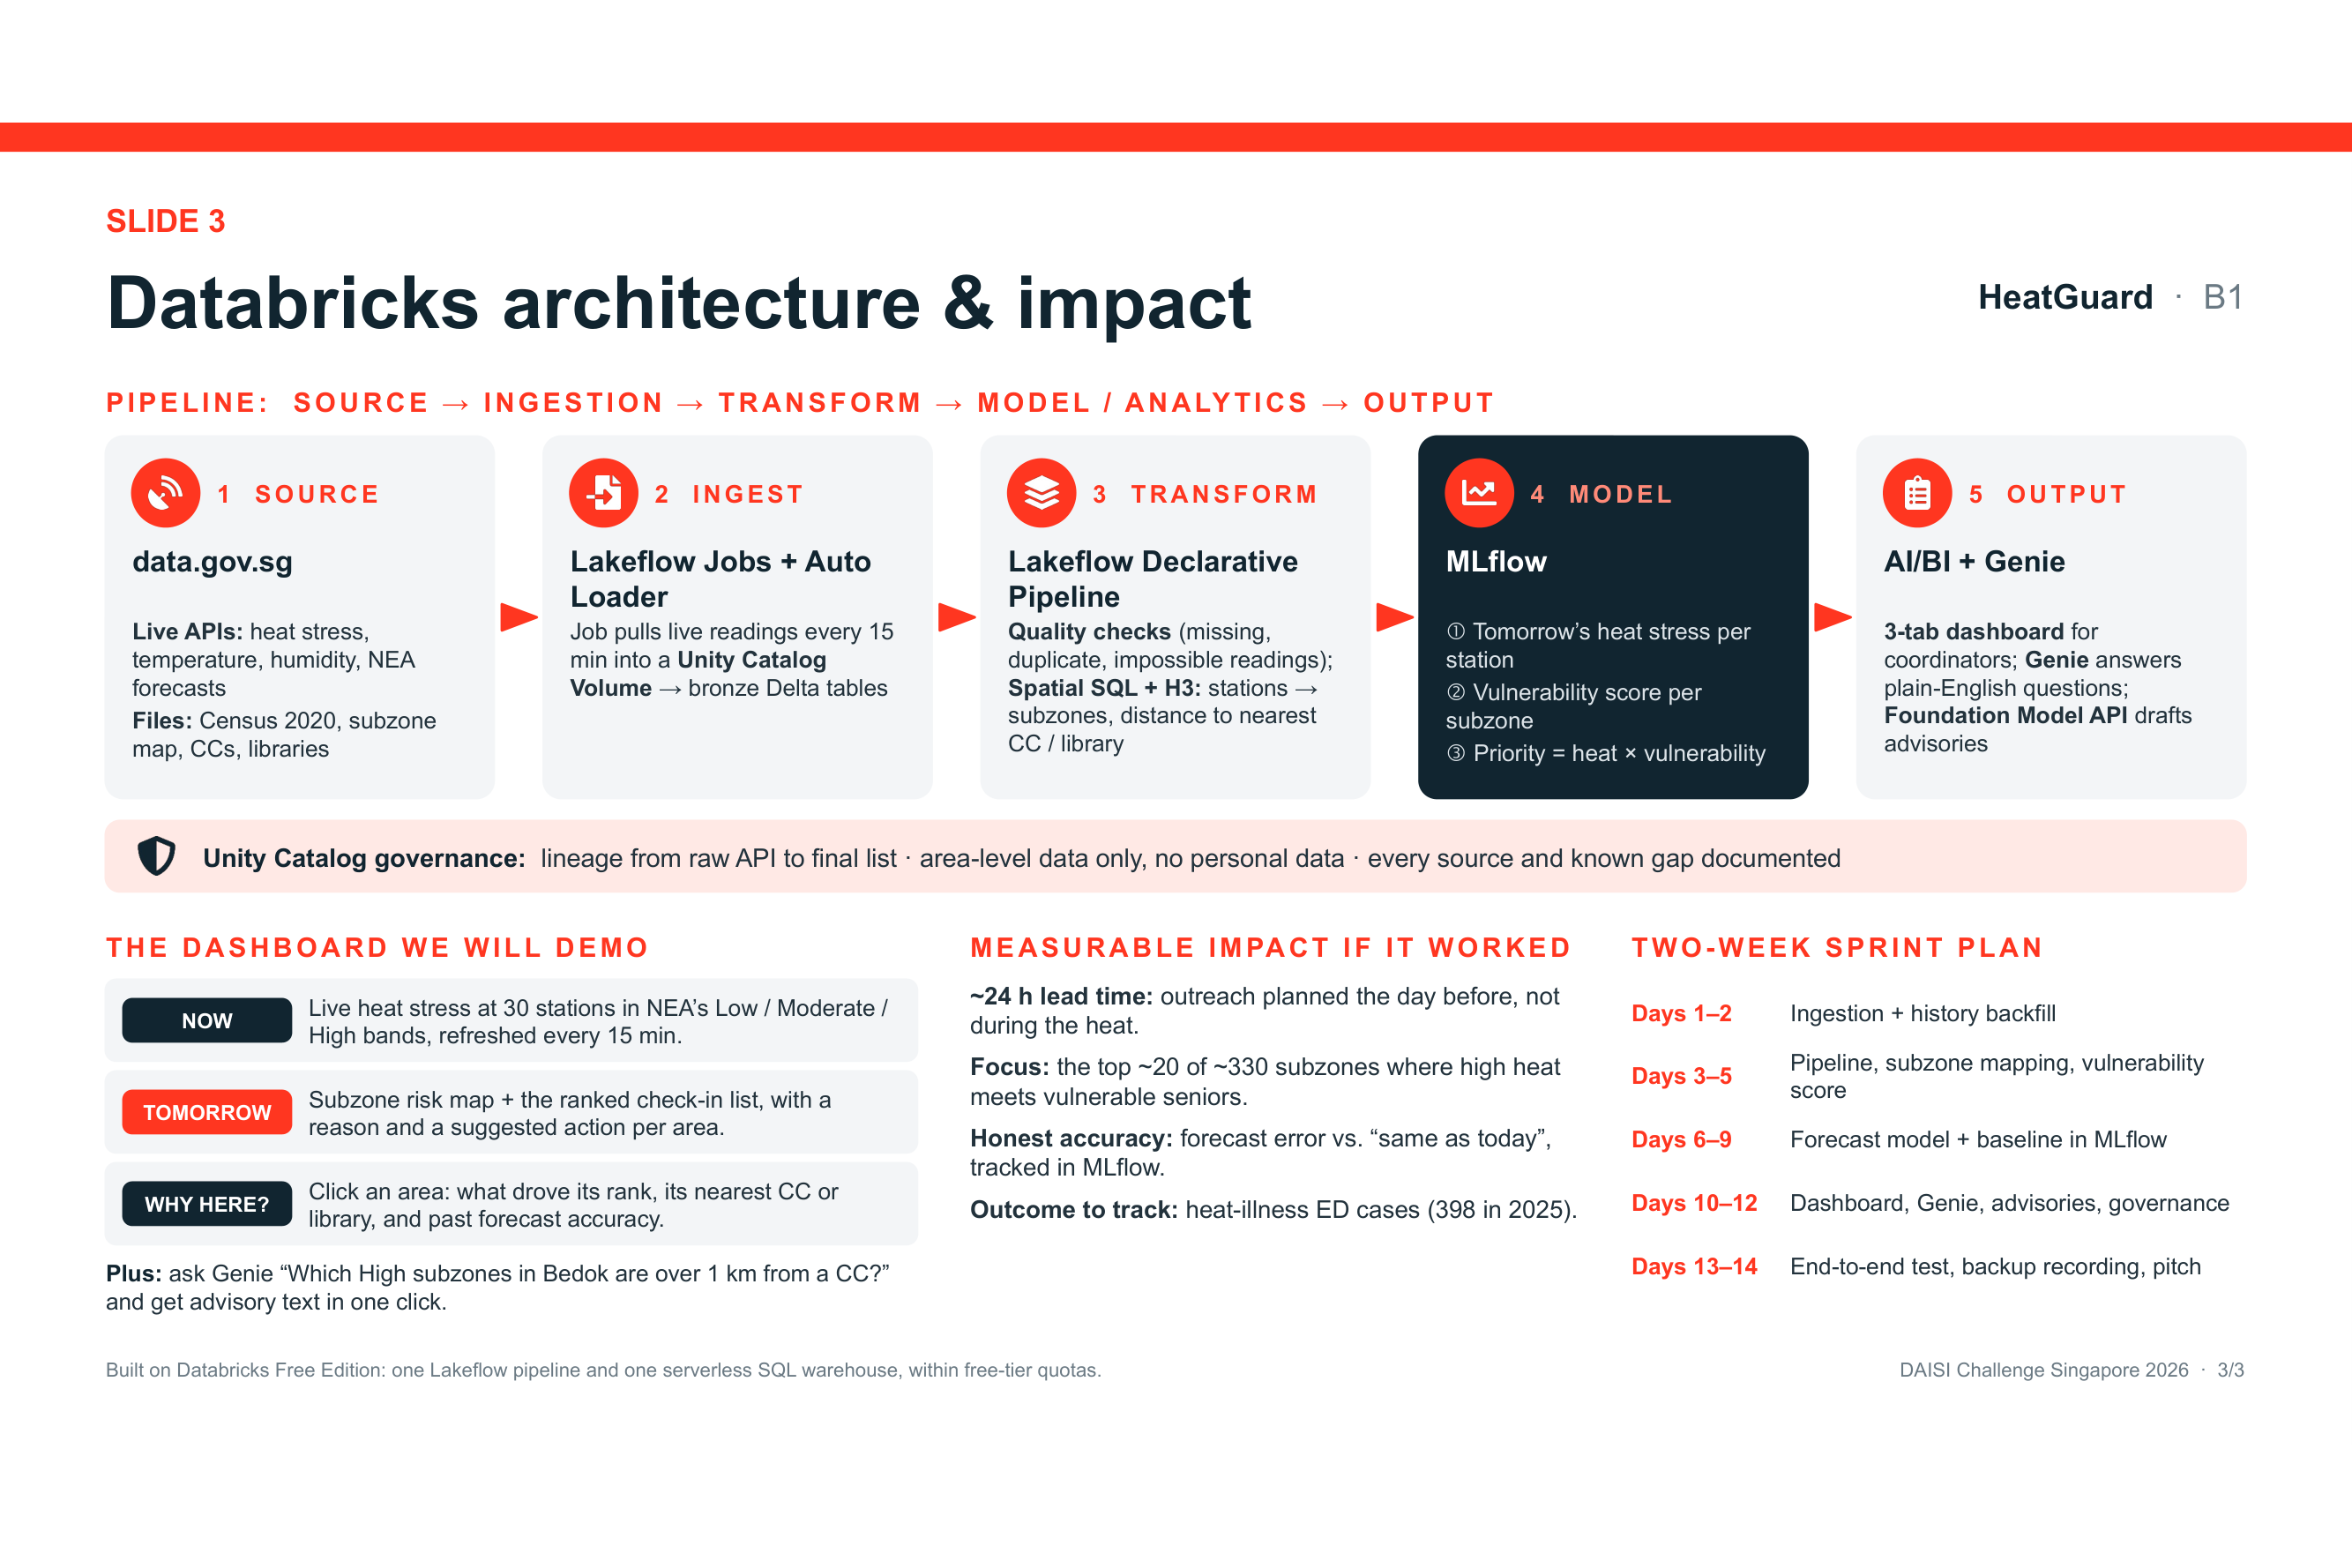
The dashboard has three tabs:
- Now: live heat stress across the station network, refreshed every 15 minutes.
- Tomorrow: subzone risk map and the ranked check-in list.
- Why here?: what drove an area's rank, its nearest cool space, and how accurate past forecasts have been.
Coordinators can also ask questions in plain English through a Genie space, and get a ready-to-send advisory drafted in one click.
How we will build it
Everything runs on Databricks Free Edition using open data from data.gov.sg:
- Ingest: a scheduled Lakeflow Job pulls NEA's live APIs (WBGT, air temperature, humidity, 24-hour and 4-day forecasts) every 15 minutes into a Unity Catalog Volume. Auto Loader loads them into bronze Delta tables. Historical files (2016–2024) are backfilled for training.
- Transform: one Lakeflow Declarative Pipeline applies data-quality checks (missing, duplicate and physically impossible readings). It then uses Spatial SQL and H3 to map station readings to subzones and to measure distance to the nearest Community Club or library.
- Model: a next-day heat-stress forecast per station, tracked in MLflow and scored against a "tomorrow = today" baseline, plus a transparent vulnerability score per subzone with published weights.
- Serve: an AI/BI dashboard, a Genie space for plain-English questions, and a Foundation Model API step that turns the chosen action into a friendly advisory. It rewrites wording only and never decides the action.
- Govern: Unity Catalog lineage from raw API call to final list, with every source and known data gap documented.
Datasets (all on data.gov.sg): WBGT Observations (NEA), Air Temperature and Relative Humidity (NEA), 24-hour Weather Forecast and 4-day Outlook (NEA), Census of Population 2020 planning-area and subzone tables (SingStat), Master Plan 2019 Subzone Boundary (URA), Community Clubs (People's Association) and Libraries (NLB).
Challenges we ran into
We checked every dataset in the problem brief against the live data.gov.sg catalogue, and several didn't match their description:
- There are 16 air-temperature stations, not ~50. NEA's newer WBGT network has 30 stations, with history from February 2025, so we use it as our main signal.
- PM2.5 is hourly across 5 regions, not 15-minute readings.
- The "HDB elderly population by block" data is really by HDB town and ends in 2018. We use Census 2020 subzone tables instead.
- Census "living alone" and "difficulty with daily activities" are published for all ages, by planning area only. We say this openly instead of claiming a precise count of seniors living alone in each subzone.
- The only eldercare-centre location layer dates from 2016, so we measure access to air-conditioned Community Clubs and libraries instead.
There is also no area-level data on heat illness, so we cannot train a model on real health outcomes. The risk score is therefore a forecast combined with a transparent index, and we report forecast accuracy against a simple baseline rather than claiming headline accuracy.
What we learned
- The deciding question for a data product is not "is the topic important?" but "does the data exist at the level of detail the product promises?"
- A ranked list with a reason and an action is more useful to a busy coordinator than a heatmap they have to interpret.
- Being upfront about data gaps makes the design stronger. It pushed us toward NEA's official heat-stress bands, air-conditioned public spaces and area-level outputs that need no personal data.
What's next
- Validate the action rulebook with Active Ageing Centre staff and align it with NEA's heat-stress advisory guidance.
- Refresh the demographics with SingStat's latest planning-area population estimates.
- Block-level targeting of rental blocks using HDB Property Information (a stretch goal).
- Track real outcomes with partners, such as heat-illness emergency department visits, to measure impact over time.
Built With
- auto-loader
- databricks
- databricks-ai-bi
- delta-lake
- foundation-model-apis
- genie
- h3
- lakeflow
- mlflow
- python
- spark-sql
- unity-catalog
