-
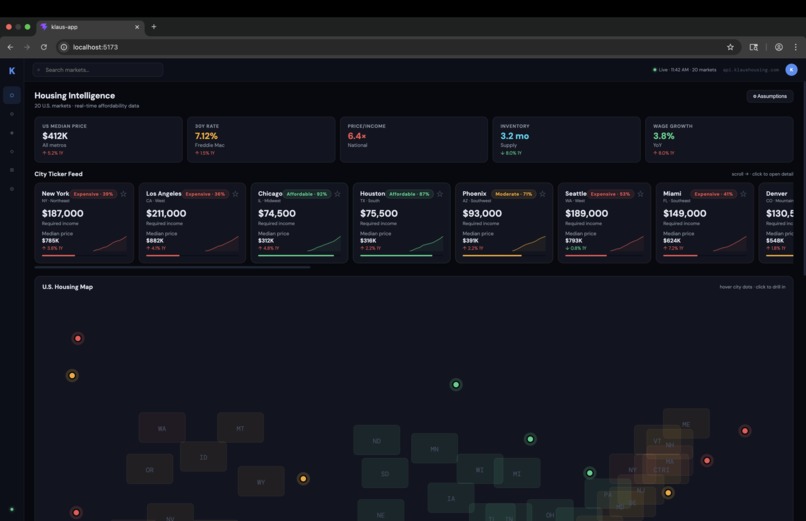
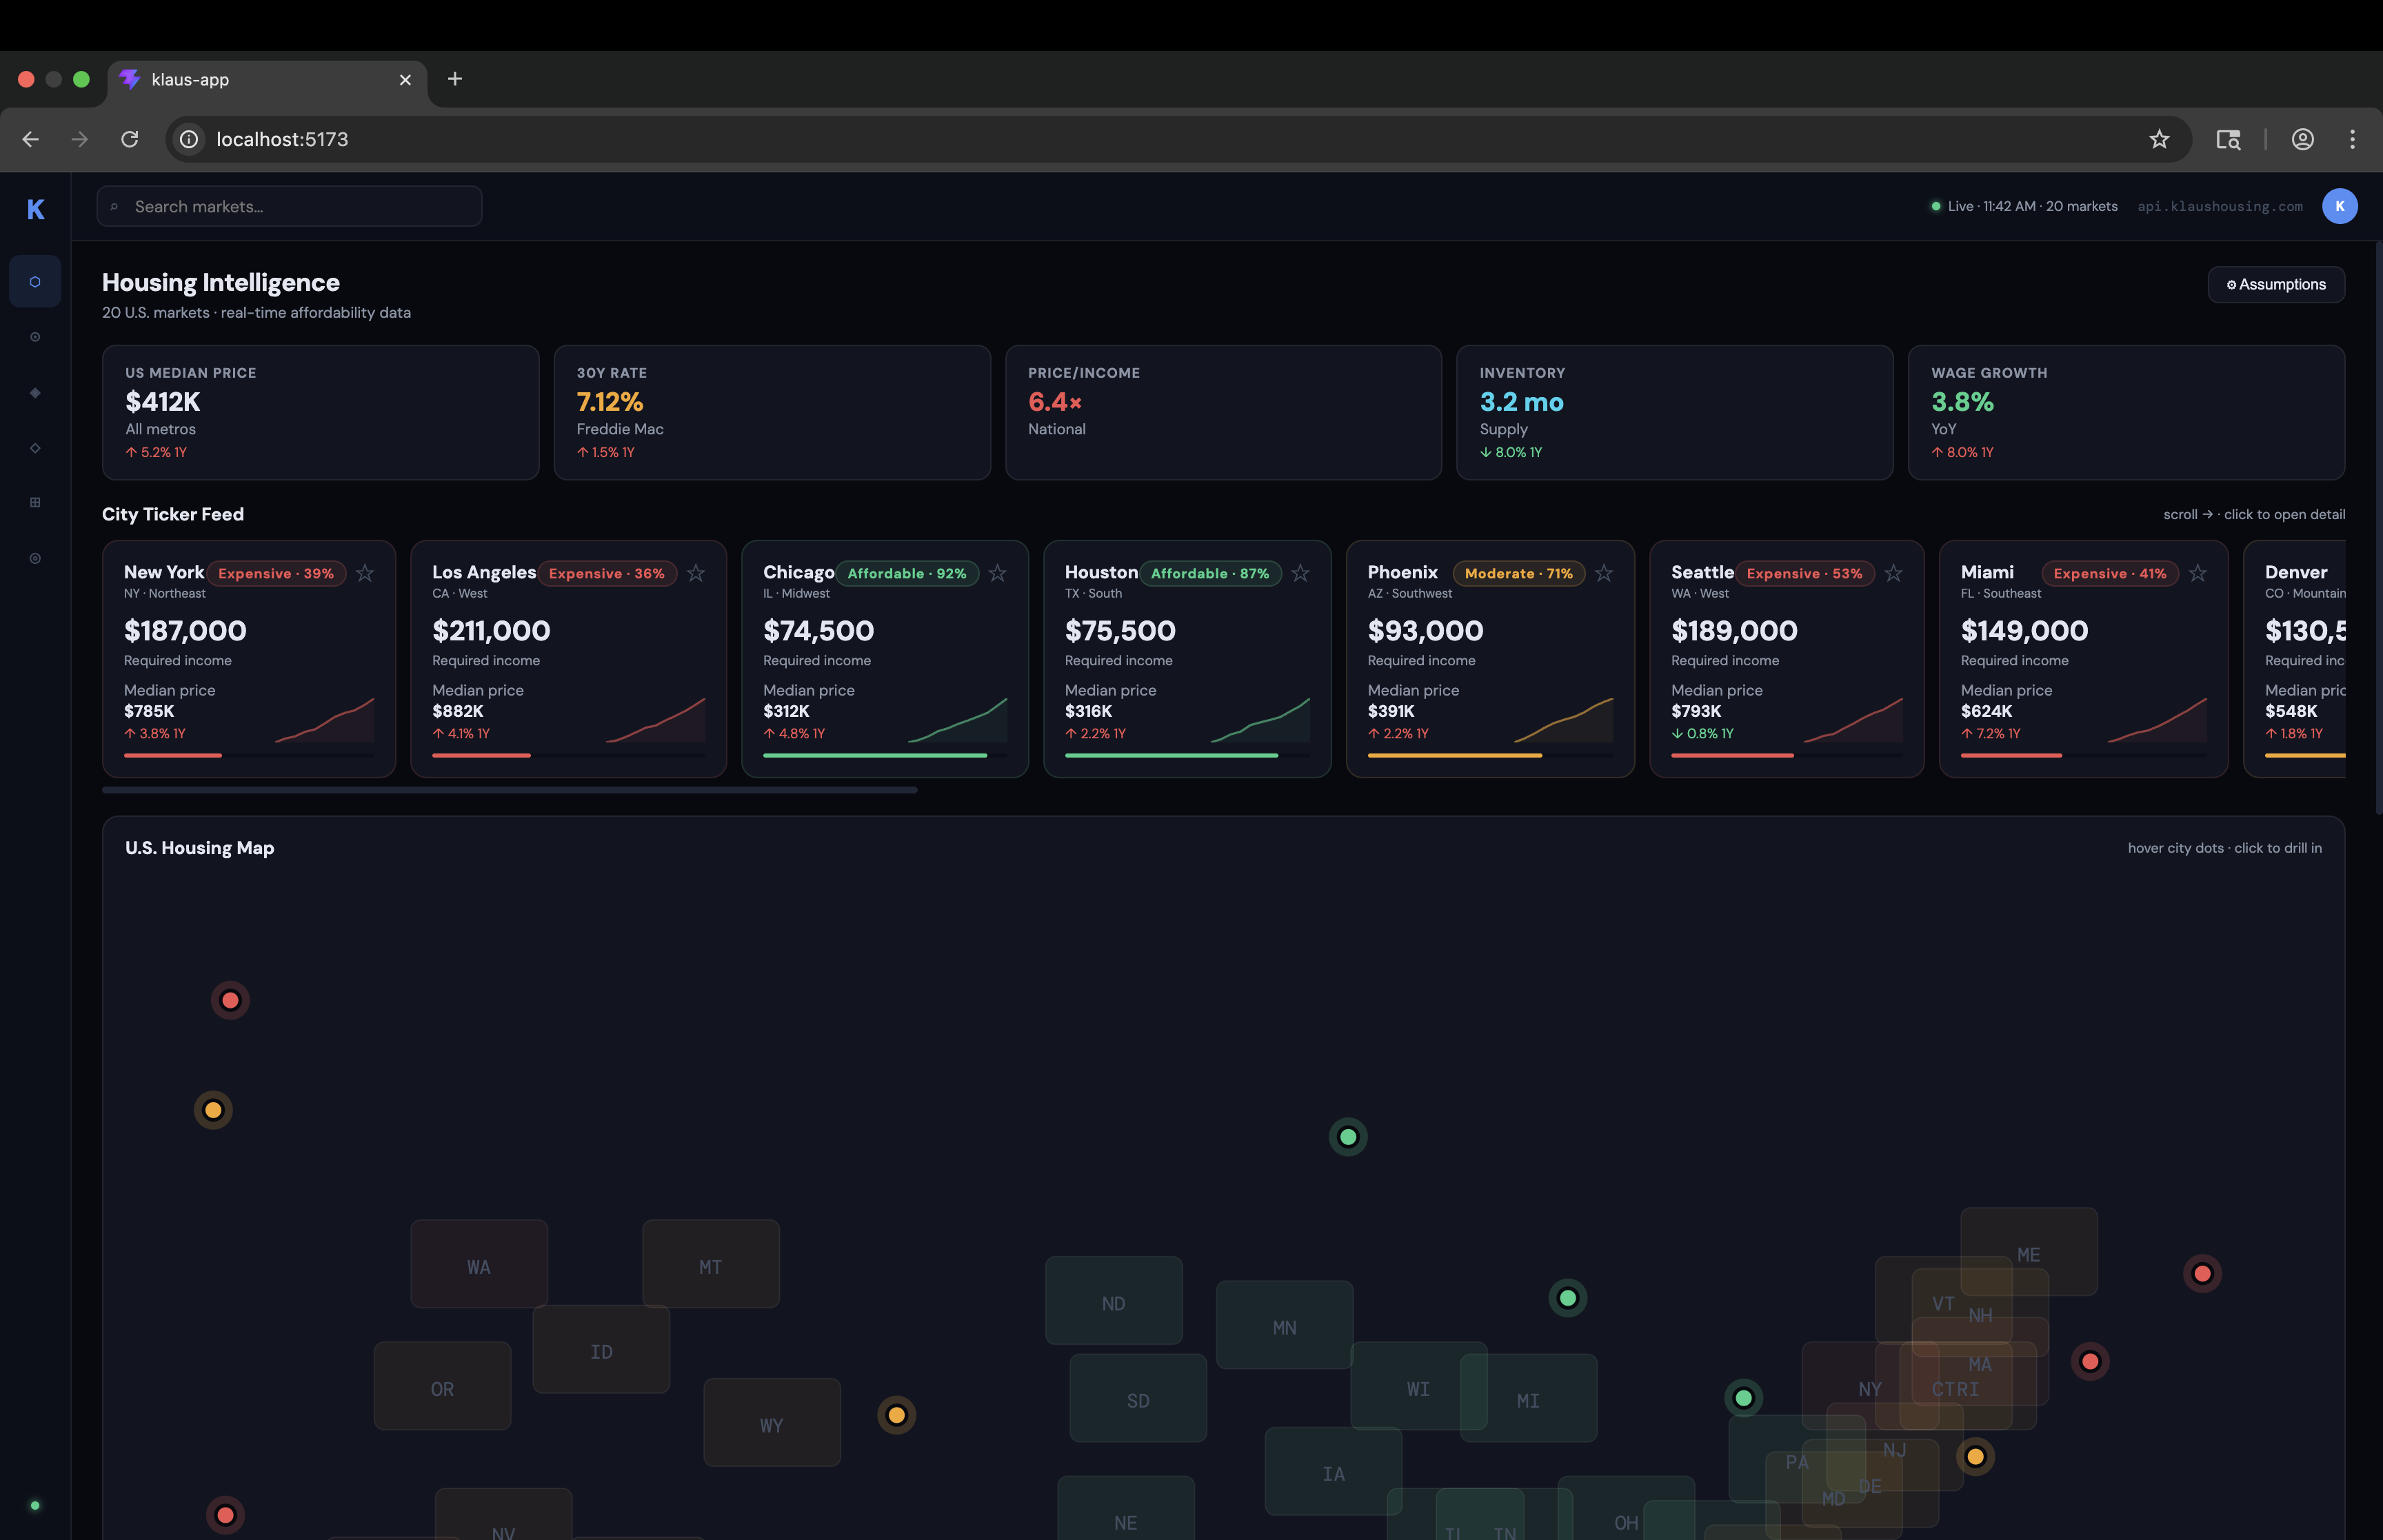
National Live Ticker Calculator w/ U.S. Heat Map
-
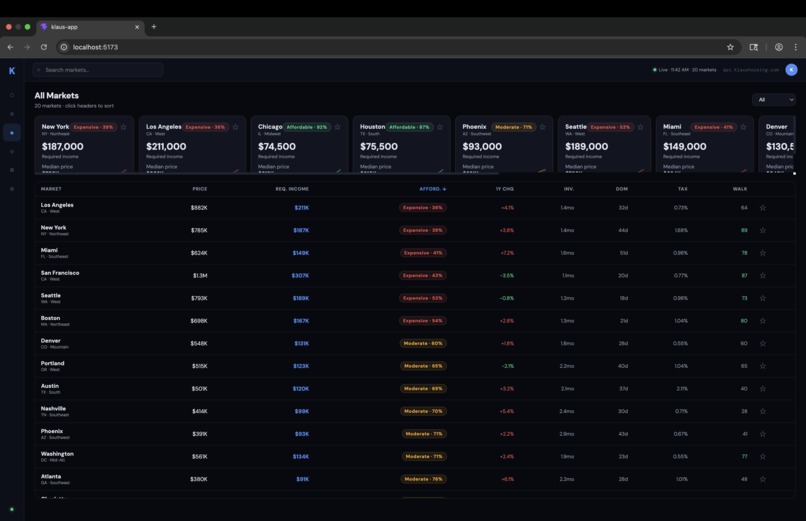
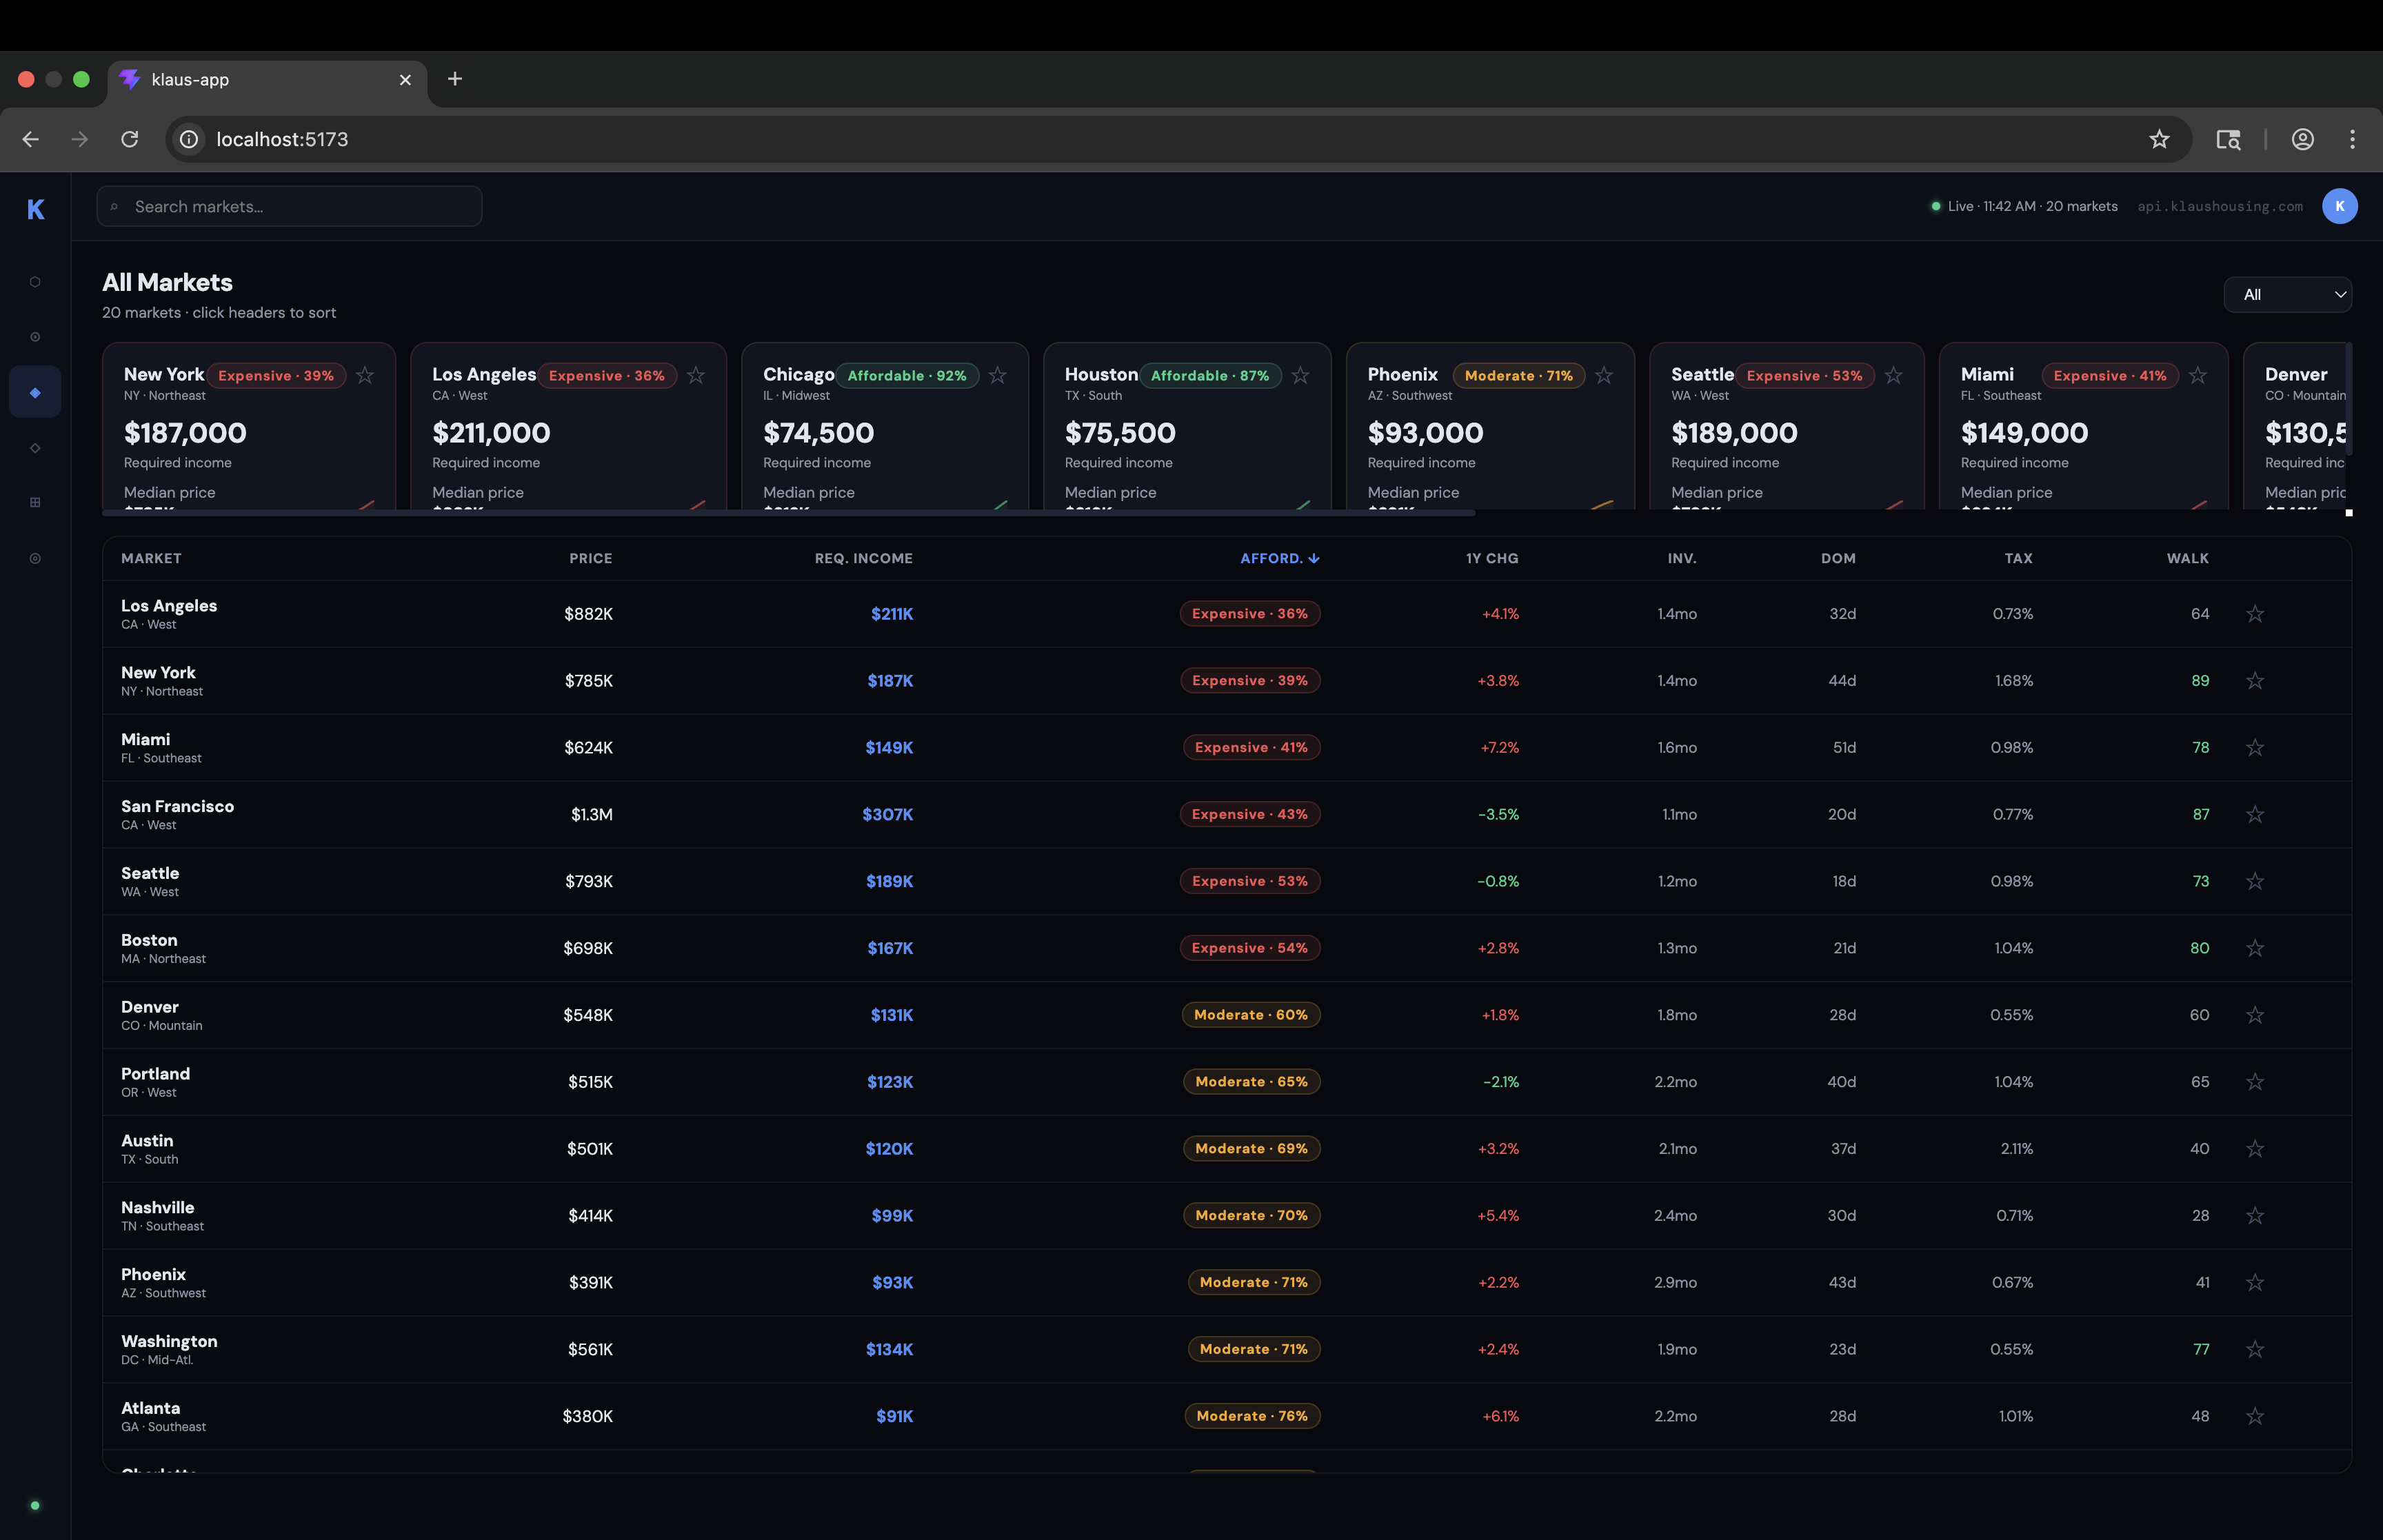
U.S. State Market Median House Price Listings
-
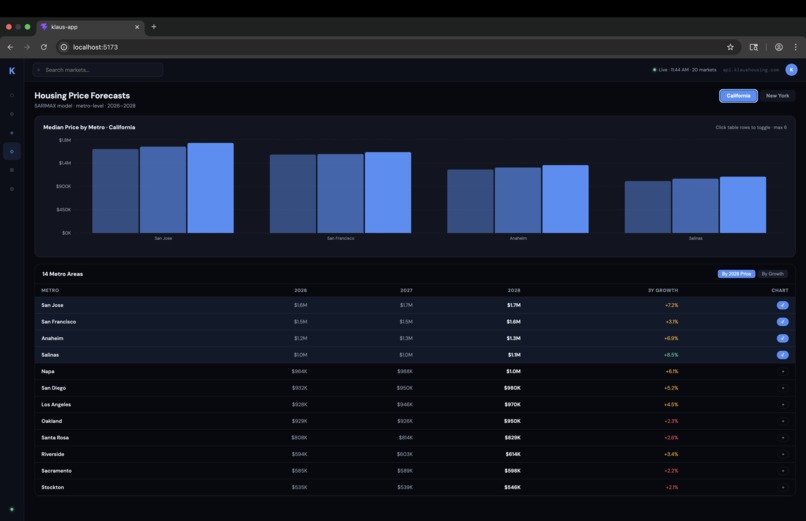
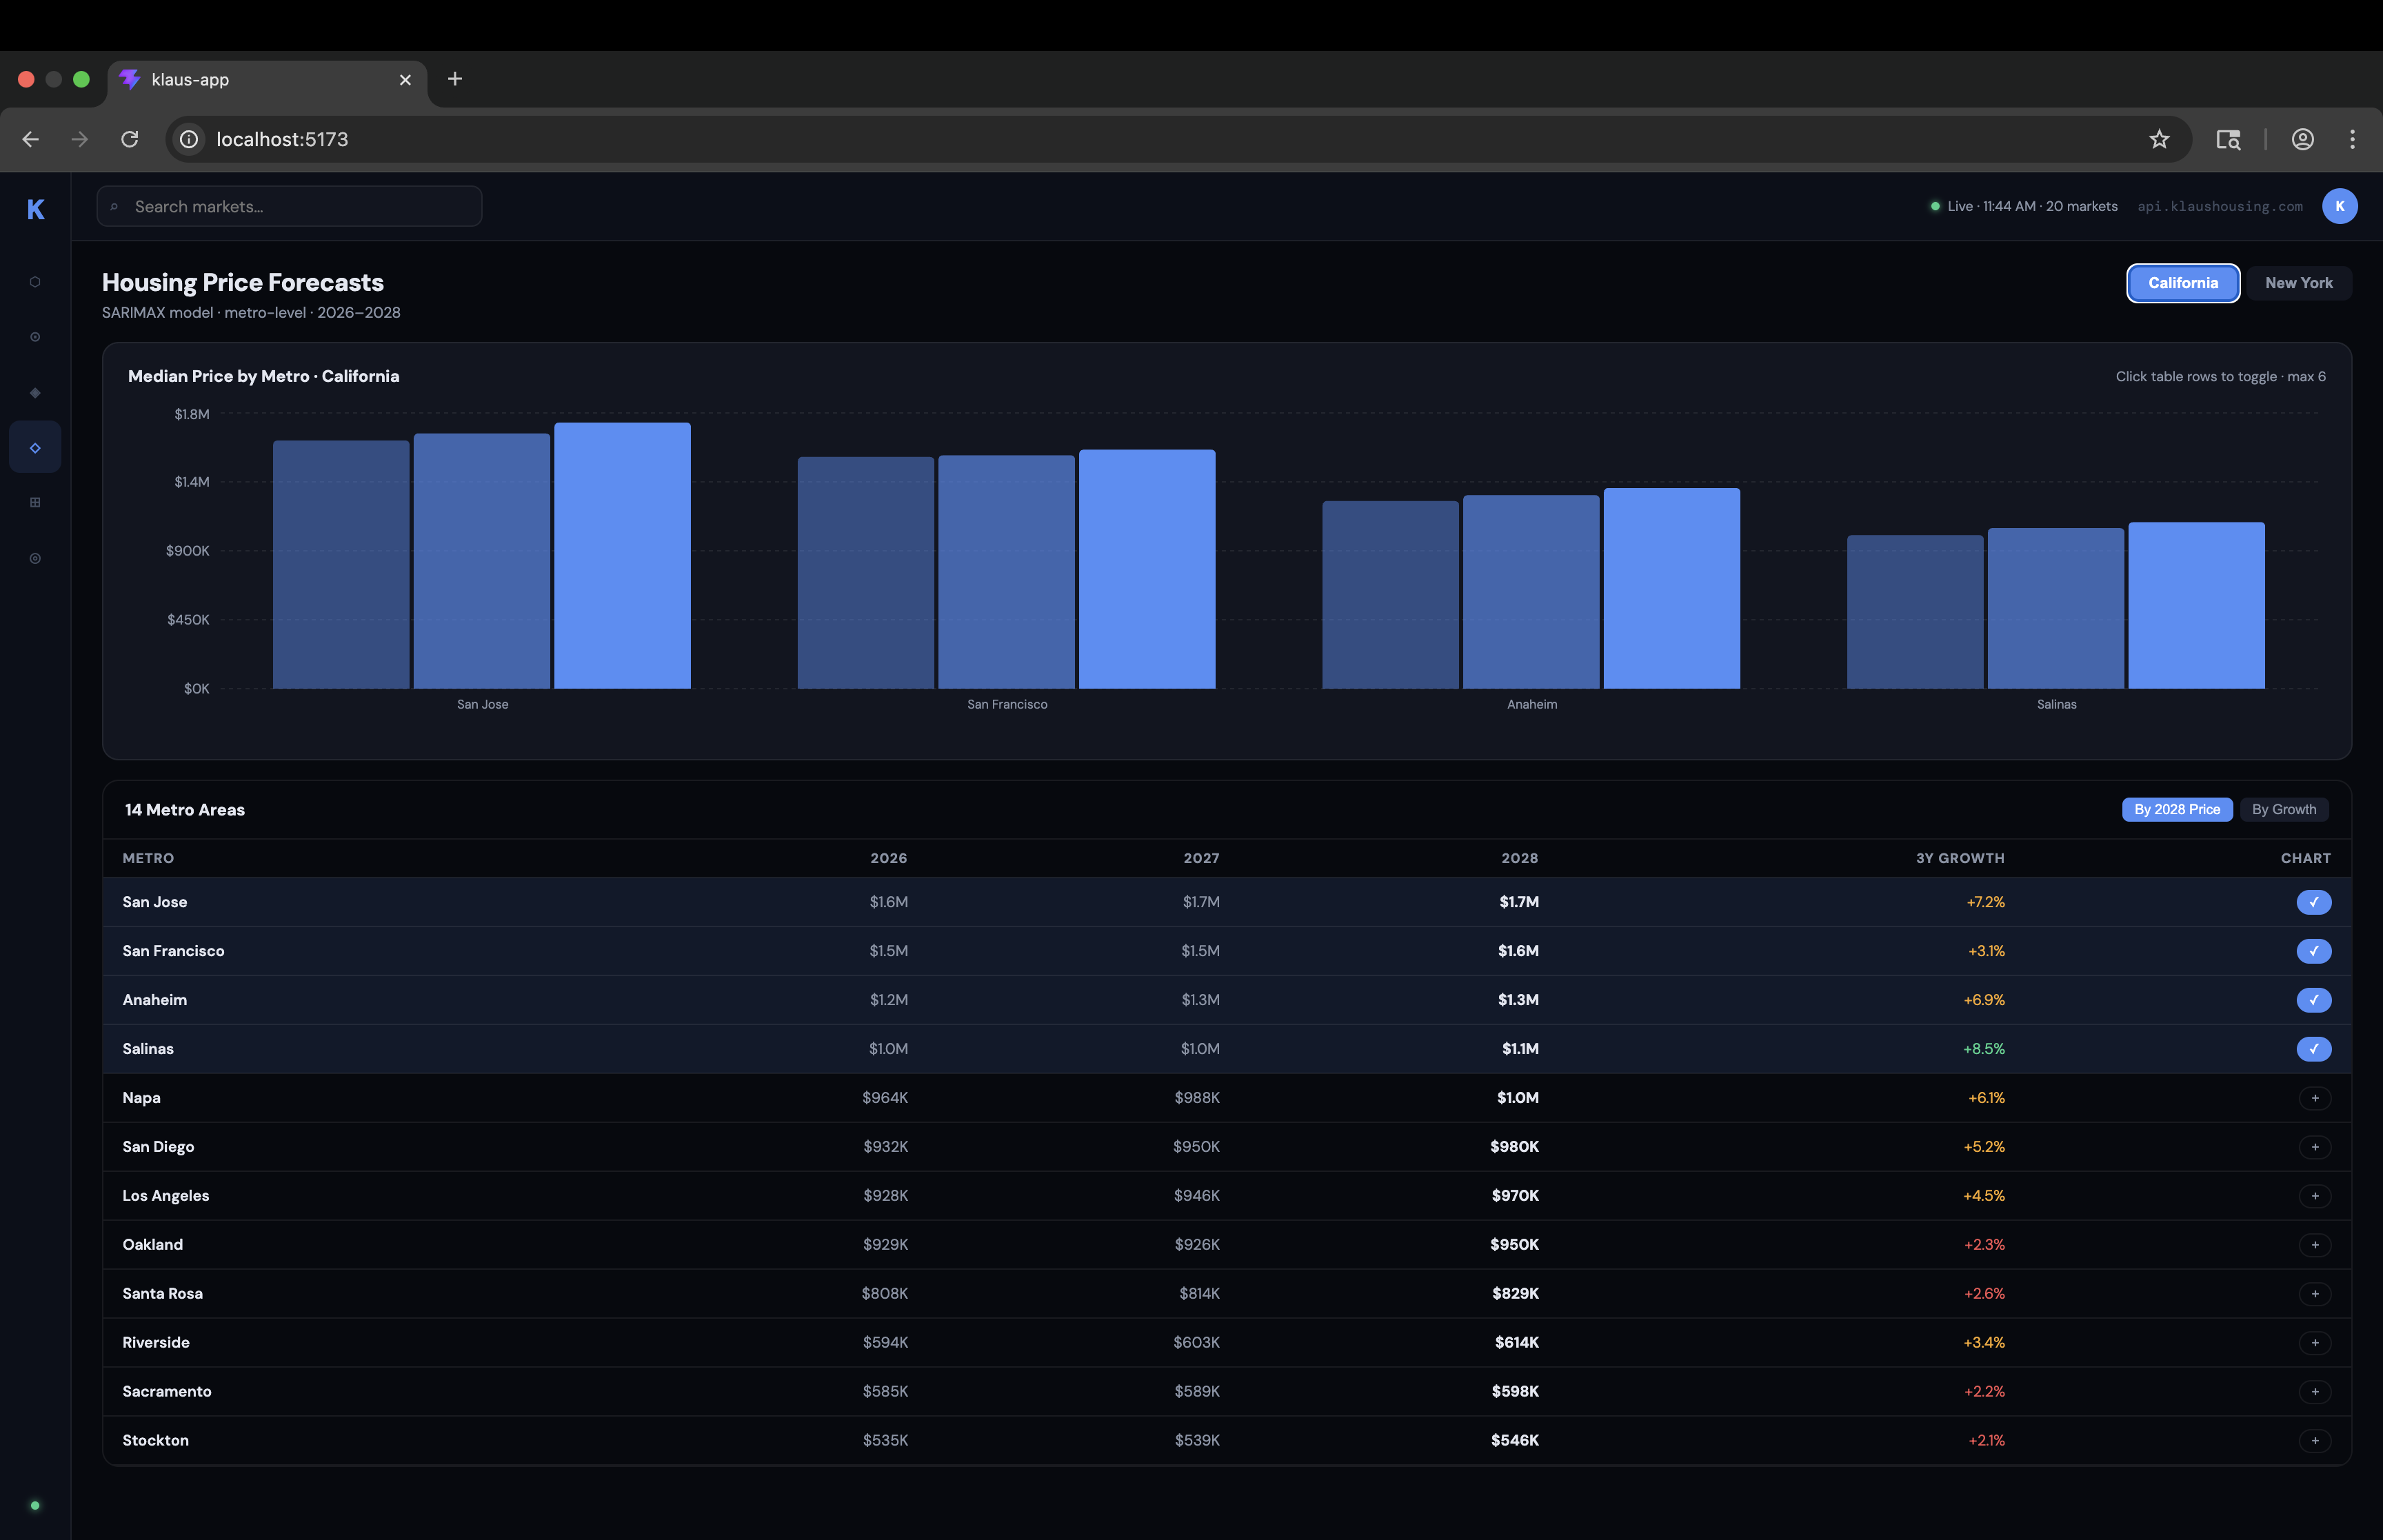
XGBoost House Price Forecasting
-
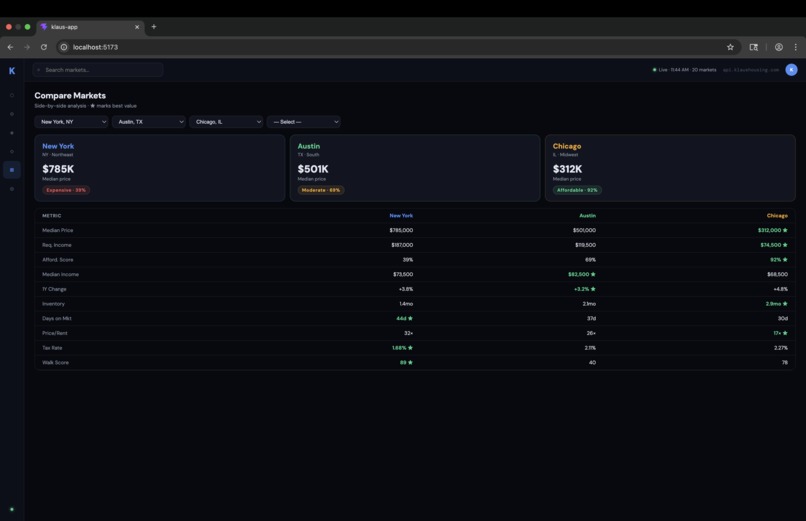
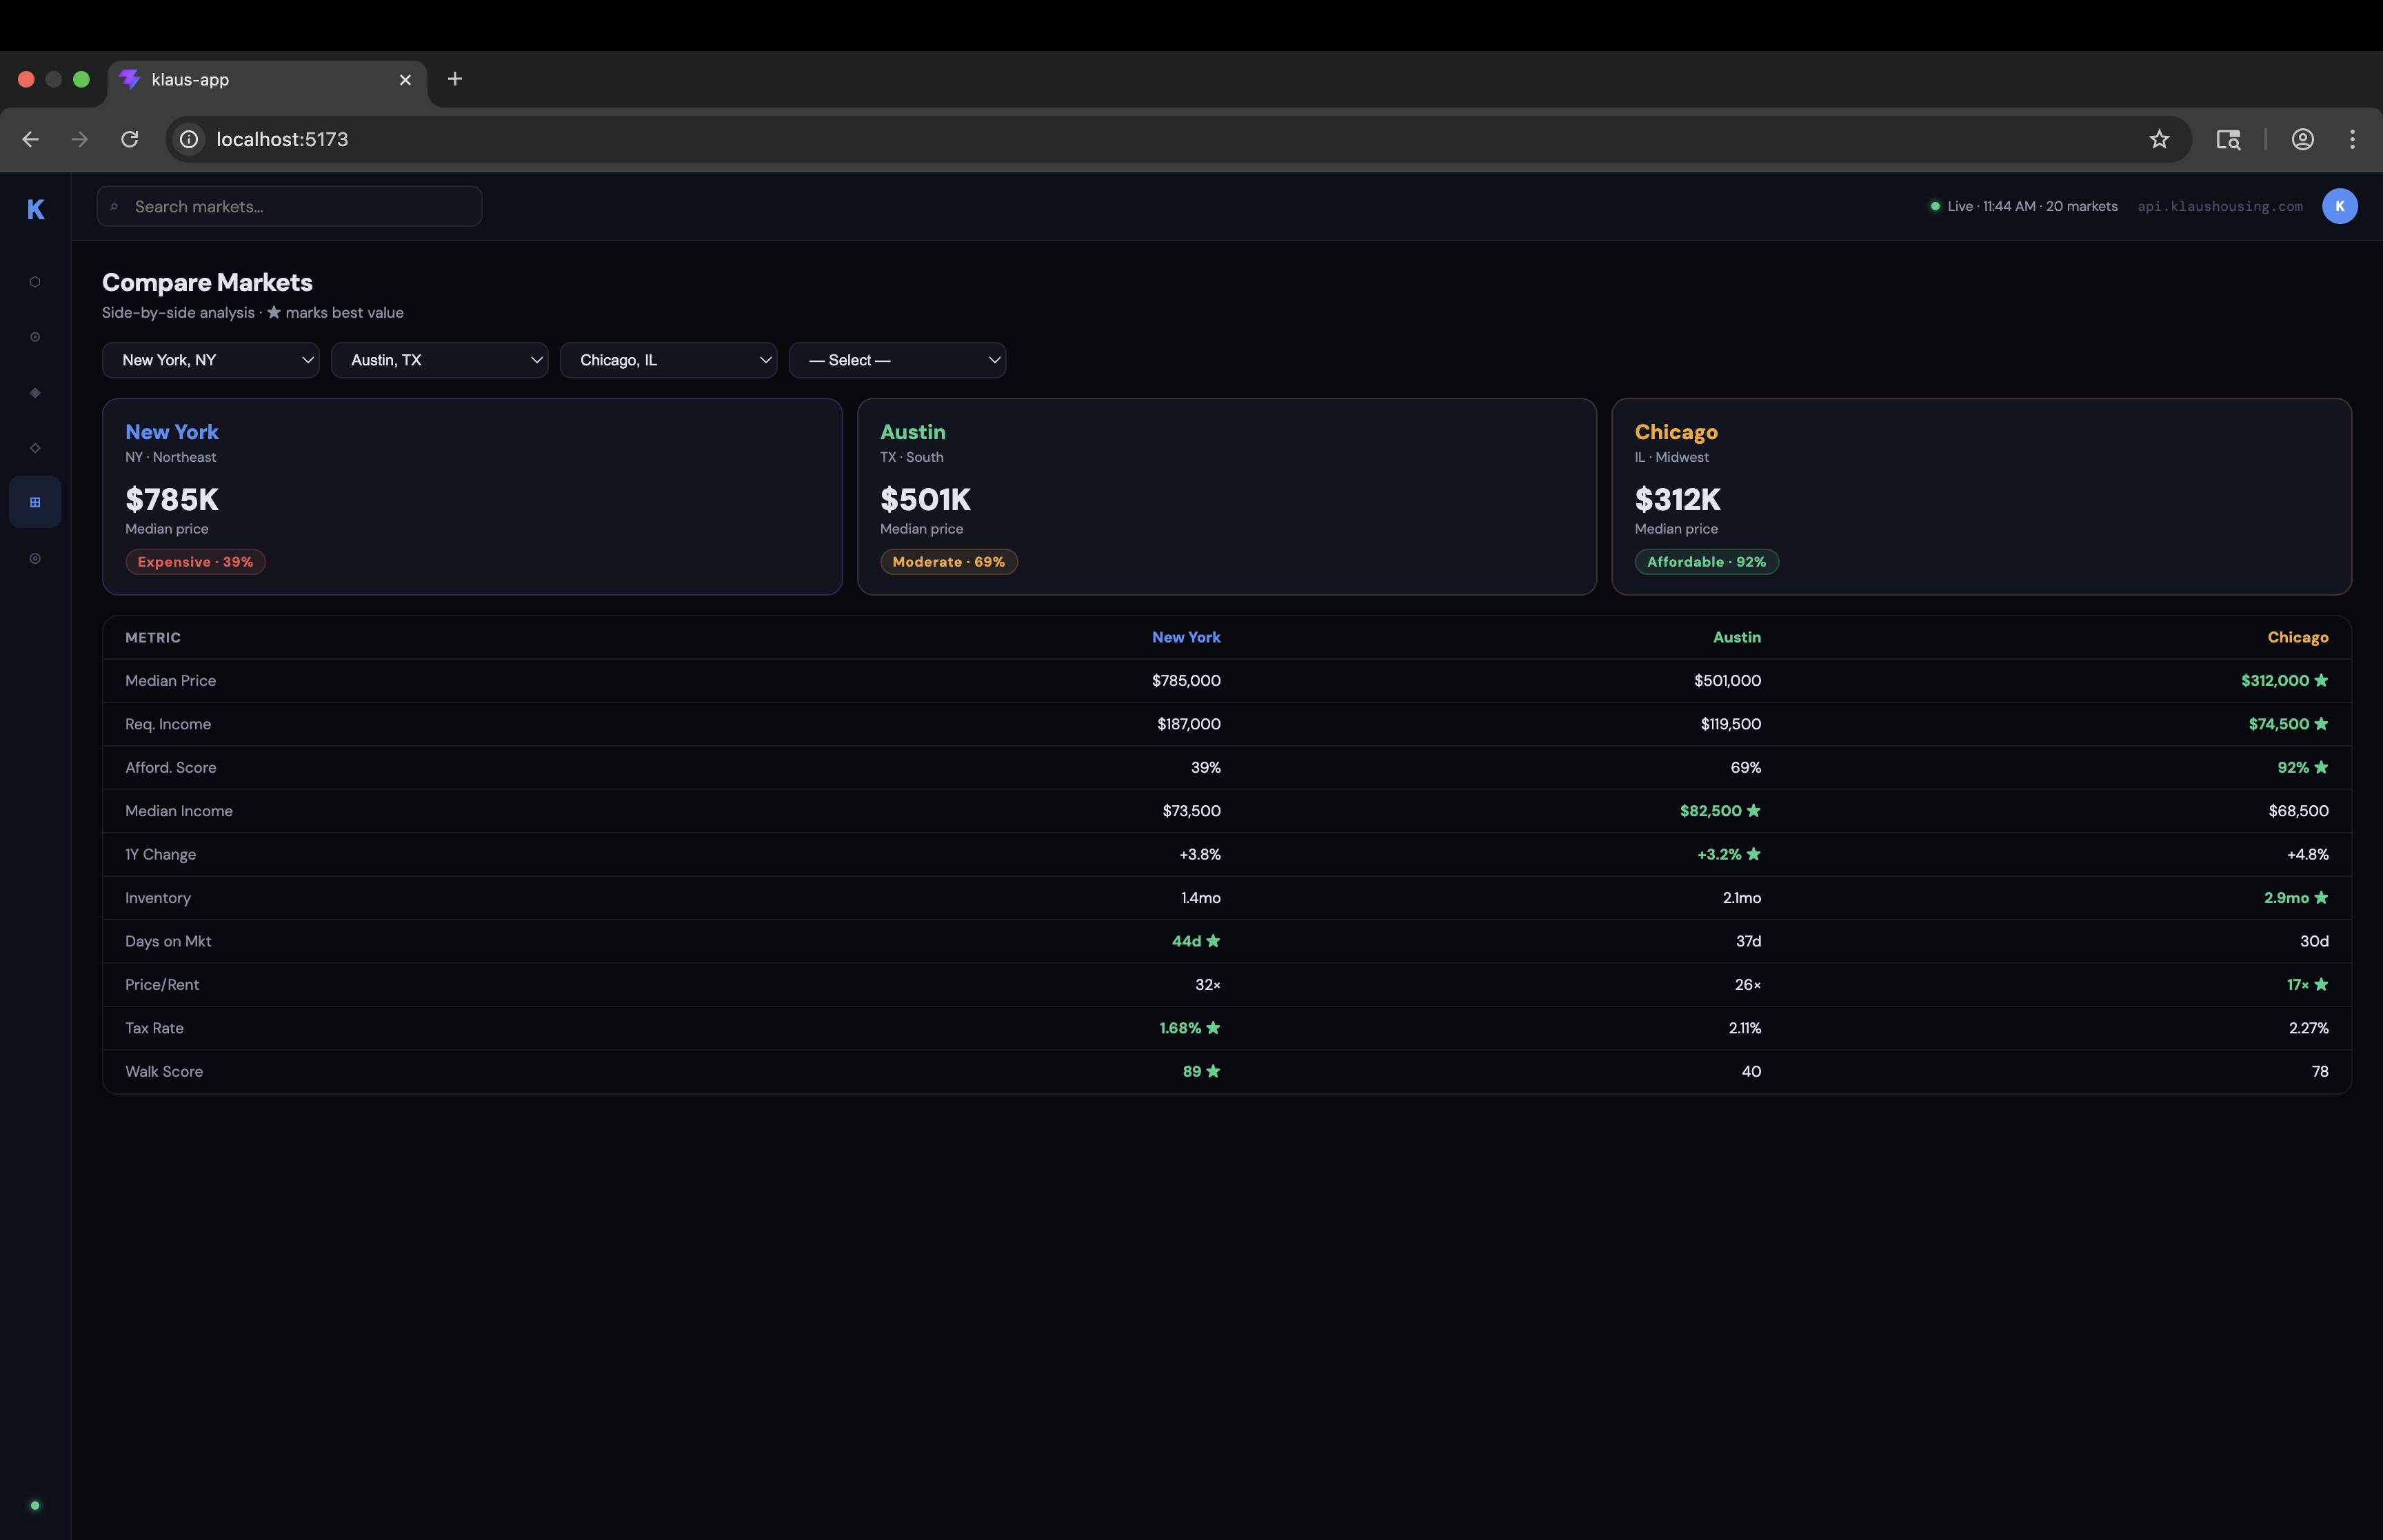
Side-by-side competitive analysis of selected markets
Inspiration
Growing up, I remember my parents trying to make sense of housing decisions late at night. They would compare listings, estimate monthly payments, and guess whether something was truly affordable. But without clear benchmarks like price-to-income ratios or forward-looking trends, those decisions felt uncertain. For many families, especially those without access to comprehensive financial tools, housing becomes a risk rather than a plan. We were inspired by platforms like Robinhood and Bloomberg that take dense financial data and make it intuitive for everyday users. We wanted to build a system that consolidates these signals and turns them into something actionable so that information and accessibility to single-family homes becomes more feasible.
What it does
Klaus helps users evaluate housing affordability using both current data and future projections. It aggregates housing price data live from the U.S. consensus bureau, economic indicators, and mortgage assumptions to compute affordability metrics such as required income, price-to-income ratios, and estimated monthly payments. Users can compare multiple regions, track affordability over time, and view forward-looking projections for housing prices from 2026 to 2028. The platform also includes persistent watchlists, dynamic dashboards, and an API layer for programmatic access.
How we built it
We built Klaus using Next.js with TypeScript and a modular component architecture on the frontend, paired with Supabase (PostgreSQL, auth, and storage) on the backend. Data ingestion is handled through a pipeline that pulls housing data from a Zillow-style dataset and enriches it with U.S. Census and Federal Reserve data, including median income, interest rates, and regional economic indicators.
We engineered features such as lagged price values, rolling averages, volatility measures, and income-adjusted price ratios. These were used to train an XGBoost regression model, which captures nonlinear relationships across regions and time. We implemented cross-validation and hyperparameter tuning (learning rate, max depth, and tree count) to stabilize predictions. Forecast outputs are stored as structured JSON in the database and served through typed API endpoints.
The frontend consumes these endpoints and renders interactive visualizations using Recharts, including time-series trends, regional comparisons, and affordability breakdowns.
Challenges we ran into
A key challenge was designing a consistent data model across sources with different granularities and update intervals. The first concern was cleaning the data to eliminate null mortgage values that would skew the affordability model. Then, we built transformation layers to map county, metro, and city-level data into a unified schema. Another challenge was ensuring model stability. Without careful feature selection and regularization, the model tended to overfit to short-term fluctuations in certain regions.
Accomplishments that we're proud of
We built a full pipeline that connects raw housing and economic data into a unified schema across regions, then translates it into real-time insights. Our feature engineering (lagged prices, rolling averages, income-adjusted ratios) significantly improved our XGBoost model’s stability and accuracy. We also integrated these predictions into interactive customer dashboards, making complex forecasts intuitive and actionable for users when deciding to purchase homes.
What we learned
We learned that strong machine learning results depend heavily on data quality and feature design. Building reliable features like rolling trends and normalized ratios had a larger impact than simply tuning the XGBoost model. We also gained experience designing systems where backend pipelines and frontend usability need to align closely in order to have an accurate and cohesive interactive UI.
What's next for Klaus
Next, we plan to integrate streaming data pipelines for local real-time updates and expand the feature set with scenario analysis tools, Zillow style network. This would allow users to simulate how changes in interest rates, income growth, or supply constraints impact affordability of their chosen houses. We also plan to improve model performance by incorporating additional signals such as migration trends and housing inventory dynamics to give an even more comprehensive view for users when viewing affordable homes.
Built With
- cron-jobs
- next.js-(react
- node.js-(api-routes)
- postgresql-(prisma)
- python-(sarimax)
- railway/render
- recharts
- redfin-style-housing-api
- redis-(caching)
- tailwind-css
- typescript)
- u.s.-census-api
- vercel

Log in or sign up for Devpost to join the conversation.