-

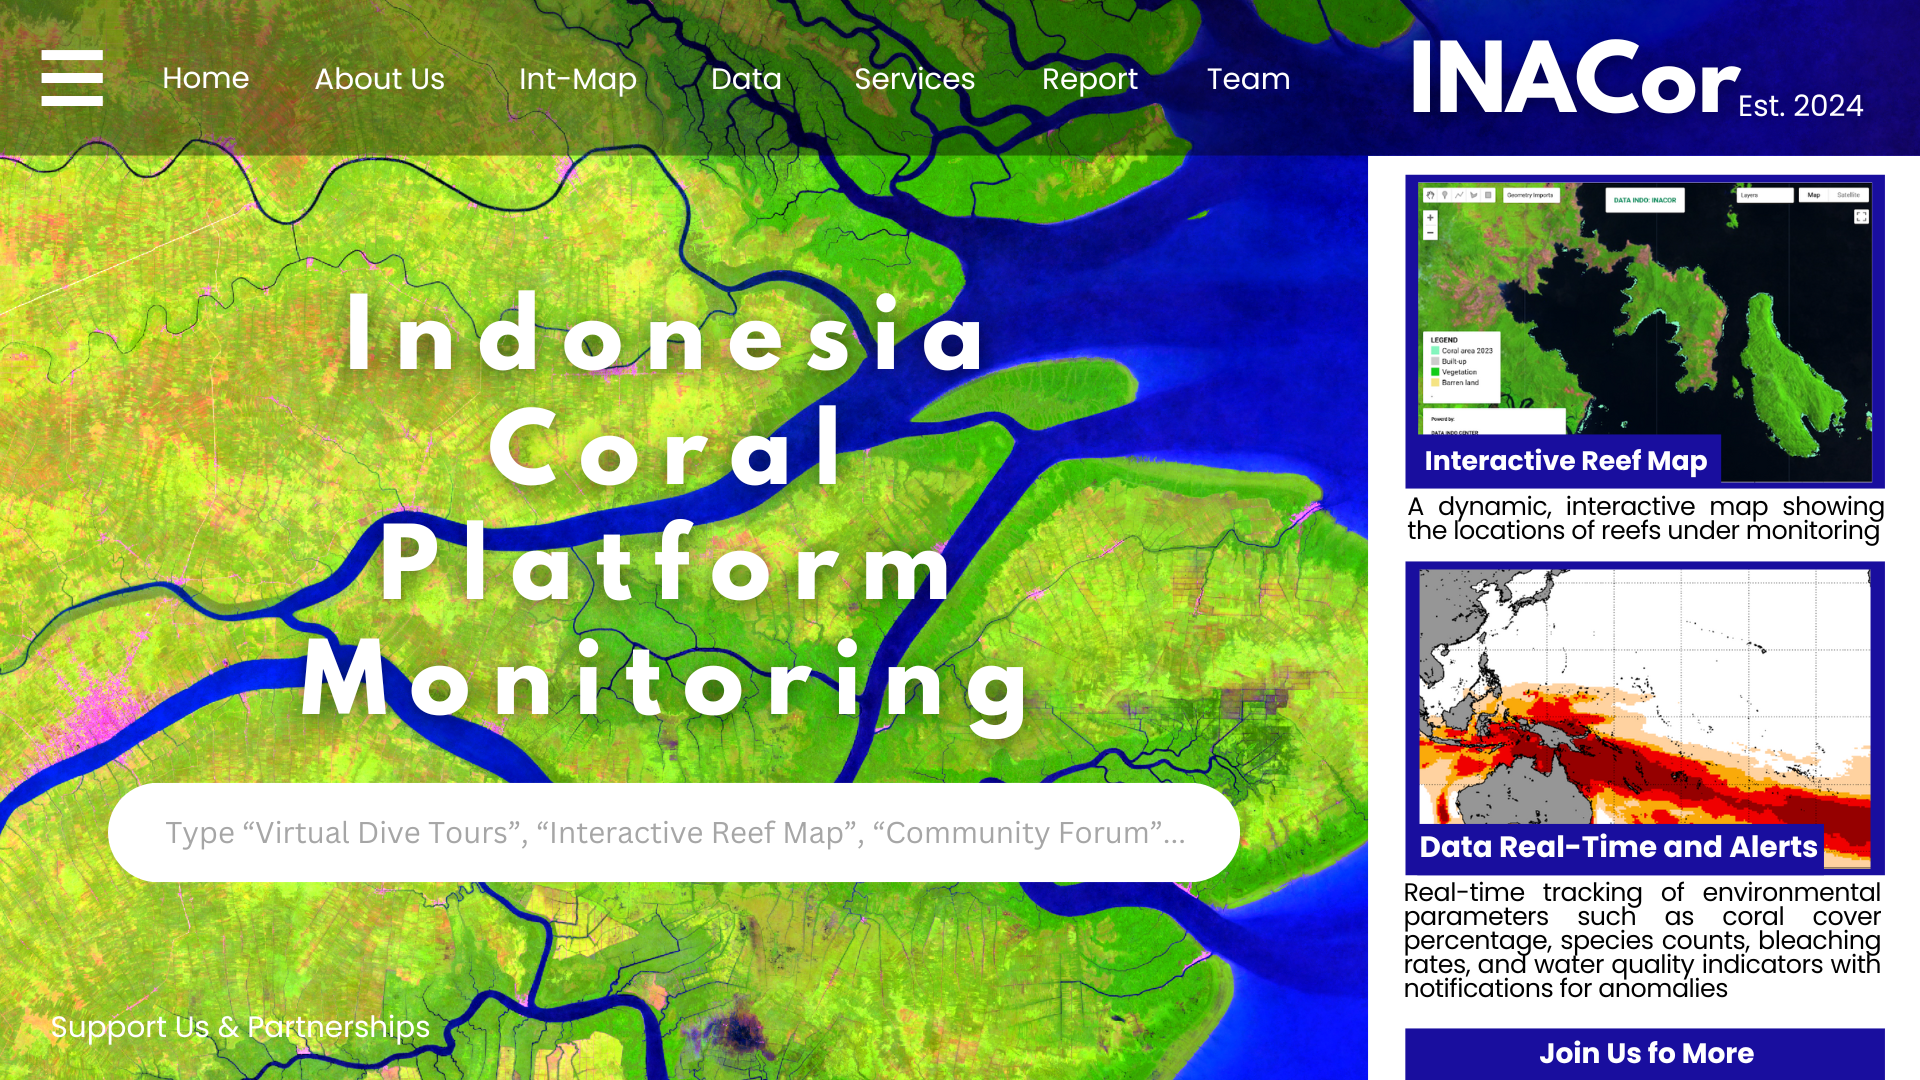
Home Website
-

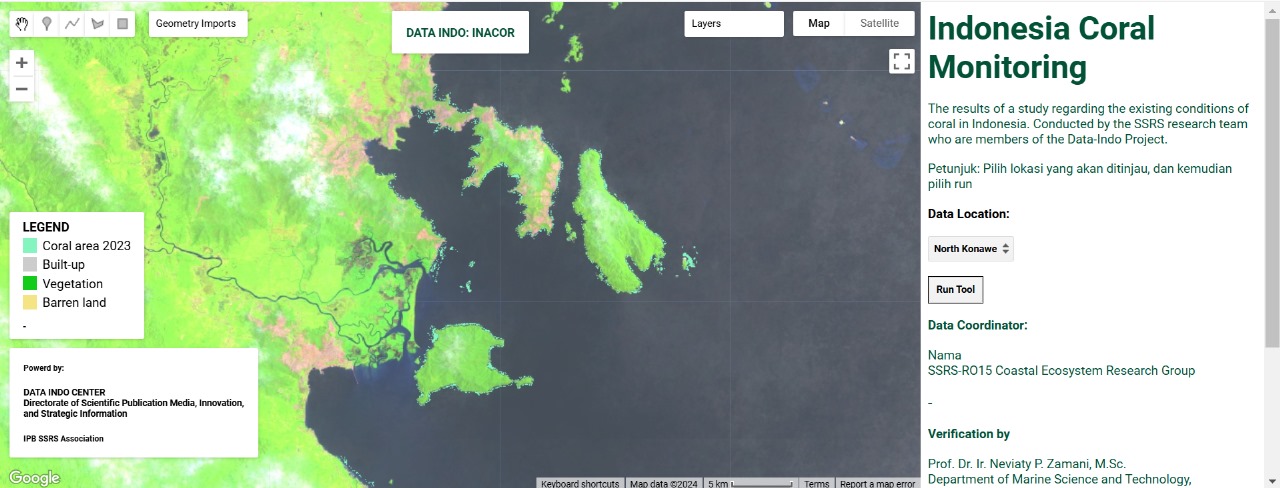
Interactive Reef Map
-
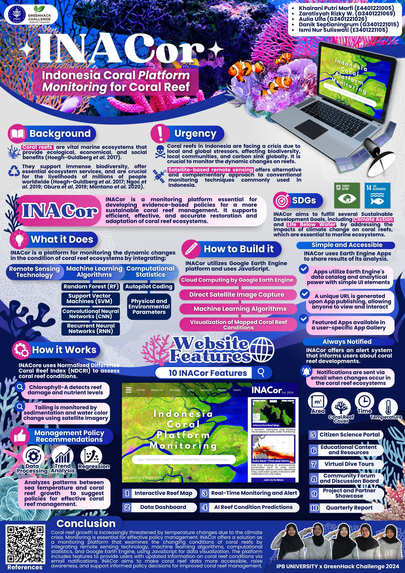
Poster
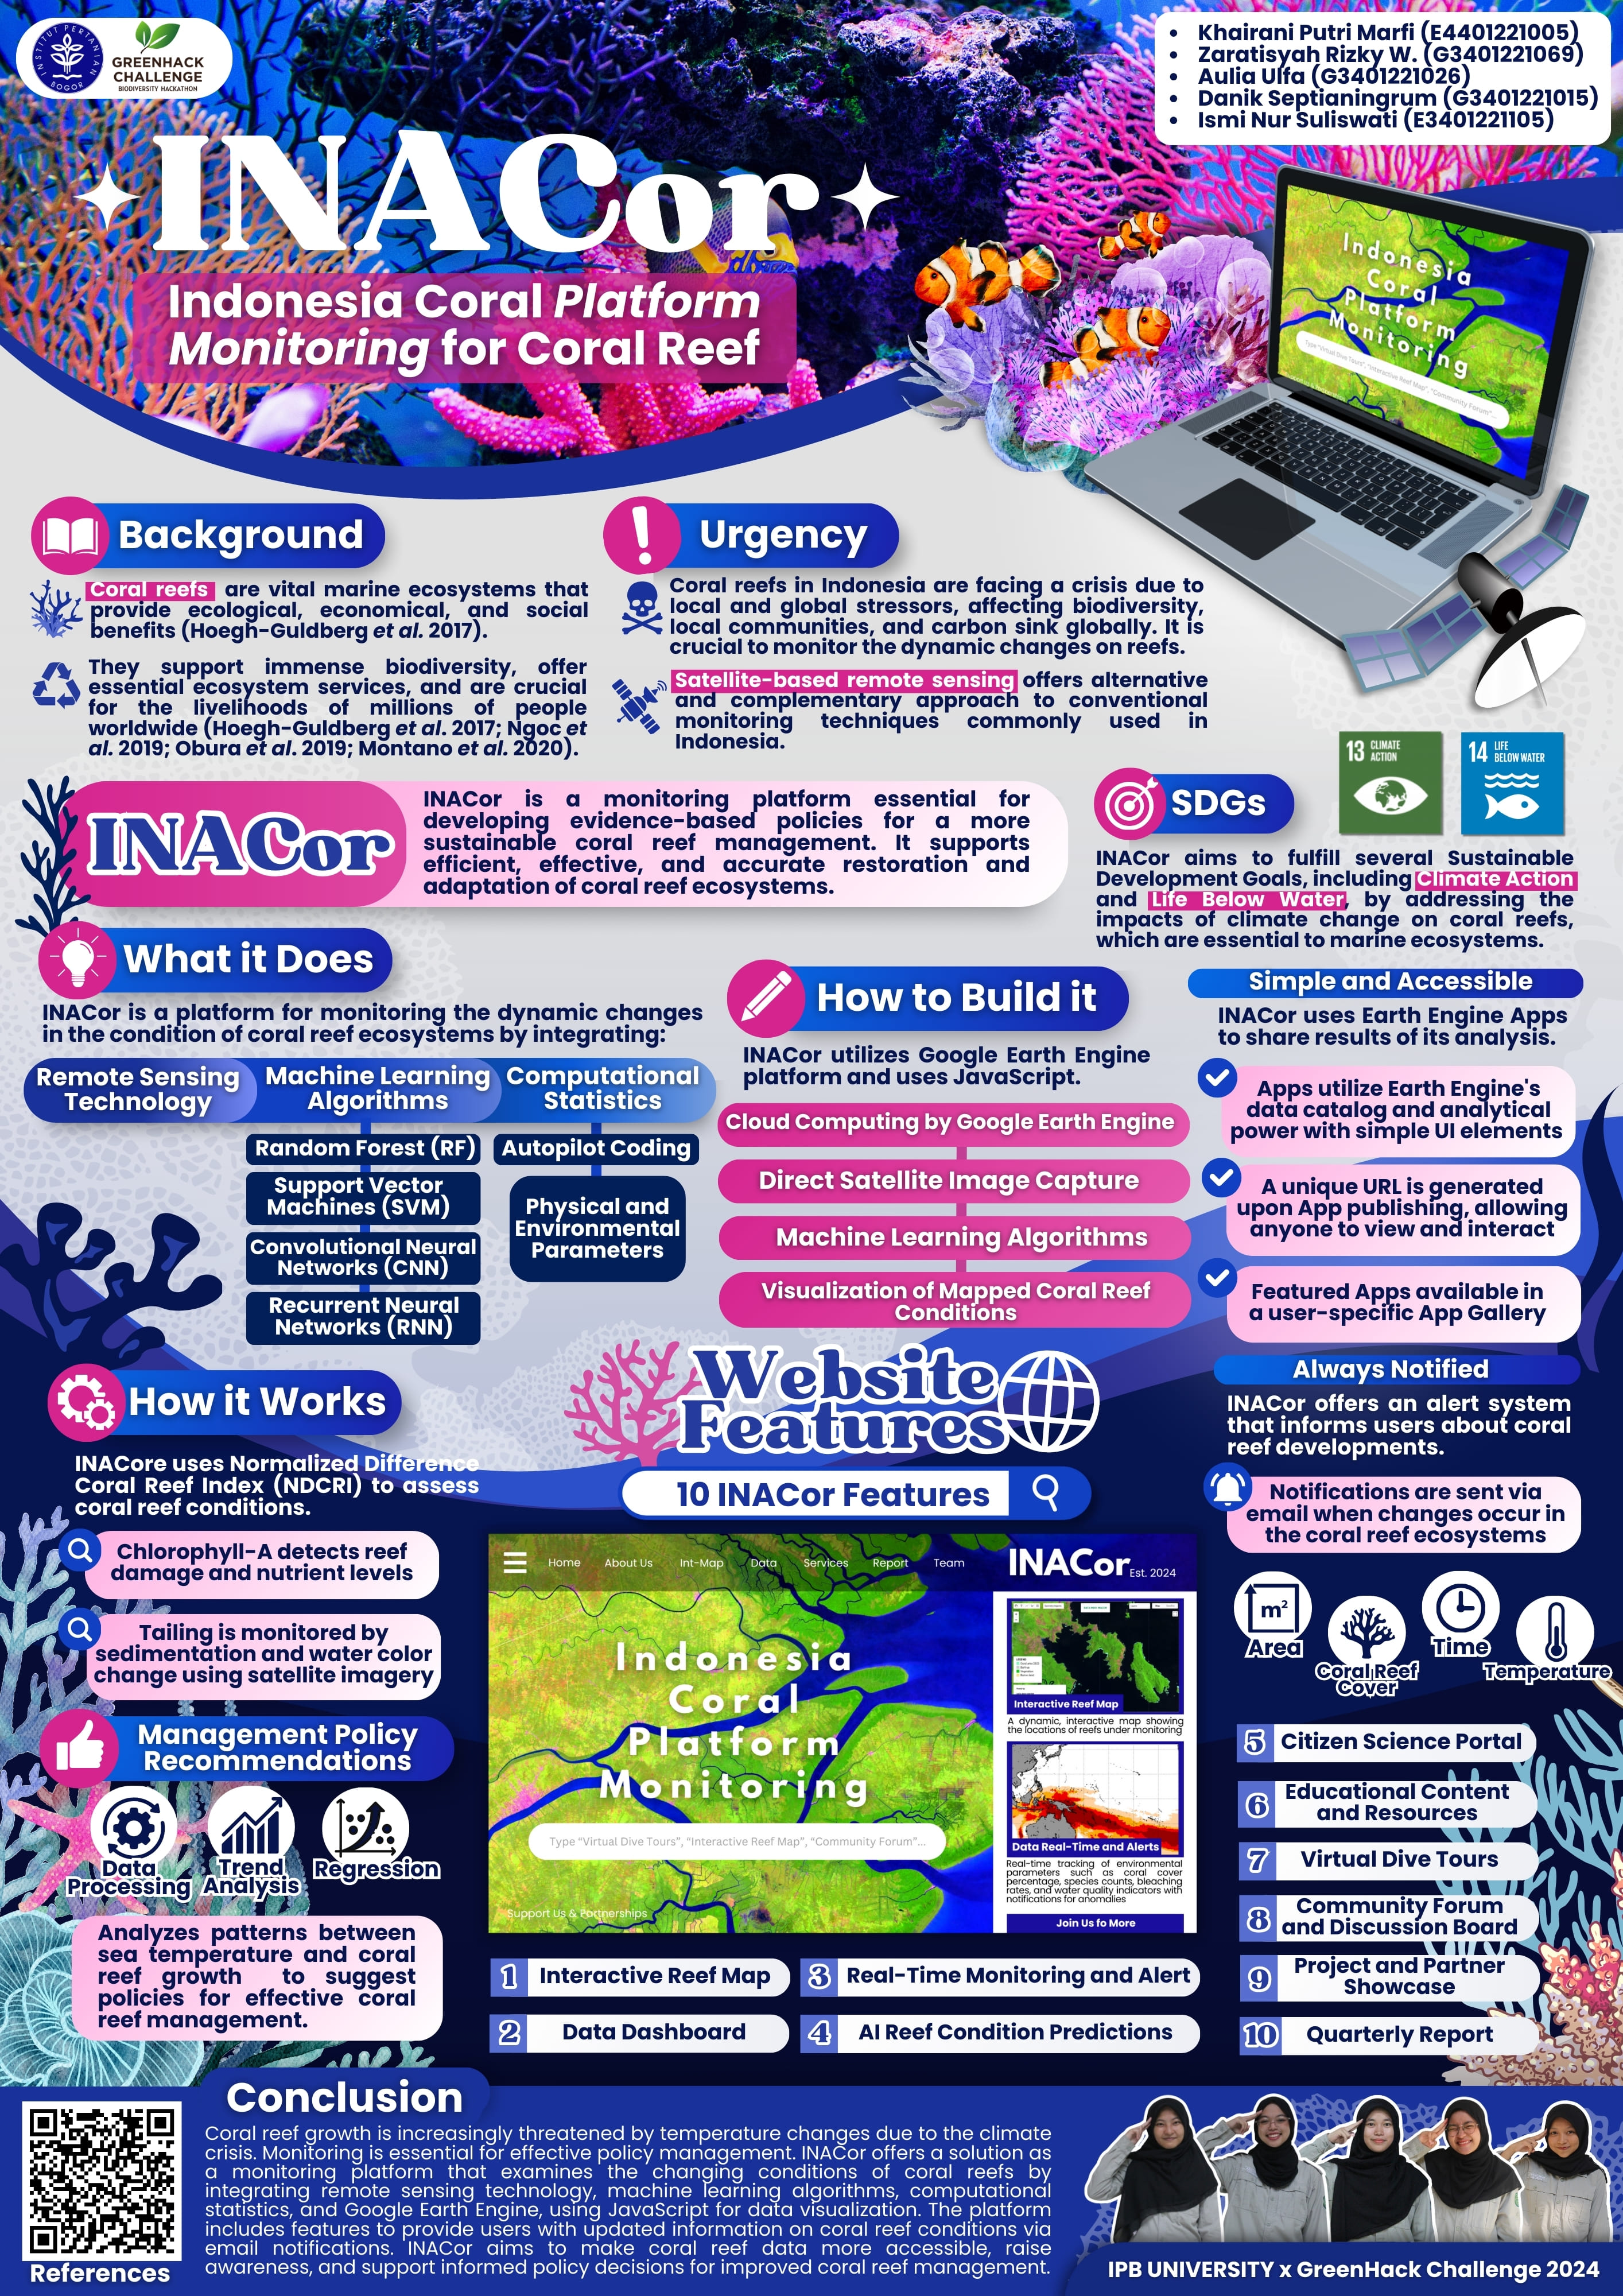
INACor: Indonesia Coral Platform monitoring for Coral Reef
Urgency
Coral reefs are vital marine ecosystems that provide numerous ecological, economic, and social benefits (Hoegh‐Guldberg et al. 2017). They support immense biodiversity (Obura et al. 2019), offer essential ecosystem services (Hoegh‐Guldberg et al. 2017), and are crucial for the livelihoods of millions of people worldwide (Cavada-Blanco et al. 2021). Coral reefs in Indonesia are facing a severe crisis due to a combination of local and global stressors. These stressors include pollution, destructive fishing practices, climate change, tailing mining, and sea level changes (Razak et al. 2022). The degradation of these vital ecosystems has significant implications for biodiversity, local communities, and carbon sink globally. It is crucial to monitor the dynamics changes on reefs, and thereby track the subsequent recovery or decline of these systems. While monitoring by field surveys provides accurate data at highly localized scales, this approach is not cost-effective for large-scale, frequent monitoring. The utilisation of satellite-based remote sensing represents an alternative and complementary approach of conventional monitoring techniques that are common in Indonesia (Hedley et al. 2016). There isn't currently a specialized platform for monitoring coral reefs in Indonesia.
INACor: Indonesia Coral Platform monitoring for Coral Reef seeks to fulfill point 13 of Climate Action and point 14 of Life Below Water as an effort to address the impacts of climate change on coral reefs, which are key species in marine ecosystems.
Therefore, InaCor is essential for developing evidence-based policies for the sustainable management of coral reefs, ensuring the efficient, effective, and accurate repair and adaptation of these ecosystems.
What it does?
InaCor is a platform that integrates remote sensing technology, machine learning algorithms, and computational statistics for the monitoring of dynamics changes in the condition of coral reef ecosystems. The spatiotemporal monitoring process is facilitated by the utilization of machine learning algorithms, including random forest (RF), Support Vector Machines (SVM), Convolutional Neural Networks (CNN), and Recurrent Neural Networks (RNN), in the processing of various combinations of indices derived from satellite bands. Furthermore, this platform is capable of providing management advice based on the results of statistical analysis conducted through autopilot coding with various parameters, such as the physical and environmental parameters of coral reefs.
How to build it?
InaCor employs the Google Earth platform to process satellite image data, facilitating the direct visualization of mapped coral reef conditions. GEE, which is based on cloud computing, enables the direct capture of images from satellites and subsequent processing through the application of diverse machine learning algorithms, thus facilitating the generation of results. The programming language utilized in the construction of InaCor is JavaScript. InaCor utilizes the Earth Engine apps to disseminate the results of its analysis. Earth Engine Apps are dynamic, shareable user interfaces for Earth Engine analyses. These Apps facilitate the utilization of Earth Engine's data catalog and analytical power through the use of simple UI elements, allowing experts and non-experts alike to leverage the platform's capabilities. Apps published from Earth Engine are accessible from the application-specific URL generated at the time of publishing. No Earth Engine account is required to view or interact with a published App. Additionally, Apps that have been selected as featured by their creator are also available at a user-specific App Gallery.
The notification alerts computing system on the InaCor platform is a notification system in the form of notifications sent to each account owner when there is a change in the condition of the coral reef ecosystem. This notification alert is obtained via email integrated with the account on the InaCor platform. This system will detect the condition of the coral reef ecosystem when there is a decline in health and vulnerability of the coral reef. The purpose of this notification alerts computing system is so that each user can find out about the development of coral reefs, so that conservation steps can be taken quickly.
How it works?
InaCor is a Google Earth Engine (GEE)-based platform that utilizes satellite data as well as a processing tool with indexes used in machine learning to monitor the condition of coral reef ecosystems. Collection and integration of satellite data GEE has big data in the form of spatial information and satellite imagery with high-quality cloud computing. This satellite data can also be used in water areas. Thus, GEE allows for easy data search without having to download the data first because it is already available in the cloud. Indexes and machine learning algorithms The index used in InaCor is the Normalized Difference Coral Reef Index (NDCRI) to determine the condition of coral reefs. NDCRI features both the highest diagnostic precision and amplitude (Collin et al. 2014). This index calculates the spectral difference between colors and components in satellite imagery related to coral reef health. In addition, there are chlorophyll-a measurements that can determine damage to coral reef ecosystems and increased nutrient concentrations (Faizal 2023), as well as tailing monitoring by observing increased sedimentation and water color using satellite imagery. The machine learning algorithm is trained using these three indices with JavaScript, so that changes or damage to coral reefs can be detected. Use of machine learning models in the cloud Machine learning can help in the classification and monitoring of coral reefs based on satellite data. Algorithms in GEE such as Random Forest, K-Means Clustering, and Convolutional Neural Networks (CNN) can be applied to classify according to coral reef conditions.Sea surface temperature (SST) and reef growth data from satellite images are collected and data preprocessing is carried out by ensuring the images are well aligned and removing pixels that affect clouds using an algorithm. Temperature data and coral reef health indices are also normalized for better data analysis. Earth engine is carried out to extract temperature and coral growth data from certain study areas and certain time periods to see trends. Analysis of the existing data was then carried out by regression using temperature as the independent variable and coral reef cover as the target. The data set is divided into training data and testing data for model performance. The coefficient model is reviewed to measure the effect of temperature on coral reef growth. The relationships and patterns found in the data are visualized in the form of graphs and maps using GEE. Based on the results of data analysis and visualization, conclusions are presented regarding the impact of temperatures due to the climate crisis on coral reef growth. From these conclusions decisions are made regarding recommendations for coral reef management policies.
Work Flow
The results of data analysis showing changes in coral reef growth as a result of climate change or other updated information from the website, the system will record this information such as temperature changes, changes in coral reef cover, time, area, and other relevant detailed information. Website customers who have registered their accounts via e-mail are integrated into the system and stored in the database to receive notifications regarding the latest information from the website. When there is new information and changes are detected, the system will prepare an email containing the latest information regarding the changes which are generally packaged more concisely and accompanied by links for further information. Through the email delivery service, the system will send a notification email to the account address registered in the database. The system then records all email deliveries for future monitoring.
How to Built Features
The InaCor website has 10 specific integrated features that include specific information regarding the distribution and changes in coral reefs over a certain period of time and study area. InaCor features include 1) Interactive Reef Map, to show the location of monitored coral reefs, 2) Data Dashboard a feature to display data related to the percentage of coral cover, coral bleaching levels, and water quality indicators, 3) Real-time Monitoring and Alert, InaCor's feature to monitor changes in environmental indicators, especially pH and temperature in real time accompanied by notifications when there are anomalies or abnormalities, 4) AI-Based Reef Condition Predictions, a feature in the form of a model based on AI to predict future coral conditions based on the current conditions of the coral habitat environment, 5) Citizen Science Portal, a feature for citizens such as divers, researchers, and other parties to upload current conditions in areas that have been touched or coral habitat areas that have never been touched, 6) Educational Content and Resources, an educational feature in the form of posters, articles, or videos regarding information on coral cover, threats, and coral reef conservation actions, 7) Virtual Dive Tours, a virtual dive feature for website visitors in the form of photos or videos, 8) Community Forum and Discussion Board, a feature for scientists, divers, and the public in asking and discussing about coral reef health and information about its habitat environment, 9) Project and Partner Showcase, a special feature for collaboration programs, current projects, and the latest scientific discoveries about coral, 10) Quarterly Report, a summary feature related to coral reef health conditions and changes that are easy to access and download.
Whats on website?
Interactive Reef Map: A dynamic, interactive map showing the locations of reefs under monitoring. Function : Users can click on reef sites to view live or historical data, see recent photos, and explore environmental stats (e.g., water temperature, pH, species diversity). Data Visualization : Include visual indicators (color-coded markers) for reef health, recent observations, and areas needing urgent attention, equipped with legend. Spesification : displays the GEE analysis result map, has several components: Run tools: tool for running algorithms on specific geometric areas Geometry import: tool for drawing the geometry to be analyzed Legenda: Map information display component (color-coded) Data location: tool to select the location to be analyzed Display option: tool to select map view
Data Dashboard: A dashboard displaying key metrics, such as coral cover percentage, species counts, bleaching rates, and water quality indicators. Function : Users can filter data by date, specific reef locations, or parameters. Interactive Graphs : Enable users to compare historical data, set alerts for threshold limits, and download datasets for offline analysis.
Real-Time Monitoring and Alerts: Real-time tracking of environmental parameters like temperature and pH with notifications for anomalies. Function : Allow users to subscribe to specific reefs and receive alerts via email when certain conditions, like high temperatures (potential bleaching events), are met.
AI-Based Reef Condition Predictions: A predictive model powered by AI that forecasts reef health based on environmental factors and historical trends. Function : Provide future projections of coral health, showing potential areas of concern, and offer guidance on mitigation strategies.
Citizen Science Portal : A platform where divers, snorkelers, and tourists can submit their own observations and photos to update the latest conditions of both touched and untouched area. Function : Include a simple form for submitting photos, location, and observations (e.g., bleaching, pollution, fish sightings). Verification System : Use AI and IoT for expert validation to confirm data accuracy and avoid misinformation.
Educational Content and Resources : An educational section with articles, videos, and infographics about coral reef ecology, threats, and conservation methods. Function : Include content for different knowledge levels (beginner to advanced) and interactive quizzes or mini-games to engage users in learning about coral reefs.
Virtual Dive Tours: Virtual dive experiences using 360-degree photos or videos. Function : Allow users to "dive" into specific reefs from their screens, explore coral species, and learn about biodiversity hotspots through clickable points to prevent damage to coral reefs in areas restricted by conservation.
Community Forum and Discussion Board: A forum where scientists, divers, and the public can discuss coral health, share experiences, and ask questions. Function : Encourage collaboration, share conservation methods, and feature expert Q&A sessions or live talks.
Project and Partner Showcase: Highlight ongoing projects, collaborating institutions, and research findings. Function : Add links to related resources and research articles to create a well-rounded knowledge base.
Quarterly Report : Generate downloadable summary reports of reef health and changes. Function : Include easy-to-read visuals and a breakdown of monitoring data to show progress or alert for needed interventions.
Conclusion
The growth of coral reefs is increasingly threatened due to changes in temperature from the climate crisis. Monitoring needs to be carried out to determine appropriate policy management. InaCor is a solution in the form of a platform that can monitor the changing conditions of coral reefs due to the climate crisis. InaCor integrates remote sensing technology, machine learning algorithms, and computational statistics as well as, employs Google Earth Engine, and uses JavaScript to visualize coral reef conditions. The InaCor platform is equipped with related features to provide the update information regarding the condition of coral reefs via email notifications to InaCor platform subscribers. With the InaCor platform, it is hoped that it will make it easier for the public to access the updated conditions of coral reefs, increase awareness, and determine policies for better management of coral reefs.
Sources https://drive.google.com/drive/folders/104TDDnGYW228W4Ui_RLRLHAtLh6hjG8P
Built With
- api
- gee
- java
- javascript
- machine-learning
- wordpres


Log in or sign up for Devpost to join the conversation.