Created by: Warwick FC to UCL
Inspiration
Cairo is one of the world's largest cities, and new metro lines are under construction. Line 4 is due around 2028. Debates about new lines focus on riders and travel times. Nobody asks what happens to the shopkeepers along the route. A new station can make one shopping street busier while a street nearby quietly loses customers. Rents can go up and push out small shops. Microbuses can lose their passengers to the metro. We wanted a tool that makes those effects visible before a line is built.
What it does
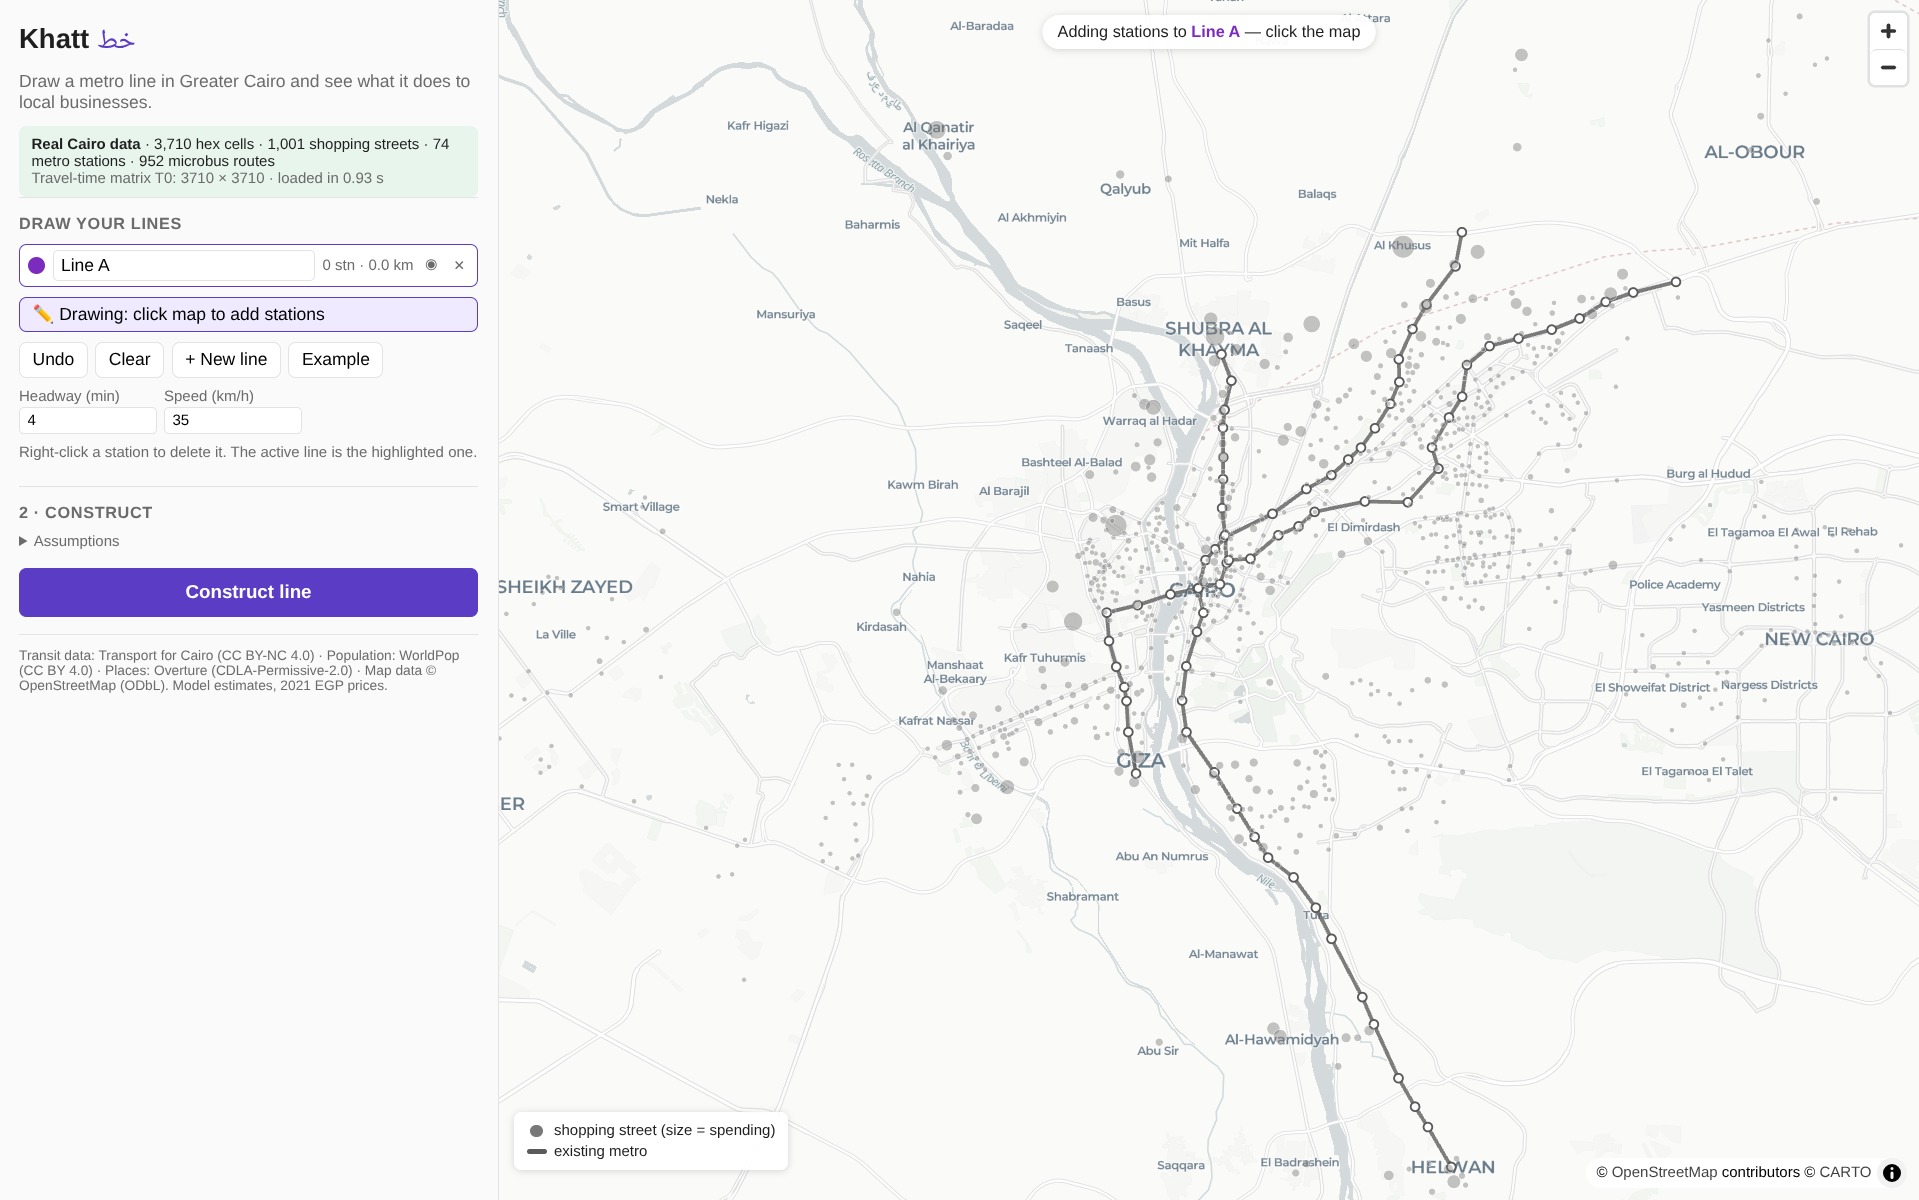
Khatt ("line" in Arabic) lets you draw one or more imaginary metro lines anywhere in Greater Cairo. Click Construct line and in a fraction of a second you see:
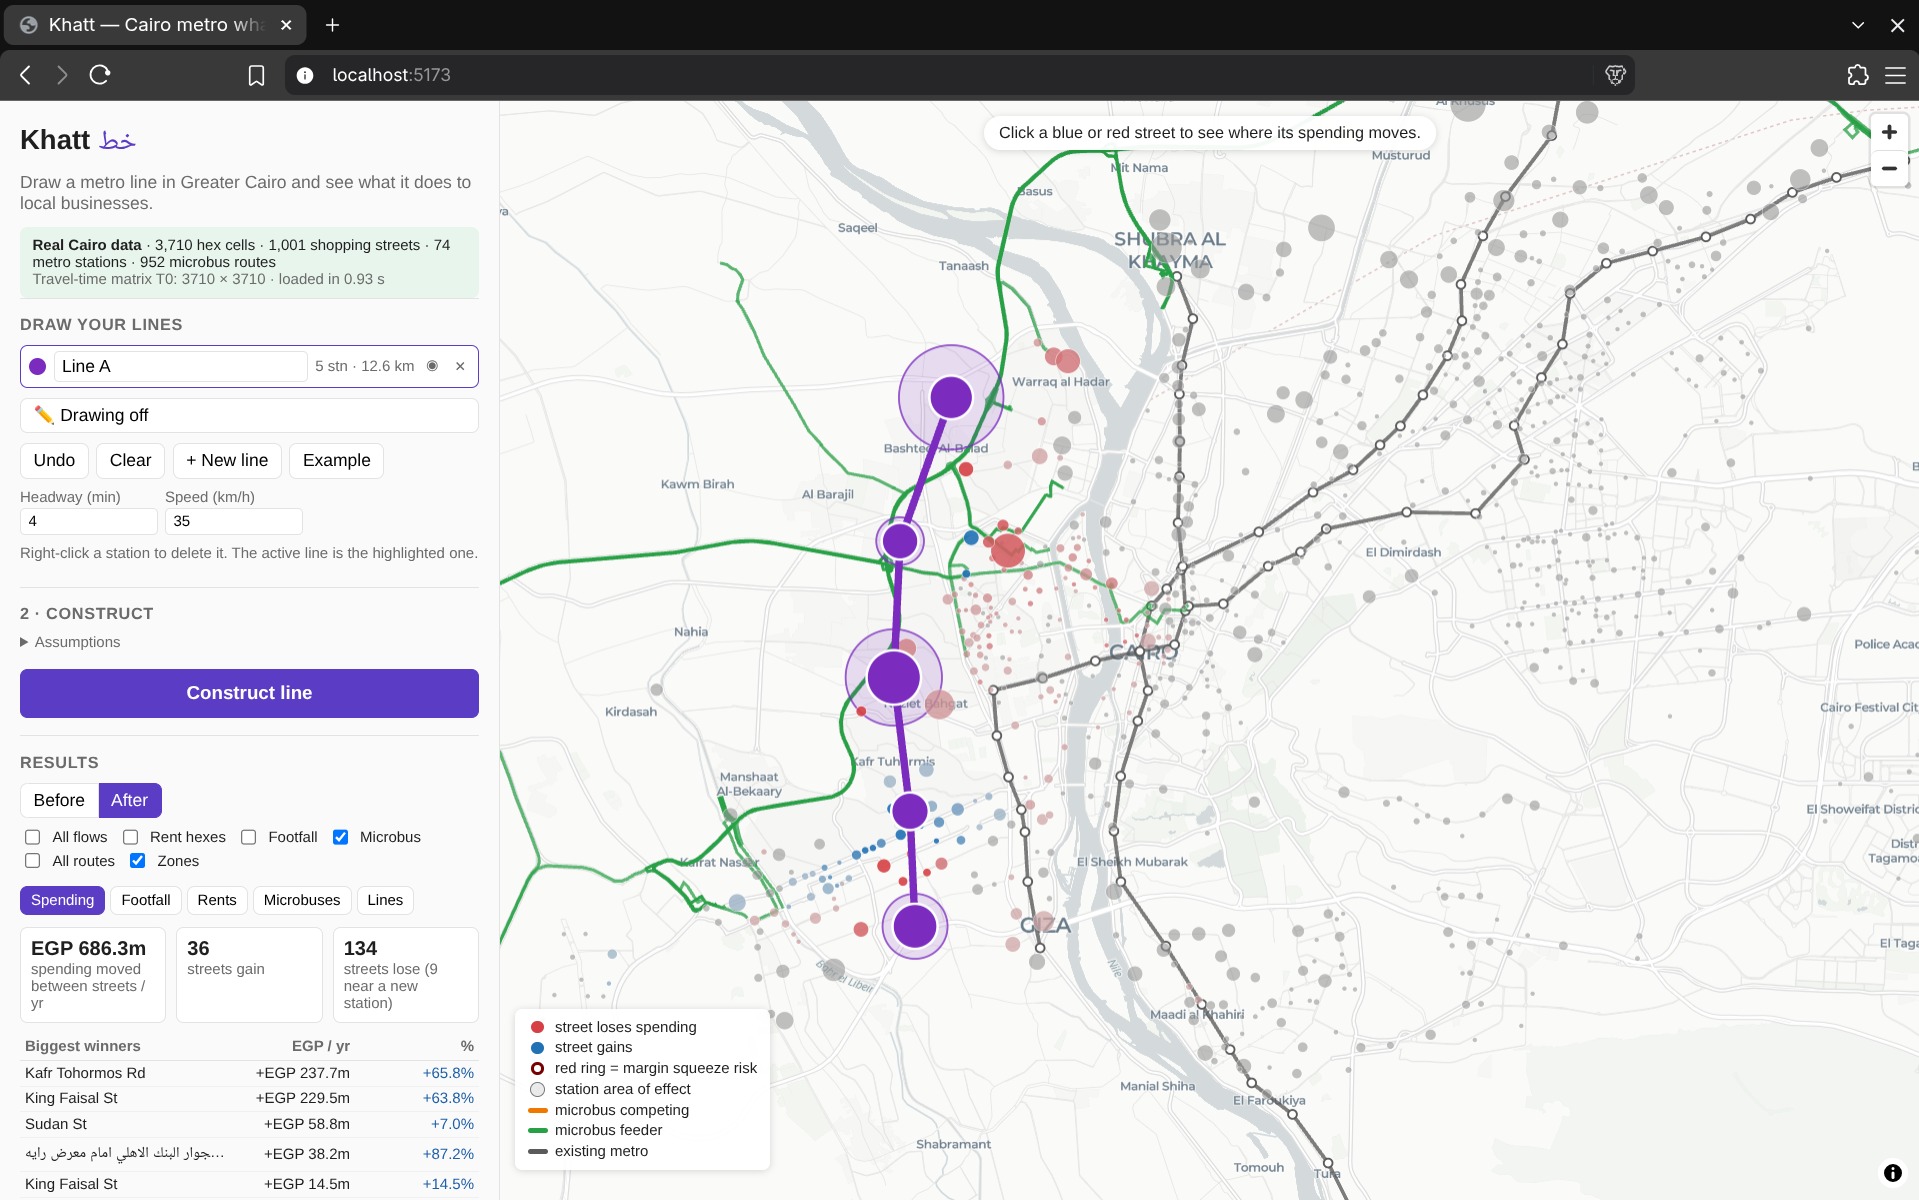
- Where shoppers' spending moves: which of about 1,000 shopping streets gain spending and which lose it, in Egyptian pounds and as a percentage.
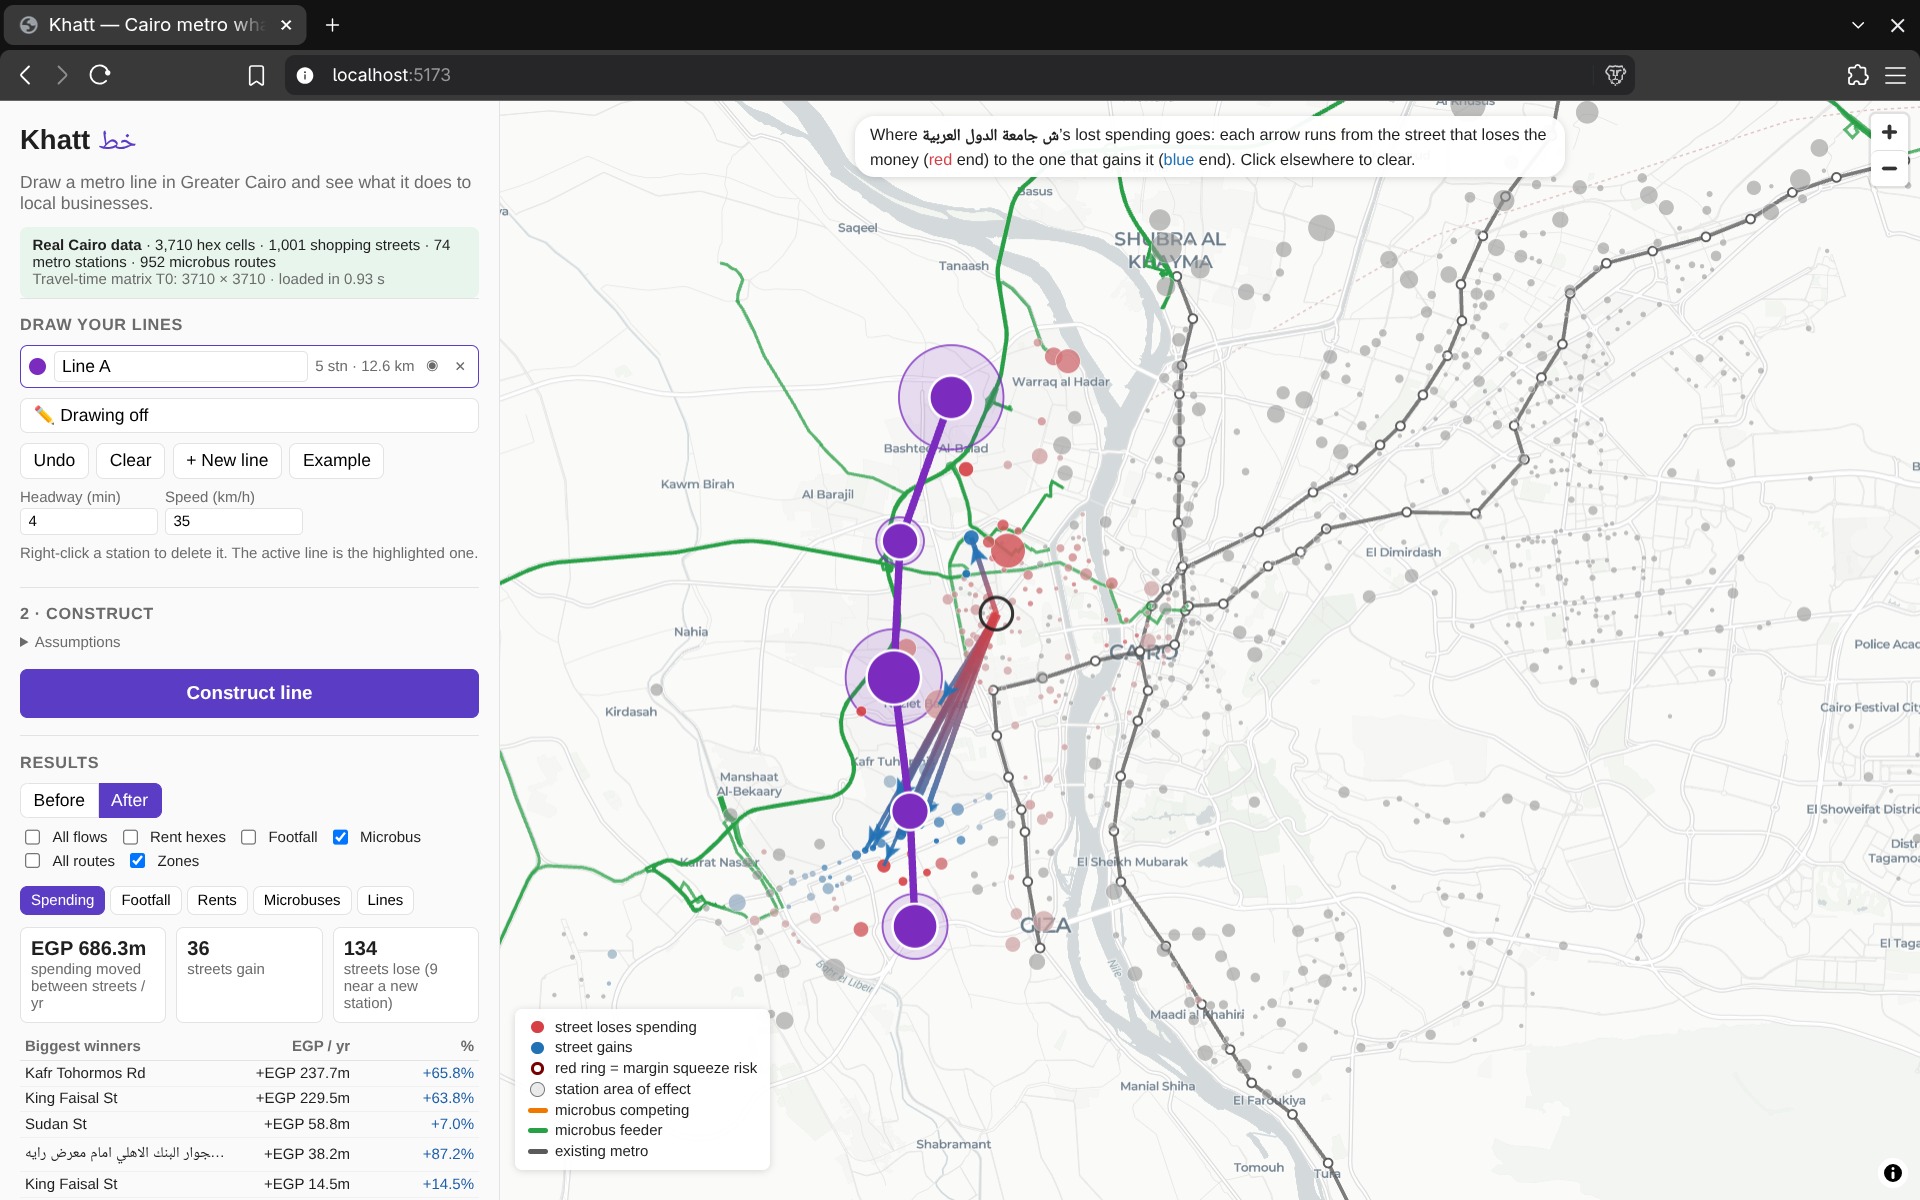
- Where the money comes from: click a street and arrows show which streets lose the spending it gains, or where a losing street's spending goes.
- Footfall: daily riders at each new station, and the extra spending from people walking past nearby shops.
- Each station's area of effect: how far out people are likely to use it.
- Rent pressure: streets where rents rise faster than shop revenue, putting small shops at risk.
- Microbuses: which routes compete with the new line and which feed passengers to it
- Several lines at once: they're evaluated together, so we can show the extra effect of lines that connect with each other.
How we built it
Data
- Transport for Cairo's bus and microbus timetables (about 950 microbus routes) and their metro timetables
- OpenStreetMap for streets and walking paths
- WorldPop for where people live
- Overture and OpenStreetMap for shop locations
- Egypt's national household spending survey (CAPMAS HIECS) for what people spend
Pipeline (Python)
- We grouped shops into shopping streets with a clustering algorithm (DBSCAN).
- We split the city into about 3,700 hexagonal cells (H3).
- We calculated a door-to-door travel time by walking and public transport between every pair of cells, using r5py.
Engine
- Adding a line only creates shortcuts, so the new travel times can be calculated quickly with a numba-compiled function instead of re-routing the whole city.
- A gravity-style shopping model (the Huff model), tuned so that typical shopping trips take a realistic amount of time, re-splits each neighbourhood's spending across the streets.
- Footfall, rent and microbus models build on those results.
API: FastAPI loads all the data into memory once at start-up, so a full evaluation takes about 100–250 ms.
Frontend: React, MapLibre and deck.gl.
Challenges we ran into
- The travel-time matrix: routing every cell to every other cell was the slowest step, taking about 25 minutes. The timetables also left gaps, so we wrote a simpler routing method to fill pairs that couldn't be routed.
- Speed: to keep each evaluation under 2 seconds, we never recalculate travel times for the whole city. We only calculate them to the places the models need.
- Messy data: shop names in both Arabic and English needed cleaning before we could match duplicates, and the metro timetables were out of date. Line 3's newer extensions had to be added by hand.
- Tracing money between streets: the model says how much each neighbourhood shifts, not which street a given pound came from. We split each gain in proportion to that neighbourhood's losses, and a test checks that every street's money in and out adds up to its total change.
Accomplishments that we're proud of
- Evaluating a new line across Greater Cairo takes about 0.1–0.25 seconds, on real data.
- 135 automated tests, including checks that a new line never makes any trip slower and that money is conserved between streets.
- Every model assumption lives in one settings file with low, central and high values and a source, so the results are transparent and can be argued with.
- Looks at which microbuses and commercial areas win and lose
What we learned
- Most of the work in a city model is in cleaning the data, especially timetables, Arabic text and mixed sources.
- Used today's travel times plus shortcuts, beats brute force when you need answers in under a second.
- A map can mislead even when the numbers are right. Lines drawn between places look like routes, so presenting results is as much work as computing them.
- A new metro line moves spending around more than it creates it: some streets win at others' expense.
What's next for Khatt
- Test it against real outcomes, such as the Line 3 extensions that have already opened.
- Replace assumptions with published figures
- Add Line 4, the LRT and the monorail as ready-made scenarios.
- Give planners and community groups an easy way to share a scenario.
