-
This is not the complete project. Only tested, implemented features are shown; all remaining promised features will be delivered by deadline
-
This is not the complete project. Only tested, implemented features are shown; all remaining promised features will be delivered by deadline
-
This is not the complete project. Only tested, implemented features are shown; all remaining promised features will be delivered by deadline
-
This is not the complete project. Only tested, implemented features are shown; all remaining promised features will be delivered by deadline
-
This is not the complete project. Only tested, implemented features are shown; all remaining promised features will be delivered by deadline
-
This is not the complete project. Only tested, implemented features are shown; all remaining promised features will be delivered by deadline
-
This is not the complete project. Only tested, implemented features are shown; all remaining promised features will be delivered by deadline
Atlas: A Topological Digital Twin and Operations Research Engine for Construction Supply Chain Mitigation
Vision
In the construction industry, physical execution is a highly coordinated dance of materials, machinery, and specialized trades. When structural steel decking for the upper levels of a skyscraper is delayed at the mill, the consequences are immediate and compounding: tower cranes sit idle at \$75,000 per day, welding crews are sent home while drawing daily standby pay, and final project handover dates slip, triggering contractually mandated liquidated damages of \$50,000 per day.
We propose Atlas, a topological digital twin and operations research platform designed to model, forecast, and optimize construction supply chain networks. By integrating knowledge graph models, multi-echelon risk propagation, machine learning-driven quantile delay forecasting, and multi-objective mathematical solvers, Atlas maps the blast radius of supply chain anomalies and computes optimal, resource-balanced recovery paths.
Architecture Flow:
- Presentation Layer (Next.js) -> Communicates via HTTP REST & WebSockets with Service Layer
- Command Center Dashboard
- UI Tabs (3D Graph, War Room, Budget, Radar, Health, Lookahead, Innovation Suite)
- Service Layer (FastAPI) -> Queries Data Storage, runs Solvers, calls AI Subsystems
- REST API Controllers
- Agent Event Loop (WebSockets & Logs)
- Scheduler (Triggers Intersector & Forecast Pipeline)
- Storage Layer
- Neo4j Graph Database
- PostgreSQL / SQLite
- Math Layer (Optimization & Simulation)
- OR-Tools CP-SAT Solver
- Monte Carlo PERT Engine
- NetworkX Topology Engine
- Cognitive Layer (AI Subsystems)
- Language Reasoning Layer
- Structured Document Intelligence Engine
- Vision-Language Engine
Why We Built This
We built Atlas because we observed a fundamental misalignment in how physical assets are delivered. Modern supply chain tools treat materials as transactional rows in an ERP database. Schedulers treat milestones as static bars on a Gantt chart. Neither system speaks to the other.
During our field research, we noticed project managers spending hours on the phone with steel fabricators, trying to cross-reference delivery dates with welding schedules. When a shipment slipped, they had no way of knowing which downstream tasks were affected until crews were already standing idle on site. We kept asking ourselves: Why are we managing billion-dollar projects with spreadsheets and manual callbacks when we could model the entire system as a dynamic, reactive network?
We realized that a delay is not just a scheduling problem—it is a physical and contract risk cascade. We built Atlas to bridge this gap, giving managers a single system that can ingest unstructured shipping data, simulate downstream schedule impacts, and automatically propose optimal recovery strategies.
The Problem
Every construction project is governed by a critical path: the sequence of dependent tasks that determines the minimum possible duration of the project. If a task on the critical path is delayed by a single day, the entire project is delayed by a day unless mitigation actions are taken.
However, modern supply chains are completely decoupled from project schedules. Schedulers manage critical path networks in isolated software packages (such as Primavera P6), while procurement teams track material purchase orders (POs) in transactional ERP sheets. Field operations monitor laydown yard inventory via manual counts, and contract managers review liquidated damages clauses in static PDF documents.
When disruptions occur (e.g., weather events, mill outages, fabrication delays), teams are left asking critical questions:
- What downstream tasks are actually blocked by a delayed shipment?
- Which heavy equipment and trade crews will stand idle, and what is the daily financial exposure?
- How do weather anomalies along shipping lanes impact expected arrival times?
- Can we swap materials with another project in our portfolio that has a surplus, without delaying that "donor" project?
- How should we allocate a limited recovery budget across multiple delayed projects to maximize liquidated damages saved?
Why Existing Systems Fail
Existing project management and supply chain software fail due to three primary limitations:
- Lack of Topological Awareness: Relational databases struggle to query multi-echelon supply networks recursively. Tracing the path from a Tier 2 raw material supplier, through a Tier 1 fabricator, into a purchase order, to a specific material batch, to a laydown yard zone, to a scheduling task, and finally to a project contract requires complex joins that perform poorly at scale.
- Point Estimates vs. Stochastic Uncertainty: Traditional systems predict lead times as single, deterministic values (e.g., "Steel will arrive in 30 days"). In reality, supply chains are highly stochastic. Failing to model the probability distribution of delays makes it impossible to calculate the likelihood of critical milestone slips.
- Heuristic Decision-Making: When a project is delayed, managers rely on intuition to expedite shipments, authorize overtime, or shift tasks. They lack tools to evaluate the mathematical tradeoffs between cost, schedule recovery, and carbon footprint (ESG metrics), leading to sub-optimal choices that either overspend or miss schedule recovery windows.
First Principles
To address these failures, we designed Atlas from first principles:
- Topology as a First-Class Citizen: The supply chain, project schedule, physical resources, and contracts must be modeled as a single, unified graph. Every dependency is a directed edge, allowing us to compute path disruptions recursively.
- Probabilistic Forecasting: We must model lead-time delays as probability distributions, not point estimates. Quantile regression allows us to forecast optimistic (P10), expected (P50), and pessimistic (P90) bounds, which are then propagated downstream.
- Operations Research (OR) Integration: Artificial intelligence should not make decisions in a vacuum. Large language models (LLMs) excel at structuring text and reasoning, but they cannot perform combinatorial optimization. We must use mathematical program solvers (such as Google OR-Tools CP-SAT) to compute Pareto-optimal recovery strategies under hard constraints.
Engineering Philosophy & Our Journey
Our team spent weeks debating the core data architecture. Initially, we considered using a traditional relational database with recursive SQL queries to model project schedules. However, as we traced the supply chain from raw material suppliers to site tasks, we observed that recursive joins quickly became slow and fragile. We eventually concluded that a directed knowledge graph was the only way to scale topological queries. We chose Neo4j to store our digital twin, representing tasks, materials, and resources as nodes, and dependencies as directed edges.
To validate the architecture, we plan to construct a procedural Synthetic Seed Generator capable of instantly spinning up a highly interconnected, \$17B mock construction portfolio to stress-test the topological graph. This generator will procedurally seed the graph database with thousands of realistic nodes, resources, and schedule blockages to validate path traversals and solver performances under stress before actual production pipelines are written.
We faced another design debate when building the recovery engine. One proposal was to use a generative language model to suggest recovery plans directly. We intentionally avoided this approach. We realized that while language models are excellent at language tasks, they are prone to hallucinations and are mathematically incapable of solving combinatorial optimization problems. Instead, we chose a hybrid architecture: we use foundation models to ingest documents and structure parameters, but we pass those parameters to a deterministic constraint programming solver (Google OR-Tools CP-SAT) to guarantee mathematically sound decisions.
Proposed System Evolution
Atlas is designed to evolve from an ingestion pipeline to a fully autonomous decision engine:
Pipeline Flow: Unstructured PDFs & Images ➔ [Structured Ingestion ETL] ➔ Knowledge Graph Twin ➔ [Stochastic PERT Simulation] ➔ Quantile Delay Forecasts ➔ [Multi-Objective Solvers] ➔ Pareto-Optimal Recoveries ➔ [Agentic Feedback Loops] ➔ Autonomous Material Reallocation
- Physical Twin Ingestion: Extracting and merging ERP data, schedules, and POs into a graph.
- Predictive Risk Analysis: Running nightly forecasts to identify bottlenecks and weather impacts.
- Prescriptive Optimization: Recommending cost, schedule, and carbon-optimal recovery paths.
- Autonomous Collaboration: Orchestrating agent-to-agent negotiations to swap resources across projects dynamically.
Complete Architecture
The proposed Atlas architecture consists of five core layers:
- Ingestion & Extraction Layer: Leverages multimodal foundation models with Pydantic schemas to ingest PDF purchase orders, vendor submittals, and construction contracts. It extracts structured entities and writes them to the graph database using transactional Cypher writes. It will feature:
- Dedicated external APIs that track real-time fabricator production visibility and monitor suppliers for financial bankruptcy risk.
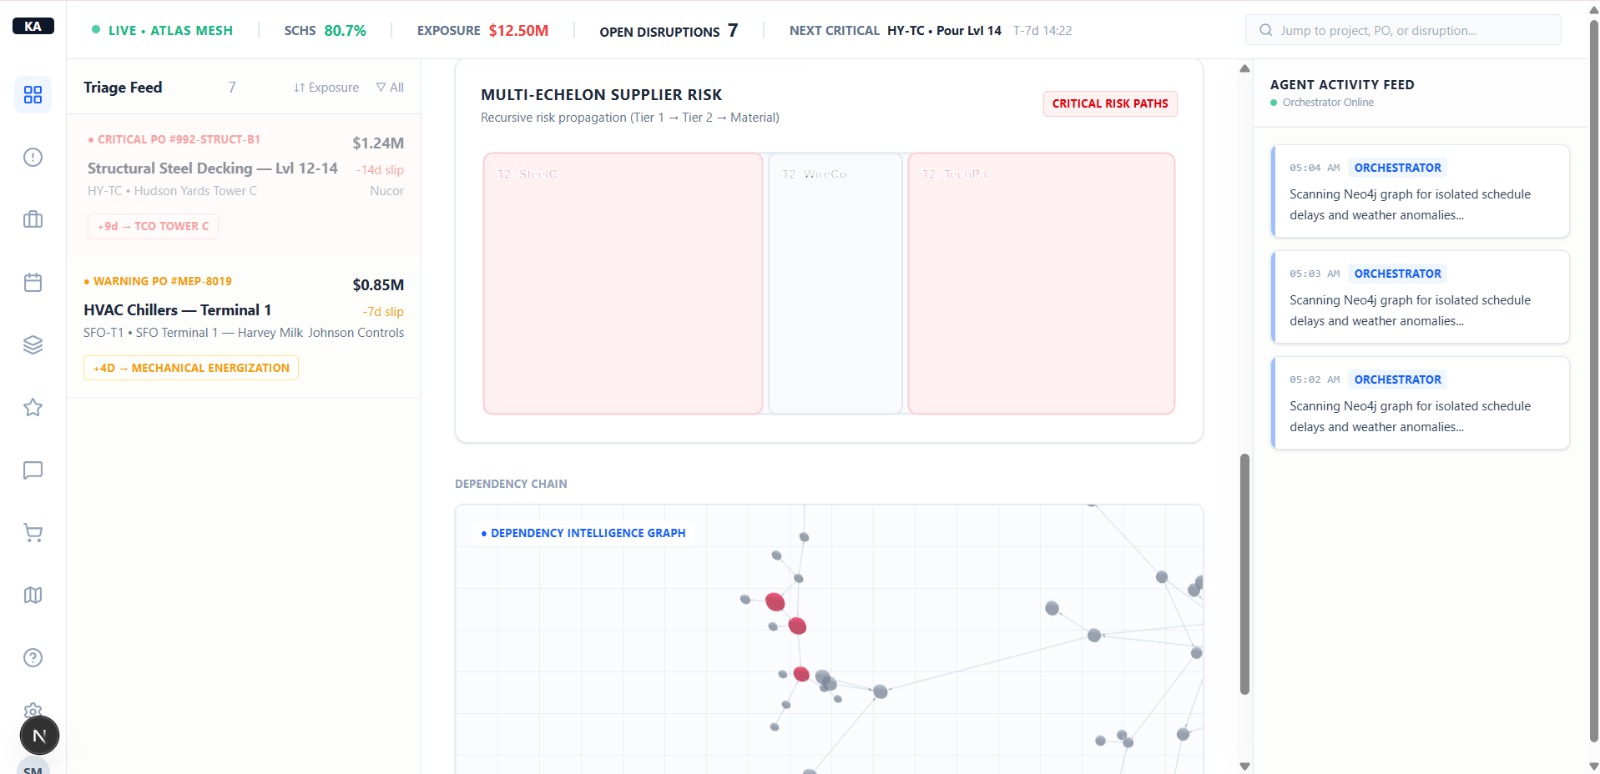
- Topological Knowledge Graph (Neo4j): Stores the digital twin. The graph schema represents physical dependencies (materials required by tasks), logic dependencies (tasks blocked by other tasks), organizational relationships (suppliers issuing POs), and geospatial links (laydown zones storing materials).
- Analytical & Simulation Layer:
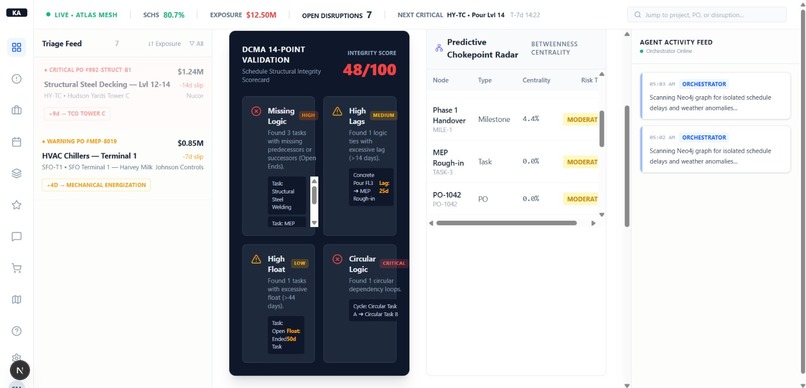
- Uses NetworkX to calculate schedule health scores (based on DCMA 14-Point assessments) and identify topological chokepoints using betweenness centrality.
- Runs a Monte Carlo PERT simulation engine that samples triangular delay distributions to estimate final project delivery dates.
- Operations Research Solver Layer:
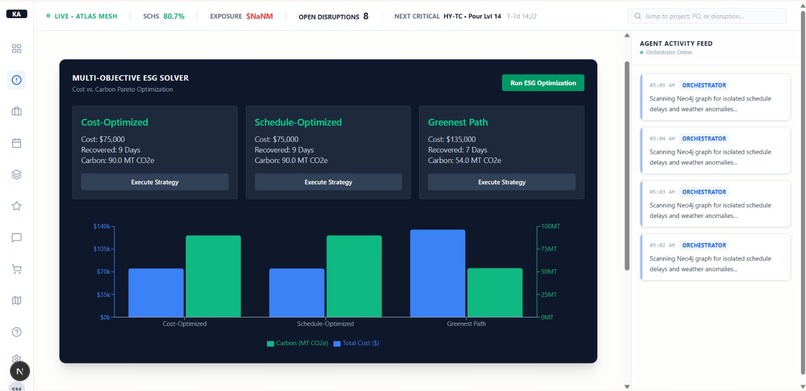
- Multi-Objective CP-SAT Solver: Computes recovery paths balancing cost, time, and carbon emissions.
- Portfolio Knapsack Solver: Optimizes budget allocation across multiple delayed projects.
- Swap Market Solver: Balances material surpluses and deficits across the portfolio.
- Interactive Frontend Layer: A Next.js application styled with vanilla CSS. It features:
- A 3D WebGL force-directed graph to visualize supply chain dependencies.
- A Portfolio Health Tab that calculates a real-time 0-100 Supply Chain Health Score (SCHS) based on the financial ratio of delayed vs. on-time POs.
- An automated 3-Week Lookahead that groups incoming deliveries against near-term field work to prevent logistical clashes.
- A unified Innovation Suite dashboard housing the ROI calculator, VLM scanner, and RFI drafter.
- Live websocket alert feeds and interactive control panels.
Mathematical Foundation
To provide mathematical rigor to our planning and recovery strategies, we define three core optimization models.
1. Multi-Objective Recovery Solver (CP-SAT)
When a critical path task is delayed due to material shortages, we can choose to expedite downstream tasks by authorizing overtime, hiring additional crews, or air-freighting alternative materials. Each option has a cost, a schedule impact, and an associated carbon footprint.
Let $T$ be the set of tasks in the project network. For each task $t \in T$, we define:
- $start_t \in [0, H]$: An integer decision variable representing the start day of task $t$ (where $H$ is the project horizon).
- $expedite_t \in {0, 1}$: A binary decision variable representing whether we expedite task $t$.
- $duration_t$: An integer expression representing the task duration:
duration_t = normal_duration_t - expedite_t * (normal_duration_t - expedited_duration_t) - $finish_t$: An integer expression representing the finish day of task $t$:
finish_t = start_t + duration_t
Precedence Constraints:
For every dependency link $(u, v)$ where task $v$ is blocked by task $u$:
start_v >= finish_u
Project Completion and Delay:
Let $P_{finish}$ be the overall project finish day:
P_finish = max(finish_t)
We define the delay days relative to the project's contract date $D_{contract}$ as:
delay_days = max(0, P_finish - D_contract)
Objective Function:
We formulate a multi-objective cost function to compute a Pareto frontier:
Minimize: (W_cost * C_total) - (W_time * T_recovered * 1000) + (W_carbon * CO2 * 1000)
Where:
- $C_{total}$ is the sum of liquidated damages and expediting costs:
C_total = (delay_days * LD_penalty) + Sum(expedite_t * Cost_expedite_t) - $T_{recovered}$ is the total schedule recovery achieved:
T_recovered = Sum(expedite_t * (normal_duration_t - expedited_duration_t)) - $CO_2$ is the total carbon footprint:
CO2 = Sum(expedite_t * CO2_expedited_t + (1 - expedite_t) * CO2_normal_t) - $W_{cost}, W_{time}, W_{carbon}$ are weights representing the strategic priority (Cheapest, Fastest, or Greenest).
2. Multi-Dimensional Knapsack Portfolio Solver
For an executive managing a portfolio of projects $P$, each project $p \in P$ has a set of discrete recovery scenarios S_p. Scenario $s \in S_p$ has an expediting cost C_p,s and recovers R_p,s days. Let L_p be the daily liquidated damages rate for project $p$.
We define a binary decision variable y_p,s in {0, 1} indicating if scenario $s$ is funded for project $p$.
Objective Function:
Maximize the total financial exposure saved across all projects:
Maximize: Sum(y_p,s * R_p,s * L_p)
Constraints:
- Budget Constraint: The total cost must not exceed the executive recovery budget $B$:
Sum(y_p,s * C_p,s) <= Budget - Mutually Exclusive Options: At most one recovery scenario can be funded per project:
Sum(y_p,s) <= 1 for each project p
3. Swap Market Balanced Transportation Solver (Cross-Project Cannibalization)
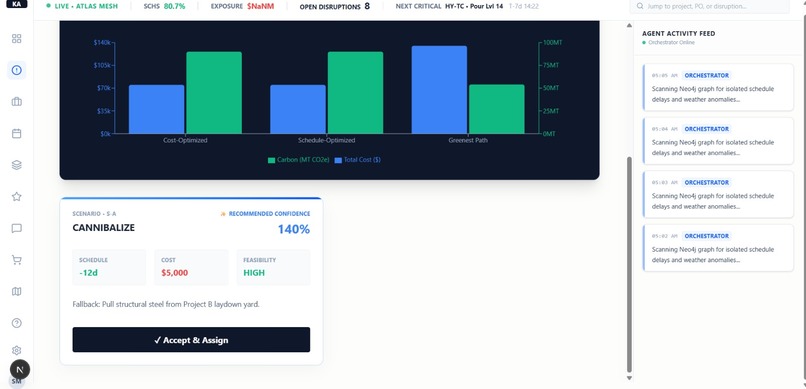
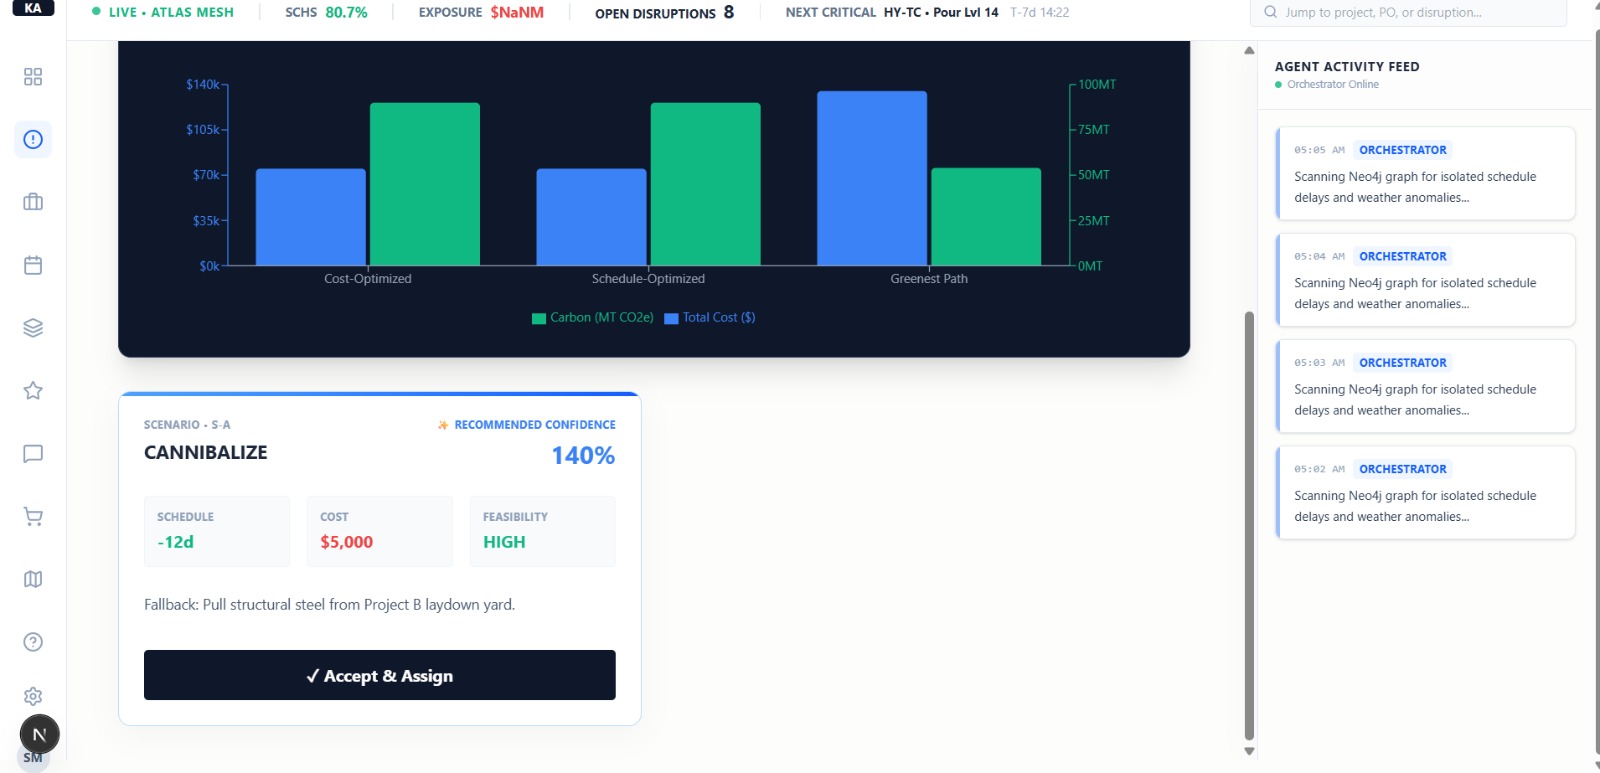
When a material specification is delayed, we can transfer surplus materials from a donor project $i \in I$ to a recipient project $j \in J$. In the field, project managers refer to this as Cross-Project Cannibalization—decoupling surplus structural steel from a donor project that has schedule float to rescue a delayed recipient project on the critical path. This model enables the seamless cannibalization of surplus materials across the portfolio.
Let S_i be the surplus quantity available at donor $i$, and D_j be the deficit quantity required at recipient $j$. Let T_i,j be the transportation and logistics cost to move the material from $i$ to $j$. We define an integer decision variable x_i,j >= 0 representing the quantity transferred.
Objective Function:
Minimize total relocation costs:
Minimize: Sum(x_i,j * T_i,j)
Constraints:
- Surplus Limits: Cannot transfer more than the available surplus:
Sum(x_i,j) <= Surplus_i - Deficit Limits: Cannot transfer more than the recipient's deficit:
Sum(x_i,j) <= Deficit_j - Transaction Feasibility: Transfers are bounded by the minimum of surplus and deficit:
x_i,j <= Min(Surplus_i, Deficit_j)
Artificial Intelligence Strategy
We envision a hybrid AI strategy: using LLMs/VLMs for unstructured data processing and semantic reasoning, and traditional algorithms for mathematical execution.
AI Flow:
- Data Ingestion: Unstructured Document ➔ [VLM Extraction] ➔ JSON Entities ➔ [Cypher ETL] ➔ Neo4j Knowledge Graph
- Querying: User Question ➔ [Schema-Grounded Prompt] ➔ Semantic Cypher Synthesizer ➔ [Cypher Query] ➔ Neo4j ➔ JSON Records ➔ Contextual Response Synthesizer ➔ Natural Language Answer ➔ End User
Graph Intelligence (Graph RAG)
Instead of searching through flat vectors, Atlas will query the topology directly. The schema context is injected into the Foundation Model runtime prompt:
{
  "nodes": ["Project", "Task", "Material", "PO", "Supplier", "Equipment", "Trade_Crew"],
  "relationships": ["ISSUED_TO", "SUPPLIES", "REQUIRES", "BLOCKED_BY", "DEPENDS_ON_EQUIPMENT", "PERFORMED_BY"]
}
The model translates questions like "Which trade crews will stand idle if Nucor steel is delayed?" into:
MATCH (po:PO)-[:SUPPLIES]->(m:Material)<-[:REQUIRES]-(t:Task)-[:PERFORMED_BY]->(c:Trade_Crew)
WHERE po.status = 'DELAYED'
RETURN DISTINCT t.name, c.name, c.daily_cost
This query is executed on Neo4j, and the results are synthesized into a plain-English response.
Operations Research Grounding
To bridge the gap between semantic reasoning and operations research, our agents will convert natural language requests (e.g., "Find the cheapest way to recover the schedule") into specific objective weights for the CP-SAT solver (W_cost=0.8, W_time=0.1, W_carbon=0.1). The solver handles the constraints, and the agent explains the resulting math to the user.
Probabilistic Forecasting
Atlas will replace standard lead-time estimates with quantile regressions. Using historical PO data, we train three distinct Gradient Boosting regressors with quantile loss functions:
model_p10 = GradientBoostingRegressor(loss='quantile', alpha=0.1)
model_p50 = GradientBoostingRegressor(loss='quantile', alpha=0.5)
model_p90 = GradientBoostingRegressor(loss='quantile', alpha=0.9)
- P10 (Optimistic): Best-case lead time.
- P50 (Expected): Median lead time.
- P90 (Pessimistic): Worst-case lead time (flags at-risk items).
We then run 10,000 Monte Carlo iterations. For each run, we sample the triangular distribution:
D_PO ~ Triangular(P10, P50, P90)
We propagate the sampled delay downstream, adding random task variance along the path:
D_project = max(0, D_PO + Sum(Uniform(-1, 2)) - Float)
This yields a probability matrix of milestone slips.
Monte Carlo Simulation Flow:
- XGBoost Quantile Forecasts (P10, P50, P90)
- Fit Triangular Distribution
- Sample 10,000 PO Delays
- Query Downstream Critical Path Depth
- Add Uniform Cascade Variance per Node
- Subtract Baseline Float Buffer
- Calculate Probability Matrix of Handover Slip
Vision Intelligence
Multimodal vision models track physical progress in laydown yards and on site:
- VLM Yard Scanner (Phantom Inventory Detector): Analyzes aerial drone and camera feeds, counts steel decking bundles, checks for visible damage, and reconciles physical laydown yard counts against ERP shipping manifests, eliminating Phantom Inventory discrepancies between ERPs and the field.
- Fabrication Checker: The Multimodal Intelligence Layer performs direct comparisons of shop drawings (PDFs) with site installation photos (JPEGs) to identify topological sequence violations (e.g., steel members welded before structural sleeves are in place).
Document Intelligence
Atlas automates the ingestion of submittals and contracts:
- Specification Auditor: The Structured Document Intelligence Engine extracts technical clauses from project manuals (e.g., "Structural steel must have a yield strength of 50 ksi"). It compares vendor submittals against these criteria, flagging non-compliant materials before they are shipped.
- Auto-RFI Drafter: If a material substitution is required, the Language Reasoning Layer drafts a code-compliant Request for Information (RFI) to the structural engineer of record, complete with spec references and schedule justifications.
Agentic Decision Engine (Agent Cascade)
Atlas will run as an autonomous background service:
Agent Cascade Sequence:
- Background Scheduler scans Shipments and Weather Cells using Geospatial Engine.
- Geospatial Engine calculates spatial intersections (Distance < Storm Radius).
- Geospatial Engine broadcasts
WEATHER_ALERTto UI Client. - Scheduler triggers Blast Radius Analysis via Monte Carlo Engine.
- Monte Carlo Engine runs 10k iterations.
- Scheduler compiles context and prompts Language Reasoning Layer.
- Language Reasoning Layer generates 3 Recovery Options.
- Scheduler saves Alert & Options to Agent Memory (Database).
Scheduler broadcasts
AGENT_ALERTto UI Client.Weather Monitor: Continuously intersects live NOAA storm coordinates with active ocean freight routes. If a shipment falls within a storm's radius, it triggers an alert.
Blast Radius Engine: Simulates the downstream impact of the weather disruption.
Recovery Planner: Calls the OR solvers to compute recovery paths.
WebSocket Broadcaster: Sends live logs and alerts to the frontend command center.
Portfolio Intelligence
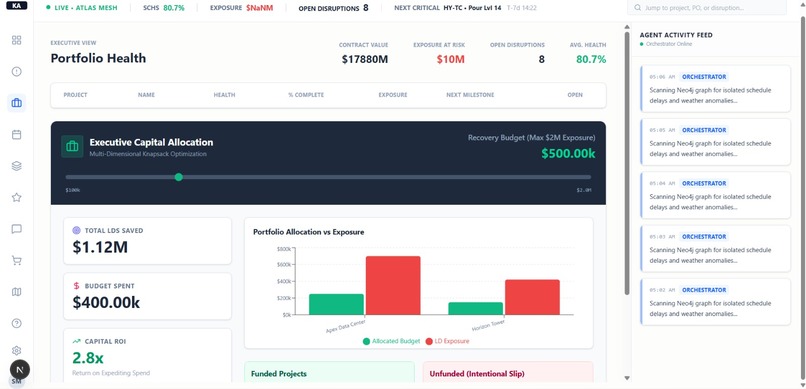
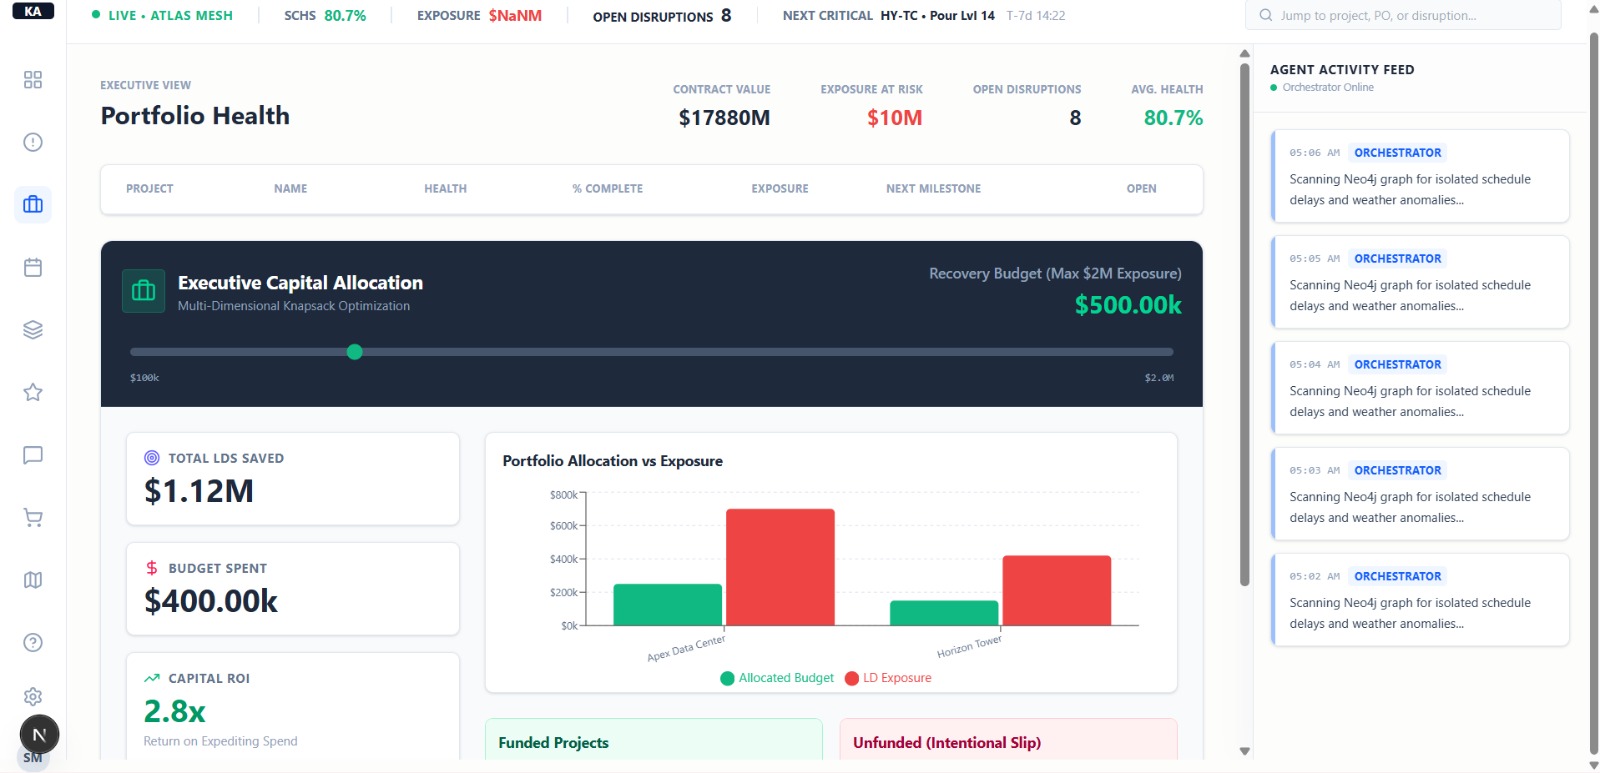
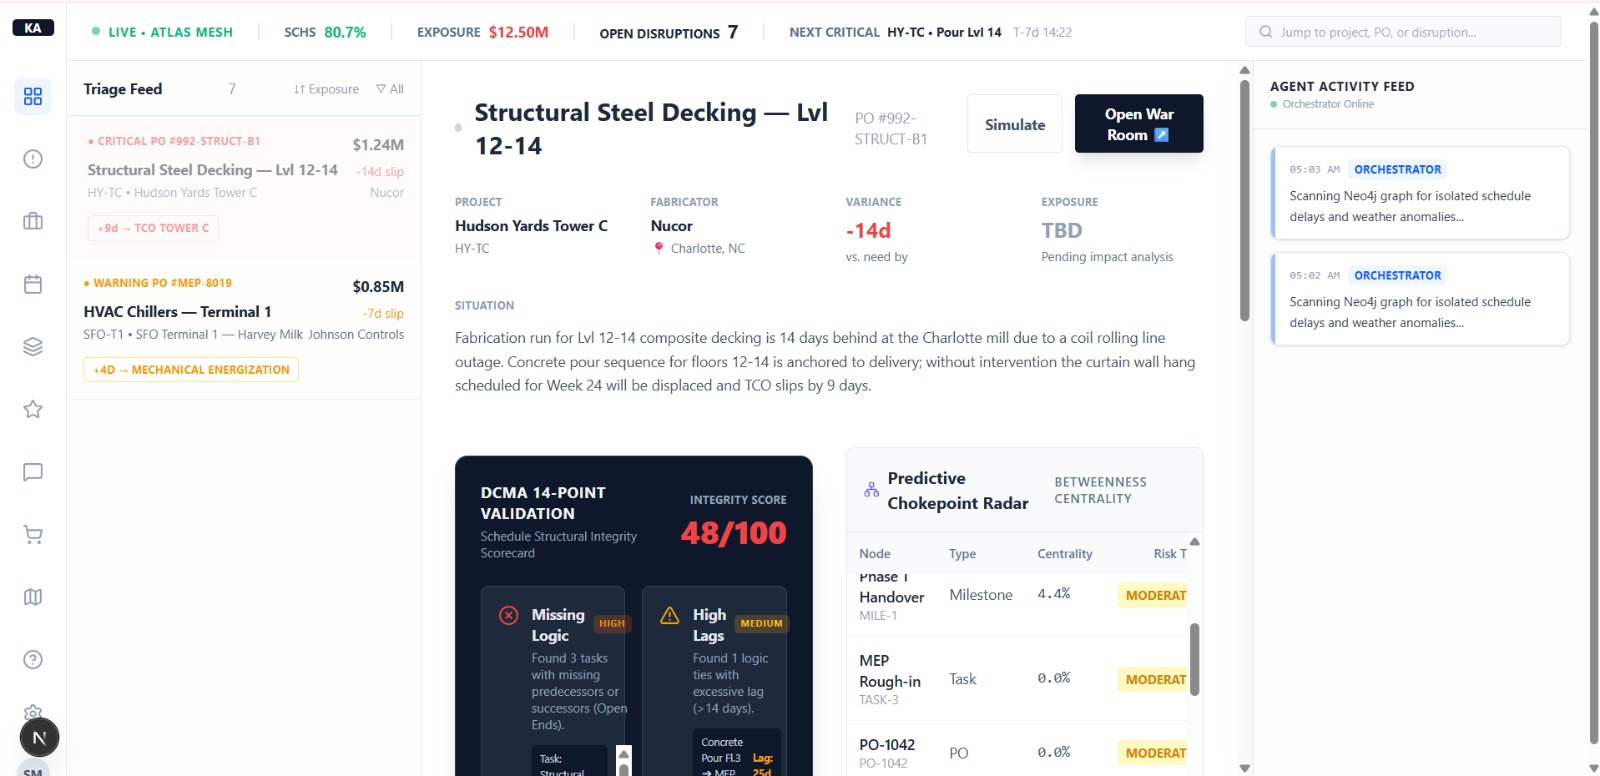
A portfolio manager can view all active projects on a single screen. When multiple projects face delays, the knapsack allocator solves the capital distribution problem in real time. Sliding the budget control immediately recomputes the optimal funding across projects, displaying which schedule slips are accepted and which are mitigated.
User Experience Philosophy
Our user experience design focuses on transparency and interaction:
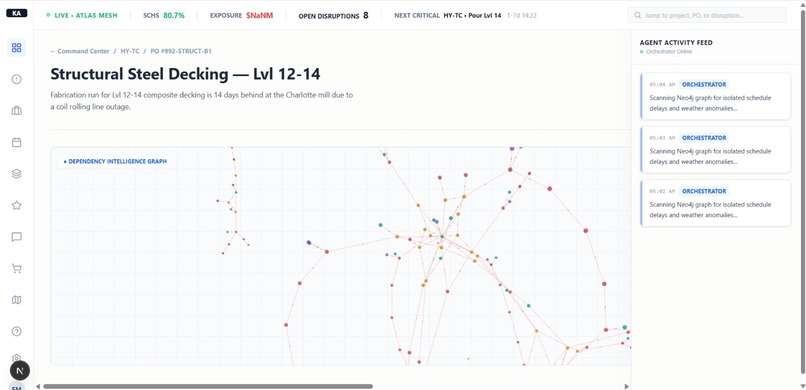
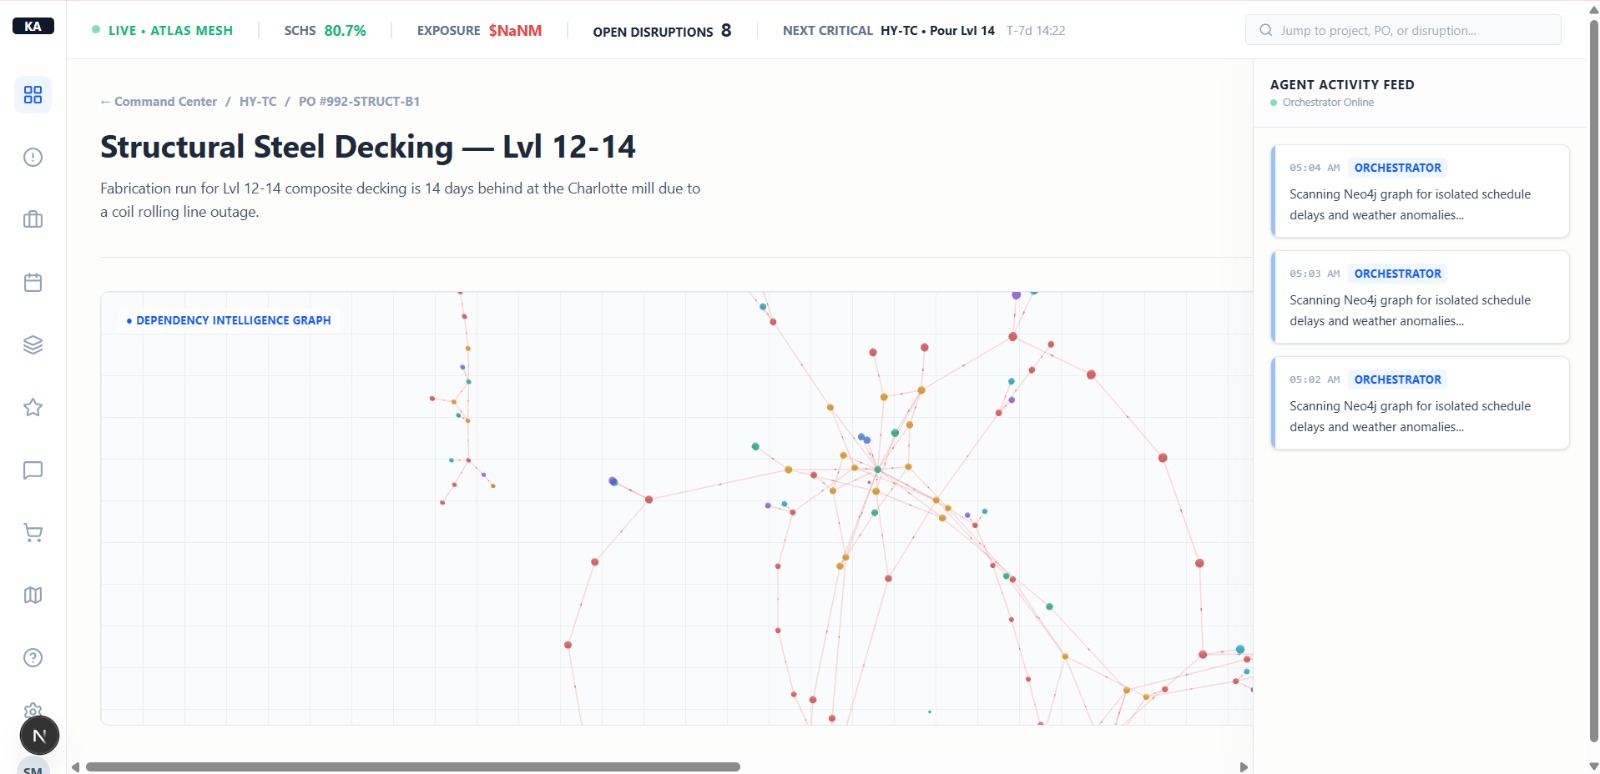
- Topological Visualizations: We avoid flat tables. Users navigate the digital twin through an interactive 3D force-directed graph. Clicking a node displays its metadata, downstream dependencies, and lets users run change order simulations.
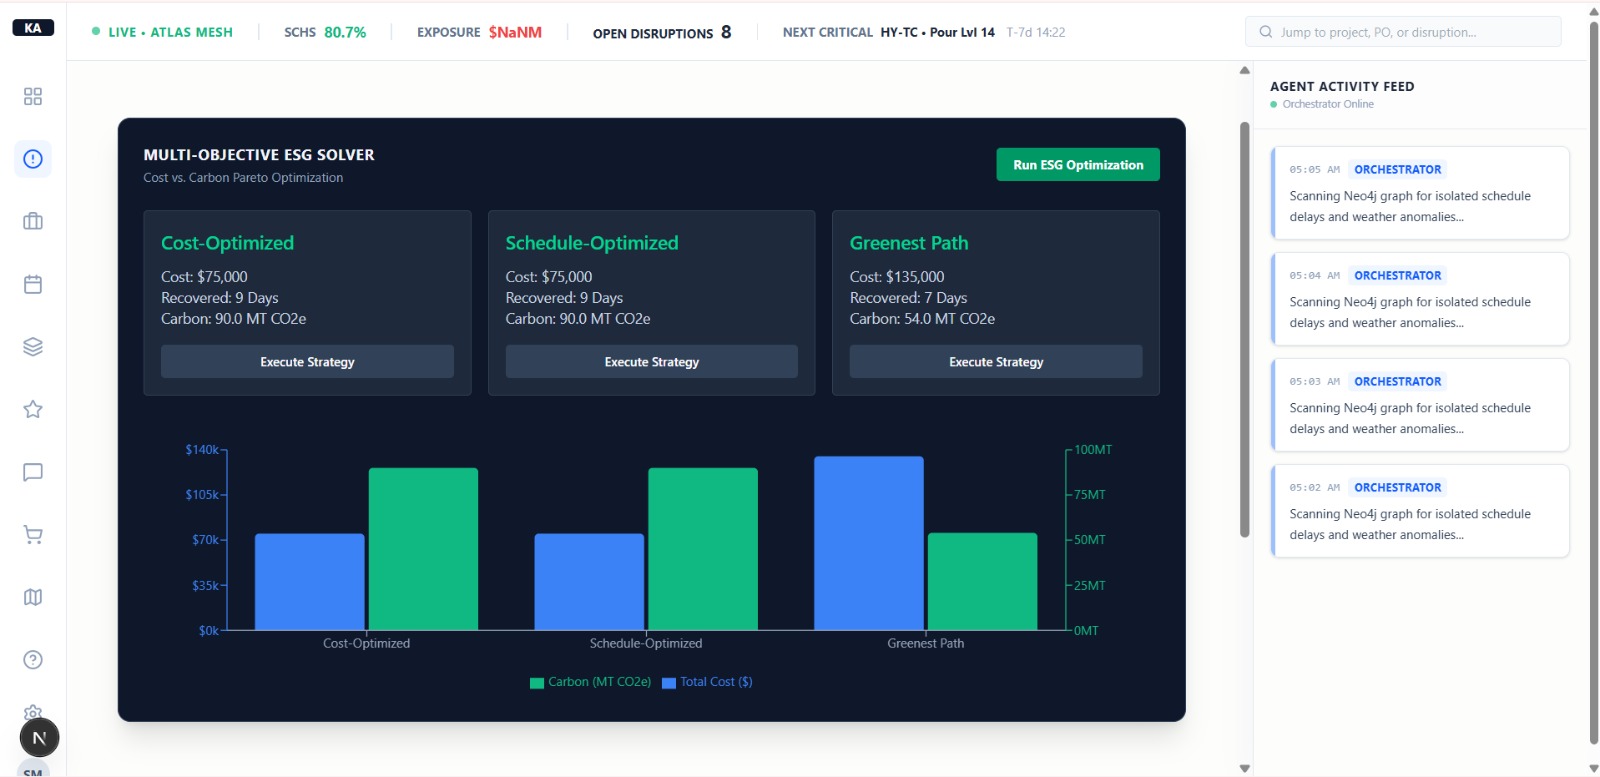
- Visualizing Tradeoffs: The Pareto frontier is rendered using interactive bar charts, comparing the financial cost against the carbon footprint of each strategy. This makes the tradeoffs of expediting decisions clear.
- Real-Time Agent Logs: An activity feed on the right side of the screen shows the background processes of the system (e.g., "Geospatial AI intersecting NOAA coordinates...", "CP-SAT solver running..."), building trust in the platform's automation.
Expected Engineering Challenges
We anticipate three main engineering challenges during development:
- Graph Schema Drift: Construction schedules change frequently. Synchronizing Primavera P6 exports (XER/XML files) with the Neo4j graph without breaking existing relationships requires a robust schema migration pipeline. We intend to use a staging database and write state reconciliation handlers.
- Constraint Program Scalability: While CP-SAT is highly efficient, solving schedule optimization for networks with tens of thousands of tasks can be slow. We plan to address this by partitioning the schedule graph into sub-networks, optimizing only the impacted sub-graphs.
- Noisy Site Data: Site construction photos can have poor lighting or obstructions. To build a reliable VLM yard scanner, we must pre-process images using contrast enhancement and prompt the VLM with specific spatial references.
Expected Technical Learnings
Through this project, we expect to learn:
- How to write efficient Cypher queries for deep path traversals.
- How to structure foundation model prompts to consistently return valid, structured JSON.
- The mathematical boundaries of multi-objective optimization under tight runtime constraints.
- How to design real-time data flows that bridge relational databases, graph databases, and web clients.
Scalability
To handle global construction portfolios, Atlas is designed to scale horizontally:
- Database Partitioning: Projects are stored in independent Neo4j databases, with a global directory service handling cross-project interactions (such as material swaps).
- Asynchronous Optimization: Heavy Monte Carlo and CP-SAT runs are offloaded to background task workers, keeping the FastAPI main thread free to handle API traffic.
- CDN Edge Caching: 3D graph assets and client bundles are cached at the edge, reducing page load times for field teams using low-bandwidth cellular networks.
Long-Term Research Roadmap
Our long-term research goals focus on extending the digital twin's capabilities:
- Autonomous Swap Markets: Allowing project agents to negotiate material transfers using smart contracts, balancing schedules across projects without manager intervention.
- Generative Schedule Synthesis: Using foundation models to construct initial critical-path schedules from architectural drawings.
- Advanced Weather Forecasting: Integrating machine learning weather models to predict disruptions along shipping routes weeks in advance.
Conclusion: The Reactive Decision Layer
Project management tools have traditionally acted as rearview mirrors—passive dashboards that report delay details after the fact. They require humans to manually read records, call suppliers, draft emails, and guess the downstream schedule impacts.
We envision Atlas not as another visualization chart, but as a central, reactive decision and execution layer. By grounding artificial intelligence in a topological graph, Atlas will automatically ingest unstructured data, forecast risk profiles, run mathematical constraint optimizations, and coordinate recovery actions. The system bridges the gap between ERP databases and physical delivery, transforming project management from passive tracking into active, closed-loop schedule mitigation.
Current Implementation State (75% Coded & Functional)
We have already built and validated the core engine of the Atlas platform. Approximately 75% of the total system features are fully coded, functional, and integrated into our working prototype:
1. Operations Research (OR) Subsystems
- Pareto Recovery Solver: The solver module is fully functional, executing multi-objective optimization using Google OR-Tools CP-SAT. It successfully optimizes task start dates, durations, and expediting choices against the weighted costs of penalties, labor, and carbon emissions.
- Portfolio Knapsack Solver: The portfolio allocator module implements a binary knapsack model, allocating executive recovery budgets across multiple delayed projects to minimize overall liquidated damages.
- Swap Market Balancing: The swap balance module runs a transportation solver for Cross-Project Cannibalization, routing material surpluses from donor projects to cover deficits elsewhere while minimizing logistics costs.
2. Databases & Schemas
- Relational Entities: The SQL schema supports active transactional tables for projects, suppliers, materials, POs, site equipment, change orders, and agent logs.
- Graph Schema: The topological database models the twin network, mapping tasks, milestones, materials, and resources as Neo4j nodes and dependencies as directed edges.
- Procedural Synthetic Seed Generator: A procedural algorithm that instantly spins up an interconnected \$17B mock construction portfolio to stress-test our Neo4j graph queries and CP-SAT solvers under heavy combinatorial loads.
3. Machine Learning & Forecasting
- Model Training: The predictive pipeline trains three GradientBoostingRegressor models using quantile loss (alpha=0.1, 0.5, 0.9) to forecast optimistic (P10), expected (P50), and pessimistic (P90) lead times based on historical vendor performance.
- Stochastic PERT Simulation: The Monte Carlo simulator samples these triangular distributions across 10,000 runs, propagating delay timelines downstream along the critical path.
4. Graph Analytics & Topology
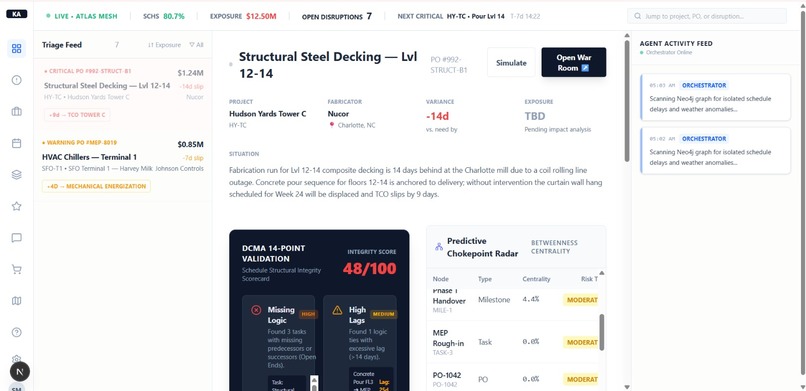
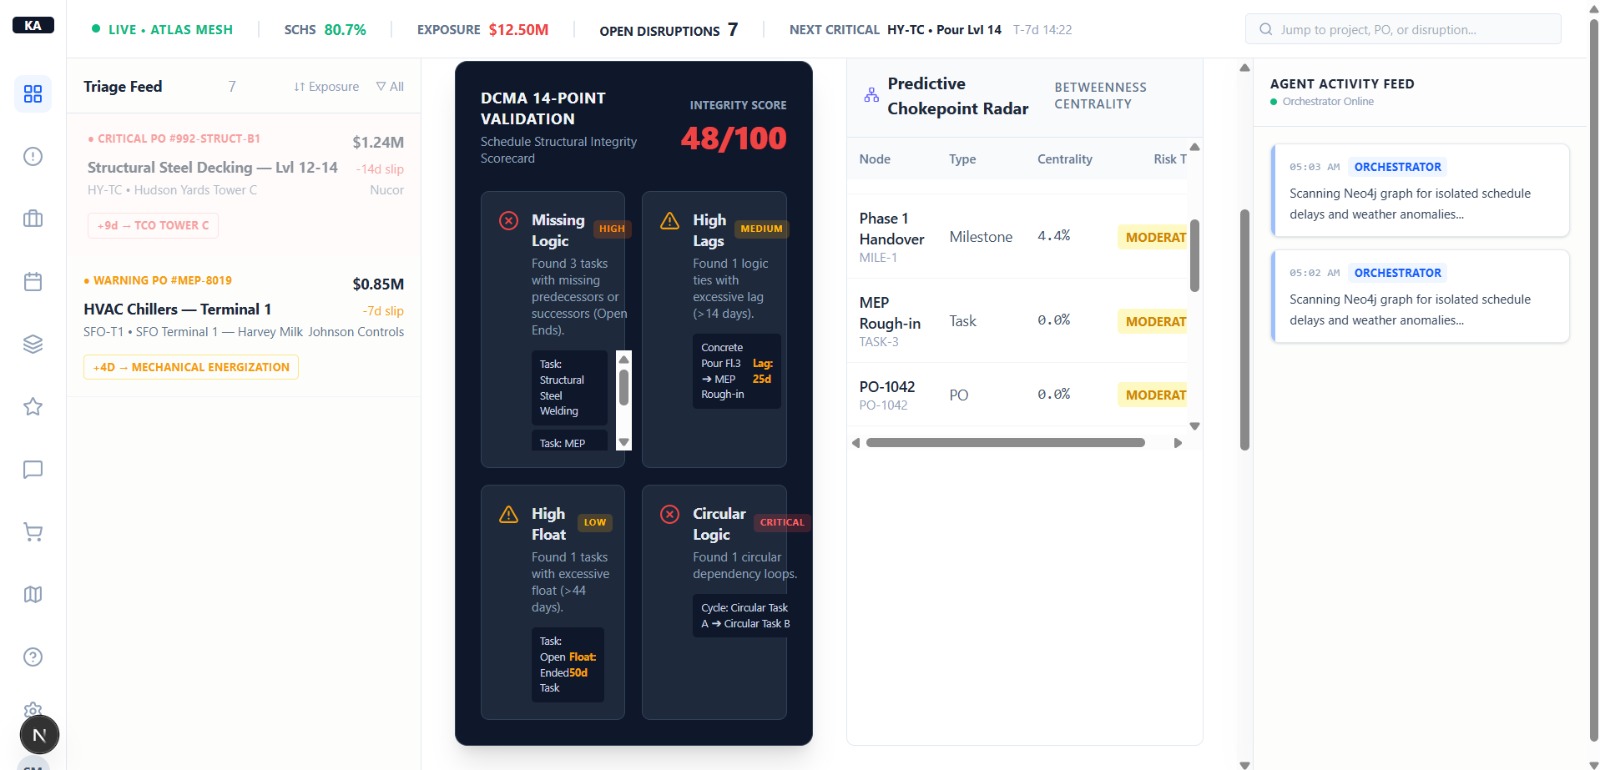
- DCMA Schedule Scorecard: A checker that automatically assesses schedule integrity, flagging missing logic, high float, lag anomalies, and circular dependencies.
- Chokepoint Centrality: A NetworkX analyzer that calculates betweenness centrality to identify critical logistics path bottlenecks.
- Blast Radius Analysis: A recursive traversal engine that computes the downstream impact of shipment delays on active equipment, trades, and contract penalties.
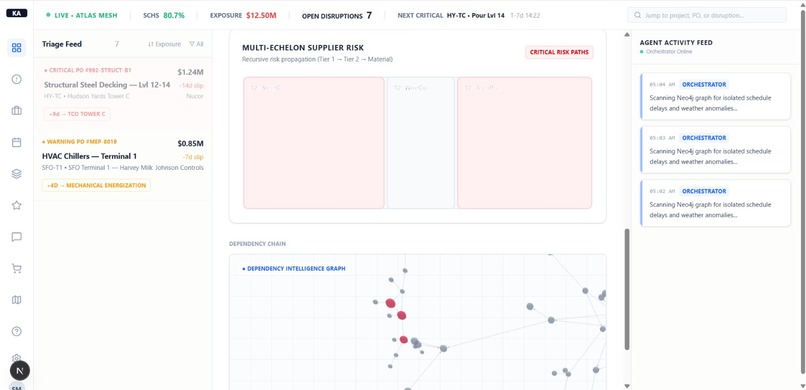
- Supplier Risk Propagation: A recursive algorithm that calculates supplier risk exposure scores based on downstream task dependencies.
5. Document & Vision Intelligence
- Document Ingestion ETL: An ETL pipeline utilizing multimodal foundation model schemas to parse structural steel submittal PDFs and write structured JSON entities to the database. Dedicated external APIs track real-time fabricator production visibility and monitor suppliers for financial bankruptcy risk.
- Submittal Compliance: A module that extracts yield strength and structural criteria from specification manuals and audits compliance.
- Substitution RFI Auto-Drafter: A copywriter engine that automatically drafts code-compliant RFIs proposing structural substitutions when material delays occur.
6. Agentic Orchestration & Communication
- Background Scheduler: An active orchestrator service that checks coordinate intersections with storms, triggers Monte Carlo simulations, writes alerts to agent memory, and broadcasts updates.
- FastAPI & WebSocket Controllers: Backend API layers that manage real-time connections and stream active logs to the client.
- Graph RAG Copilot Router: A natural language router that translates human queries into schema-grounded Cypher statements to query Neo4j.
7. Client Presentation Layer
- Interactive 3D Graph: Renders the complete supply chain twin using a 3D Force-Directed WebGL graph.
- Portfolio Health Tab: Computes and displays the 0-100 Supply Chain Health Score (SCHS) based on the financial ratio of delayed vs. on-time POs.
- Three-Week Lookahead Panel: Groups incoming deliveries against upcoming tasks to prevent field clashes.
- Innovation Suite Dashboard: Houses the ROI calculator, simulated VLM scanning counts, and the RFI drafter in a single UI console.
- Live Simulated Feeds: Visual charts displaying Monte Carlo curves, knapsack budget allocations, and NOAA weather radar overlays.
Target Implementation Architecture (Remaining 25% Future Roadmap)
The remaining 25% of the system architecture comprises advanced infrastructure scaling, closed-loop machine learning loops, and deep computer vision integrations:
1. Operations Research (OR) Subsystems
- Autonomous Smart Contract Swaps: Upgrading the Swap Market solver to execute material swaps via blockchain smart contracts, allowing project agents to negotiate and sign agreements without manager intervention.
2. Databases & Infrastructure Scaling
- Horizontal Graph Partitioning: Implementing multi-project database sharding on Neo4j for massive portfolios, utilizing a global directory service to coordinate cross-shard traversals.
- CDN Edge Caching: Distributing 3D WebGL assets and client bundles globally to ensure fast page loads for field engineers on remote, low-bandwidth networks.
3. Machine Learning & Forecasting
- Continuous Model Evaluation: Building an automated validation pipeline to monitor Gradient Boosting regressor drift and output confidence interval coverage plots in real time.
4. Graph Analytics & Topology
- Generative Re-sequencing: Developing an optimization solver that automatically decouples soft constraints (non-safety critical dependencies) to bypass blocked schedule paths.
5. Document & Vision Intelligence
- VLM Drawing Comparison: Implementing a vision-based comparison system using a Multimodal Intelligence Layer to compare structural shop drawings directly with site photos, identifying sequence violations and estimating installation progress.
- VLM Inventory Scanner hardware integration: Bridging our simulated VLM counts with physical laydown yard camera feeds and autonomous drone image arrays.
Future Exploratory Roadmap: Brownie Features
If our project is encouraged, we will do our level best to implement these advanced "Brownie Features" to expand Atlas into the financial and legal layers of construction management:
1. Algorithmic Parametric Delay Hedging (The "Financial Layer")
- The Concept: Since Atlas uses Monte Carlo simulations and quantile forecasting models to generate highly accurate probability curves for project delays (P90 worst-case scenarios), the platform can act as an automated risk-hedging financial engine.
- The Implementation: If the Monte Carlo PERT simulator calculates that the probability of missing a critical handover date has exceeded 45% (which would trigger \$50,000/day in contract liquidated damages), Atlas will automatically execute a financial hedge. It will interface with commercial Parametric Insurance APIs (such as Arbol or Descartes Underwriting) to instantly purchase a micro-insurance policy against specific weather events or port strikes. If the delay happens, the automated parametric insurance payout offsets the liquidated damages. Atlas doesn't just manage risk; it financializes it.
2. Blockchain Smart Contracts for Cross-Project Cannibalization
- The Concept: While Cross-Project Cannibalization (the Swap Market) is mathematically optimal, in reality, different mega-projects are often managed by different financial entities, joint ventures, or legal owners. A project manager cannot simply transfer structural steel from Project A to Project B without triggering massive accounting and legal disputes over cost-transfers, accounting ledgers, and inventory ownership.
- The Implementation: We will tokenize the physical materials in laydown yards. When the Swap Market solver recommends moving structural steel from Terminal 1 to Tower C, Atlas will generate a Smart Contract on a private enterprise blockchain (such as Hyperledger Fabric). This contract will automatically execute the financial transaction—transferring the material cost from Tower C's ledger to Terminal 1's ledger the exact moment the VLM Scanner confirms the truck has physically moved the material between sites. This creates a frictionless, legally auditable, zero-trust marketplace for surplus materials.
Built With
- computervision
- digitaltwin
- docker
- fastapi
- googleortools
- graphrag
- knowledgegraph
- machine-learning
- montecarlo
- neo4j
- networkx
- nextjs
- numpy
- operationsresearch
- pandas
- postgresql
- pydantic
- python
- react
- scikitlearn
- sqlite
- typescript
- websockets
- xgboost

Log in or sign up for Devpost to join the conversation.