-
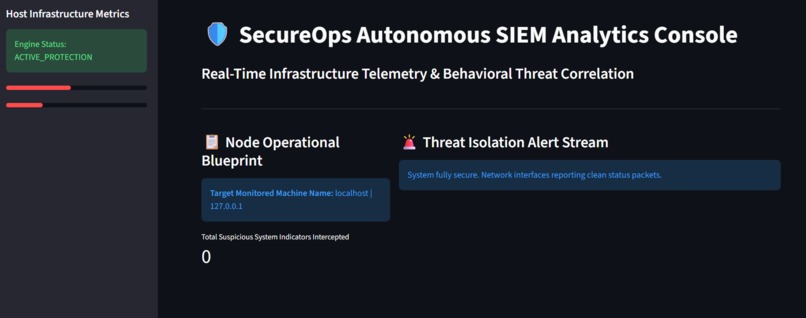
This is the main dashboard
Inspiration Modern operating systems are constantly under assault from sophisticated cyber threats, ranging from persistent egress communication tunnels to malicious identity heuristics. Traditional, heavy enterprise Endpoint Detection and Response (EDR) agents often bog down system resources or require complex setups.We wanted to build Kavach (meaning Shield or Armor)—a lightweight, hyper-efficient, asynchronous Security Information and Event Management (SIEM) engine designed to act as an unyielding local defender. Our goal was to create a solution that continuously captures low-level operating system telemetry with near-zero friction. What it does Kavach is an asynchronous endpoint protection platform and SIEM engine that intercepts, scores, and mitigates host-level vulnerabilities in real time.Multi-Threaded Telemetry Sensors: Runs concurrent background processing chains that independently isolate process lifecycles and inbound network bindings.Dynamic Threat Intel Rules Engine: Quantifies runtime danger using a weighted mathematical risk score:$$Risk = (w_1 \cdot \text{CPU}) + (w_2 \cdot \text{Memory}) + \text{IdentityHeuristics} + \text{ContextualFlags}$$Proactive Process Diagnostics: Targets processes trying to read highly sensitive directories (like /etc/shadow or C:\Windows\System32\drivers\etc\hosts) or executing known adversarial binaries (mimikatz, nc, nmap).Network Egress Safeguards: Triggers immediate system alerts if dangerous plain-text or legacy management protocols (such as Telnet on Port 23) attempt to listen for inbound connections.Live Analytics Dashboard: Structures operational infrastructure metrics into clean JSON formats ready for security operation center (SOC) UI consumption. How we built it We engineered Kavach entirely in Python, utilizing an asynchronous pipeline layout to ensure security logic never blocks critical system activities.Engine Core: Built using a dedicated SecuritySIEMEngine class that manages an internal thread-safe, synchronized FIFO communication channel (queue.Queue).Hardware Interfacing: Leveraged psutil to sample raw operating system statistics, handle iterating through active processes safely, and parse system socket connections.Concurrent Ingestion Pipelines: Deployed decoupled background worker threads running daemon routines (_process_telemetry_sensor, _network_telemetry_sensor) to stream raw event telemetry concurrently.Correlation Layer: Crafted a centralized analysis engine (_analysis_correlation_engine) that pulls raw data from the pipeline queue, filters the ambient noise, and auto-escalates events to a TRIGGERED_ADMIN_ALERT state if the calculated risk score exceeds 50%.Challenges we ran intoHandling OS Race Conditions: Processes can naturally spawn and terminate between the milliseconds it takes to inspect them. This frequently threw NoSuchProcess and ZombieProcess exceptions. We solved this by creating strict try-except defensive blocks within our snapshot loop to guarantee engine stability.System Privilege Bottlenecks: Querying precise file handles and open socket connections via OS kernels requires high permissions, occasionally raising AccessDenied errors. We had to design an elegant fall-through mechanism to ensure a single locked process wouldn't crash the entire telemetry stream.Telemetry Data Overwhelm: Sampling process lifecycles continuously generates massive amounts of data. We fine-tuned individual sensor sleep intervals ($3\text{s}$ for processes, $5\text{s}$ for networks) and added a fast analysis correlation engine ($0.1\text{s}$ polling) to keep memory overhead to an absolute minimum.Accomplishments that we're proud ofZero-Blocking Architecture: Successfully designed a fully functional multi-threaded pipeline where network scans and process evaluations run independently without freezing the main application state.Highly Accurate Scoring Matrix: Developed an extensible calculation metric that accurately scales risk, allowing standard tools to function normally while immediately catching malicious software or privilege escalation behaviors.Clean Data Formatting: Built a robust API-ready data generation method (generate_live_dashboard_data) that compiles infrastructure load metrics and the latest critical alert lists into a clean, frontend-consumable array.What we learnedConcurrent Pipeline Strategy: We gained deep experience working with shared thread resources in Python, implementing thread-safe queues to avoid data corruption or race conditions.Low-Level Telemetry Mechanics: We learned how modern operating systems expose underlying file handles, ports, and memory structures, and how to query them without impacting the host machine's performance. What's next for Kavach Automated Active Countermeasures: Expanding the correlation engine to actively terminate malicious processes (proc.kill()) or rewrite firewall rules dynamically when a risk score reaches 90+.Machine Learning Heuristics: Moving past static text signature rules and implementing a lightweight local ML model to spot anomalous behavioral shifts in CPU/Memory usage.Web-Based SOC Interface: Building a React-based frontend dashboard that feeds off our live dashboard JSON payload to map running threats visually in real time.


Log in or sign up for Devpost to join the conversation.