-
-
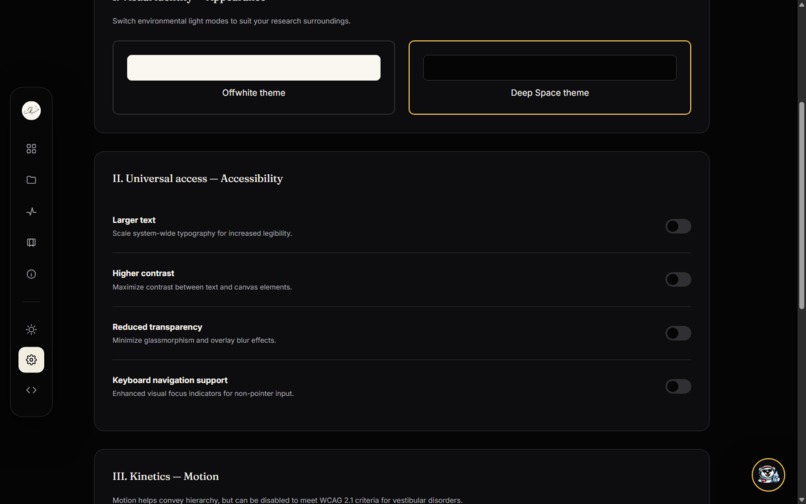
Settings page
-
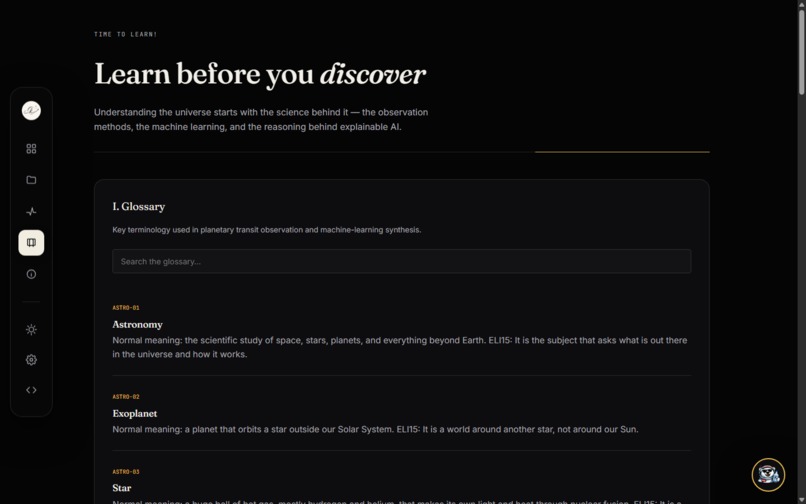
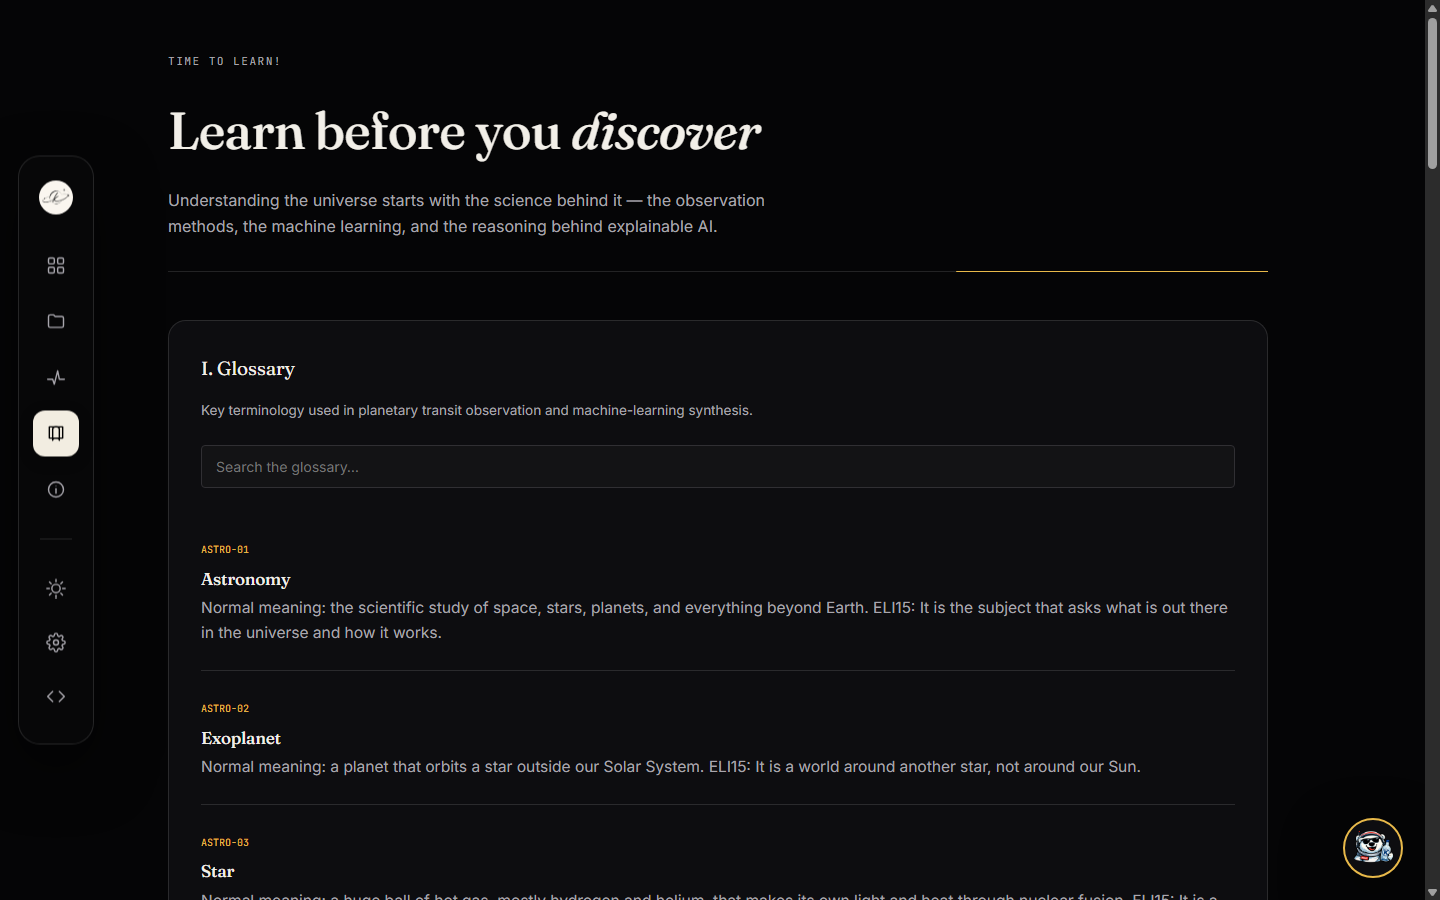
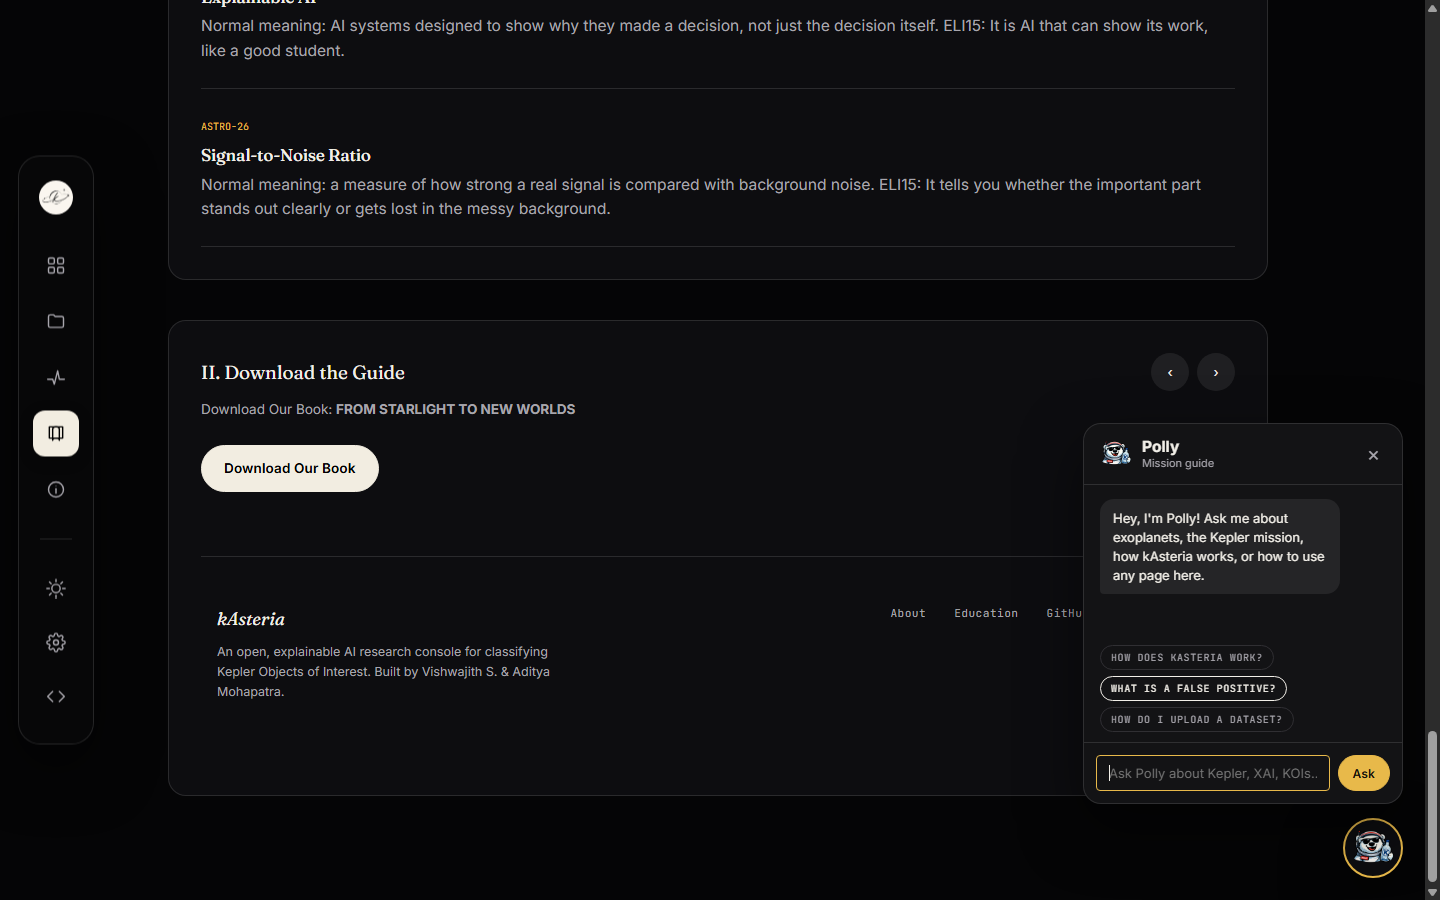
Education
-
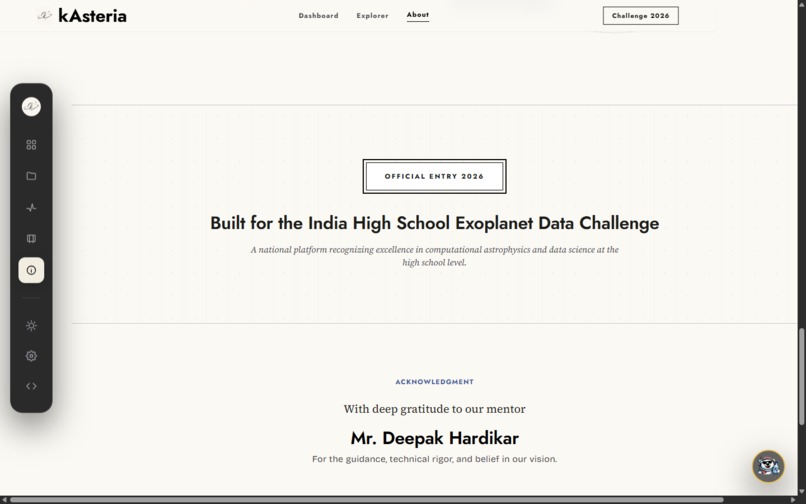
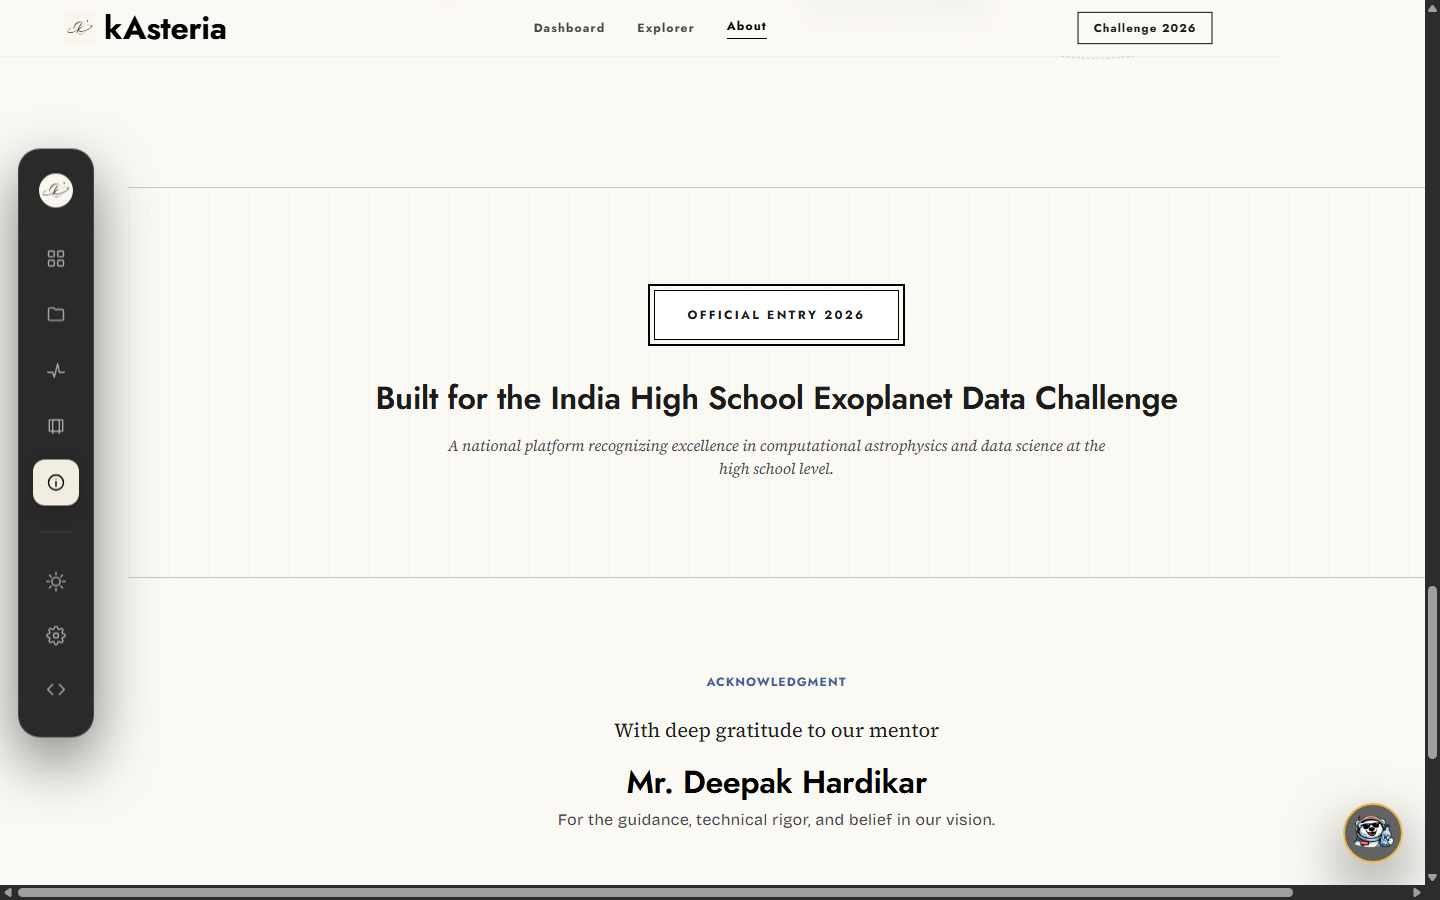
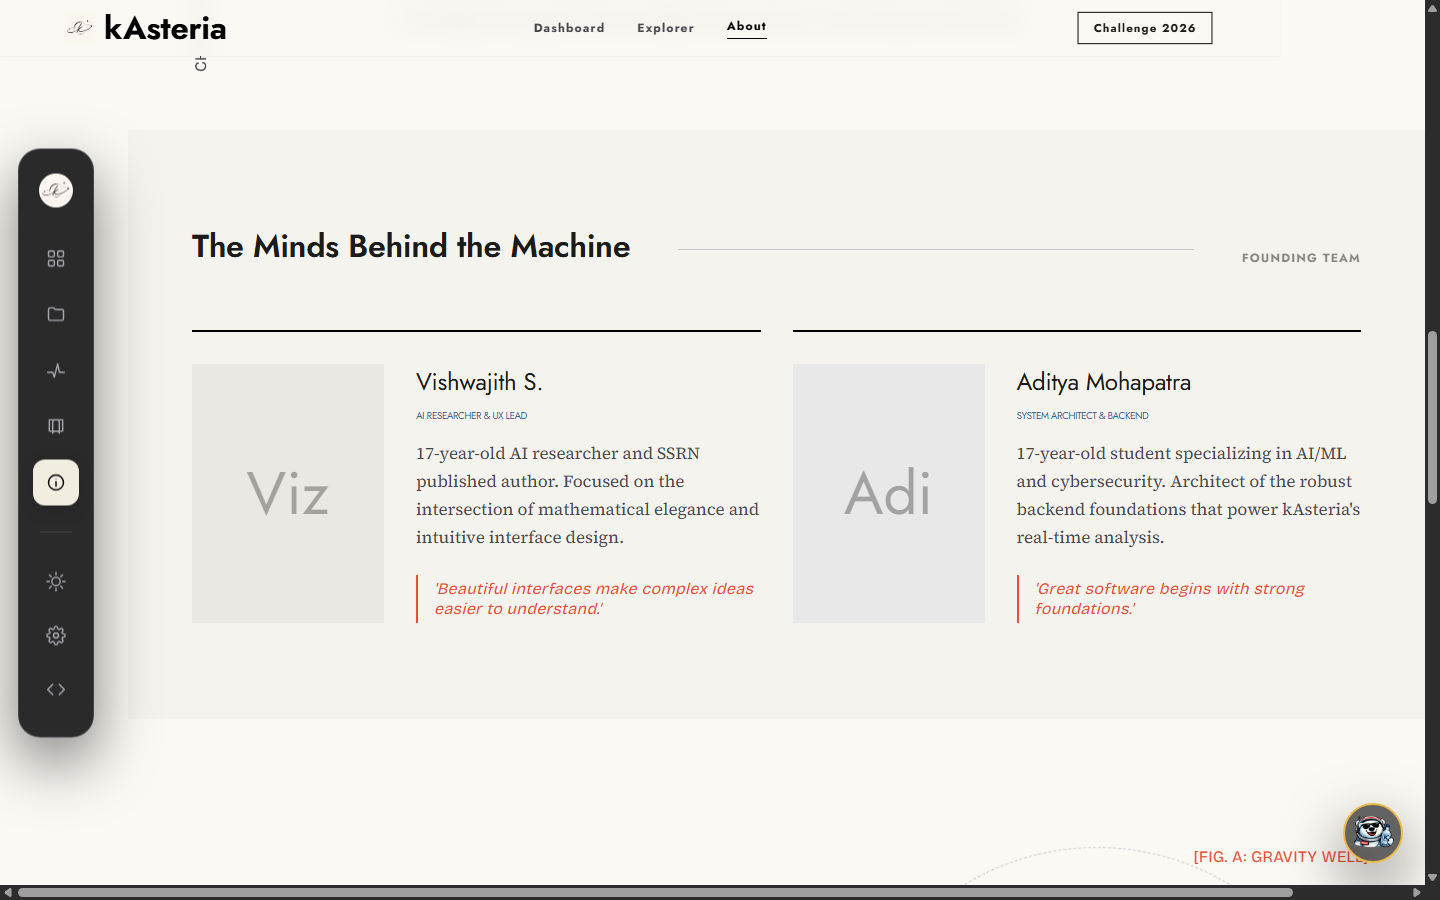
About Us
-
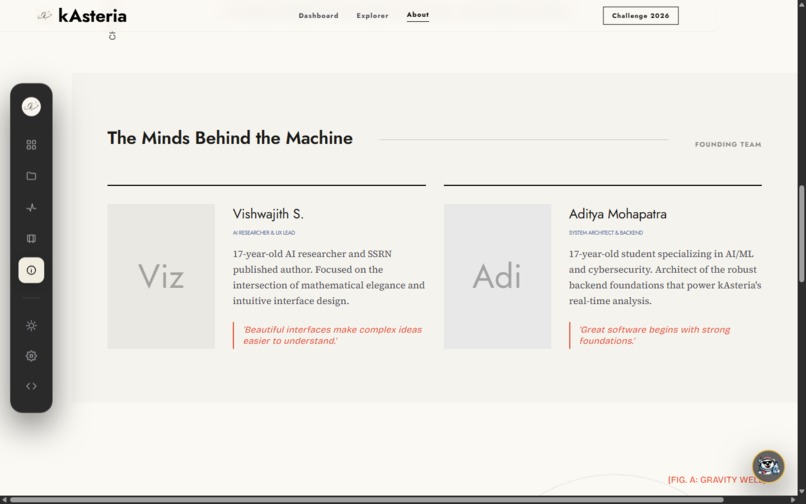
About Us
-
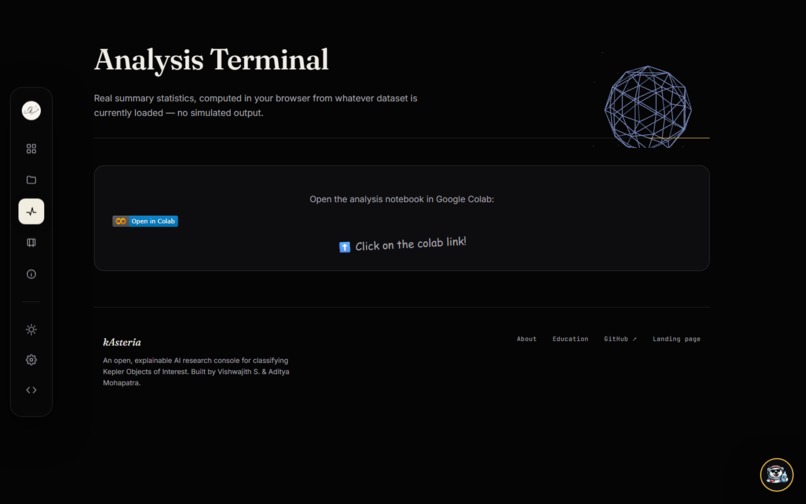
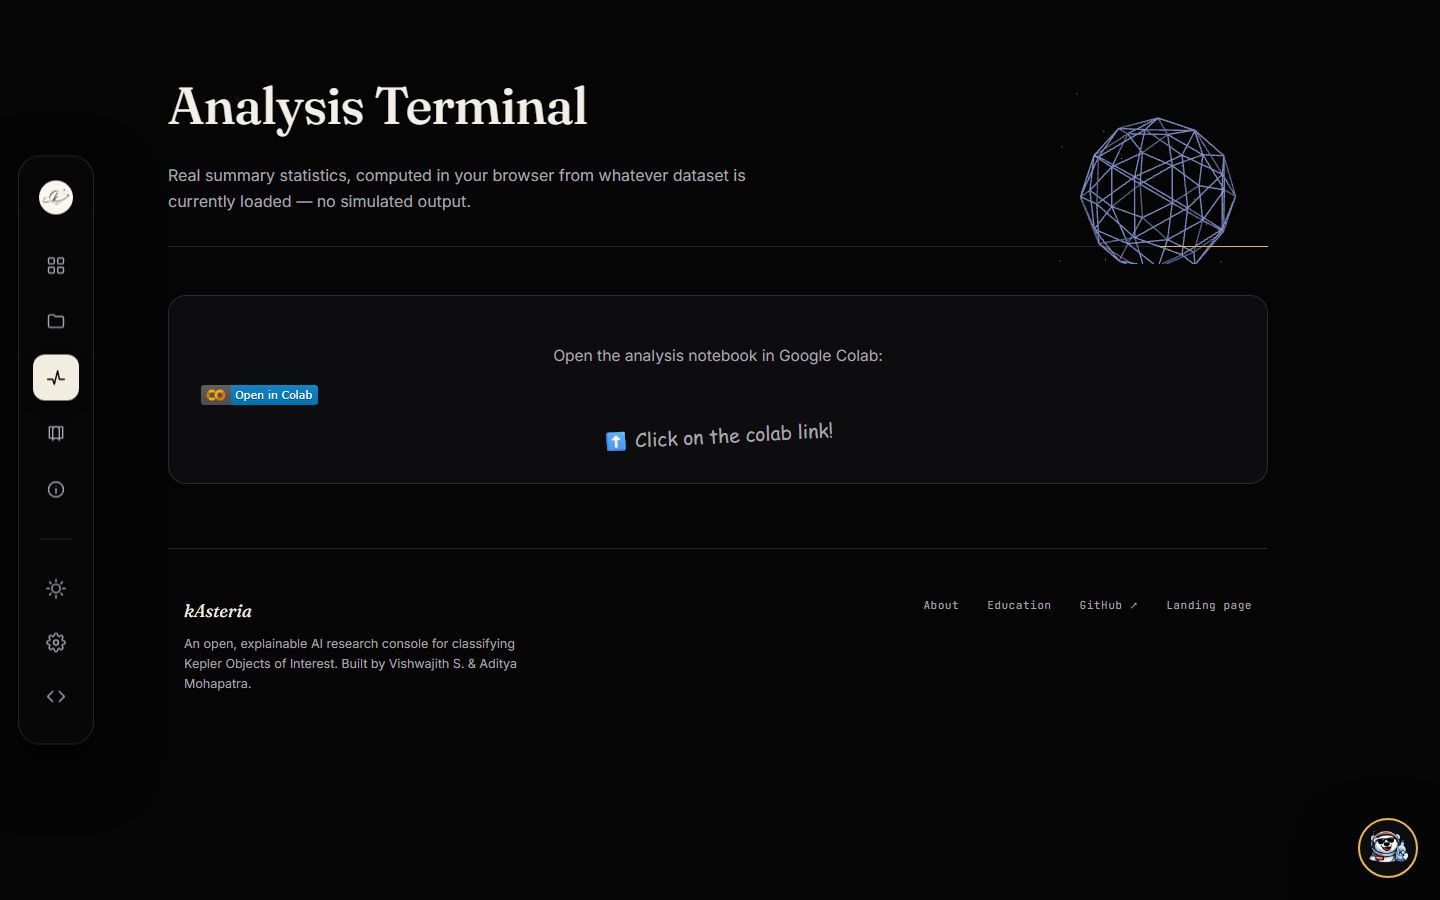
Analysis Terminal
-
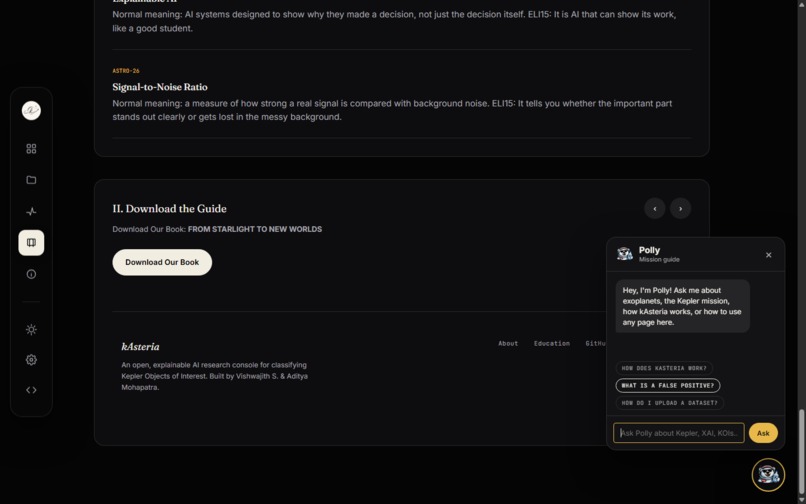
Education
-
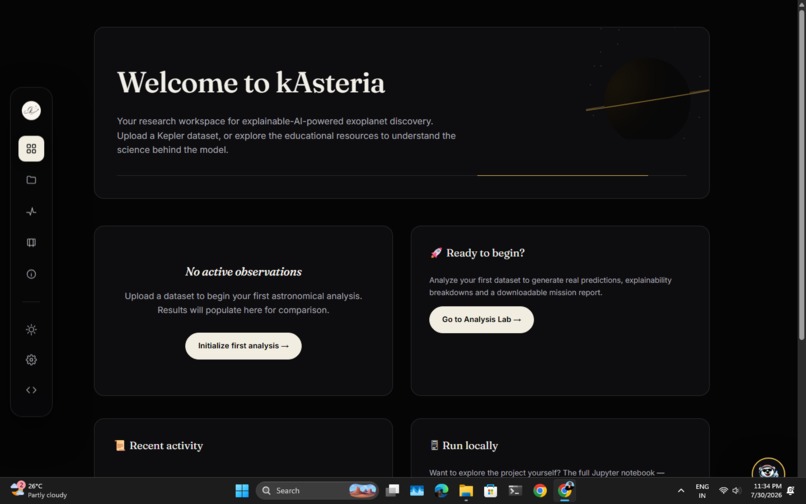
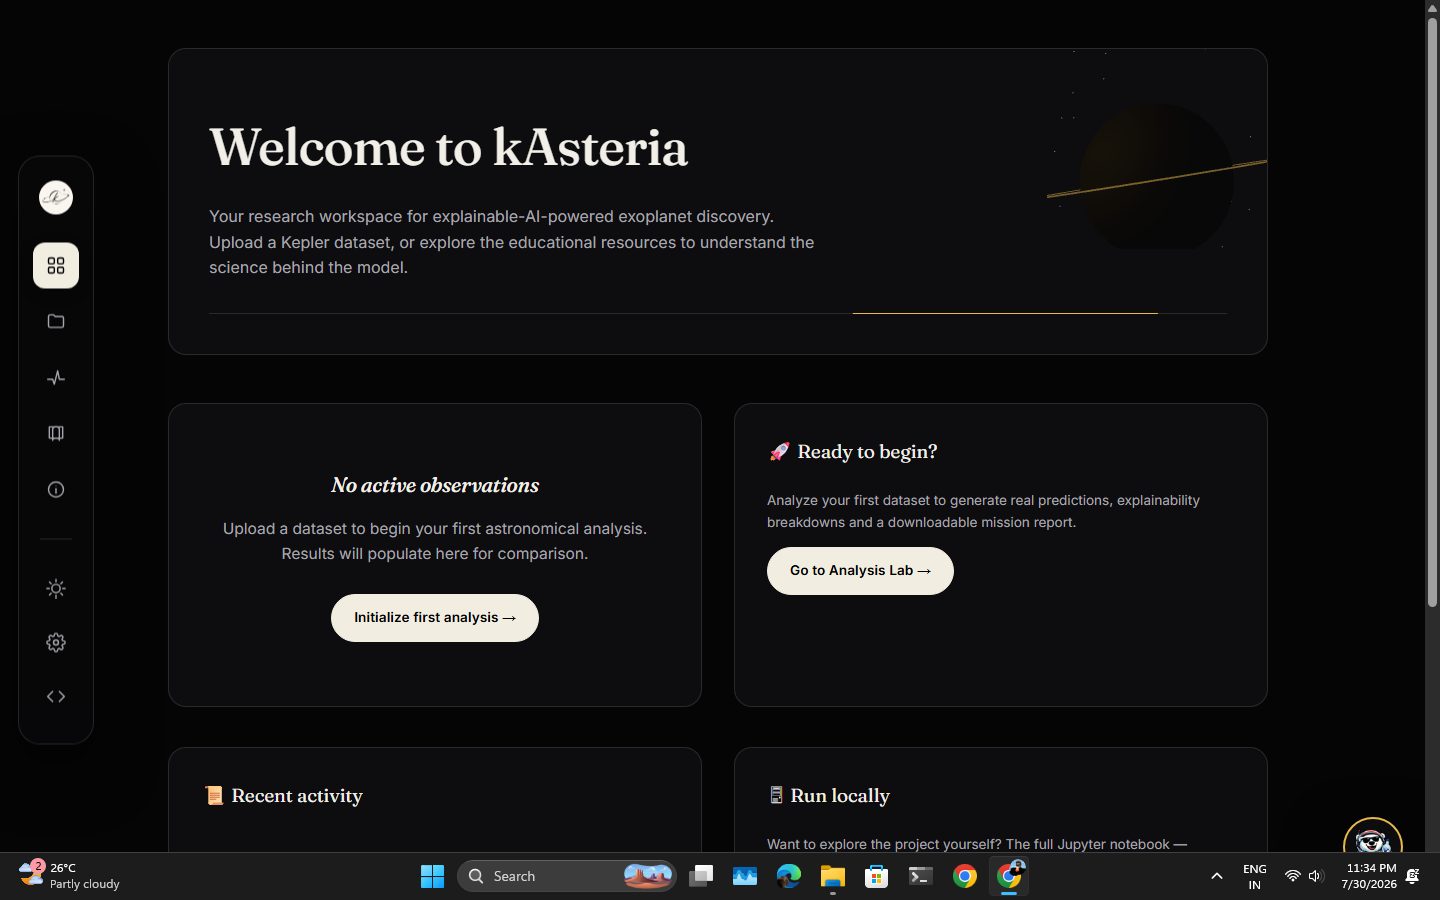
Dashboard
-
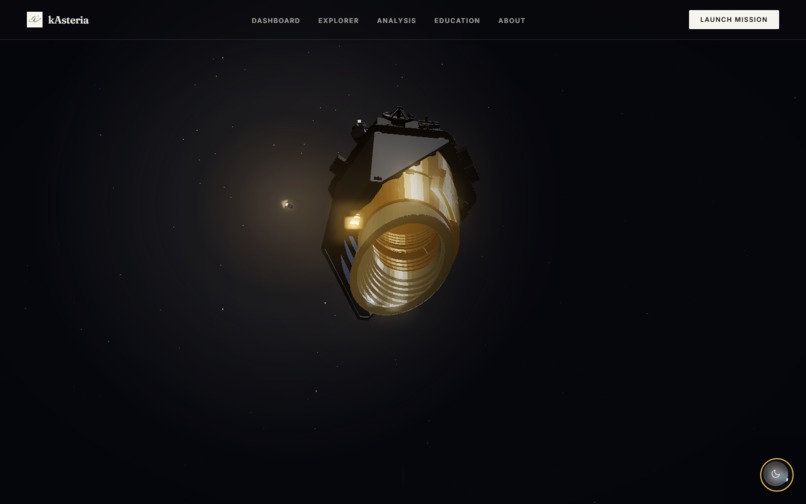
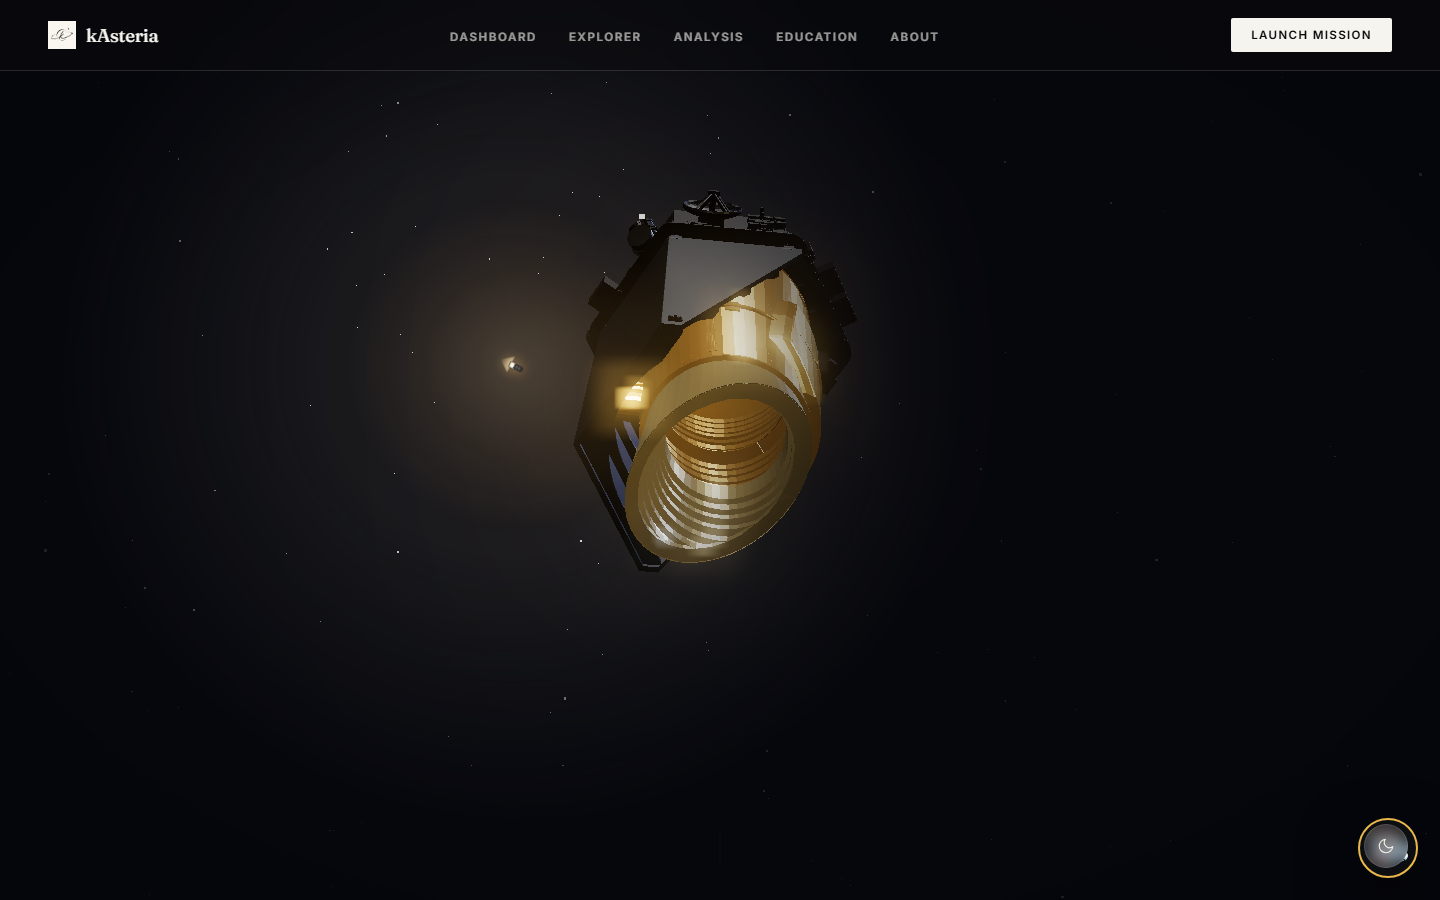
Landing Page (make sure to check this one out)
-
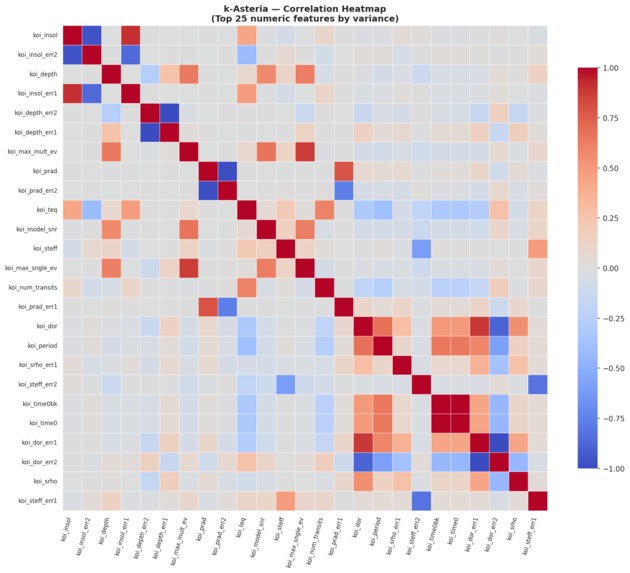
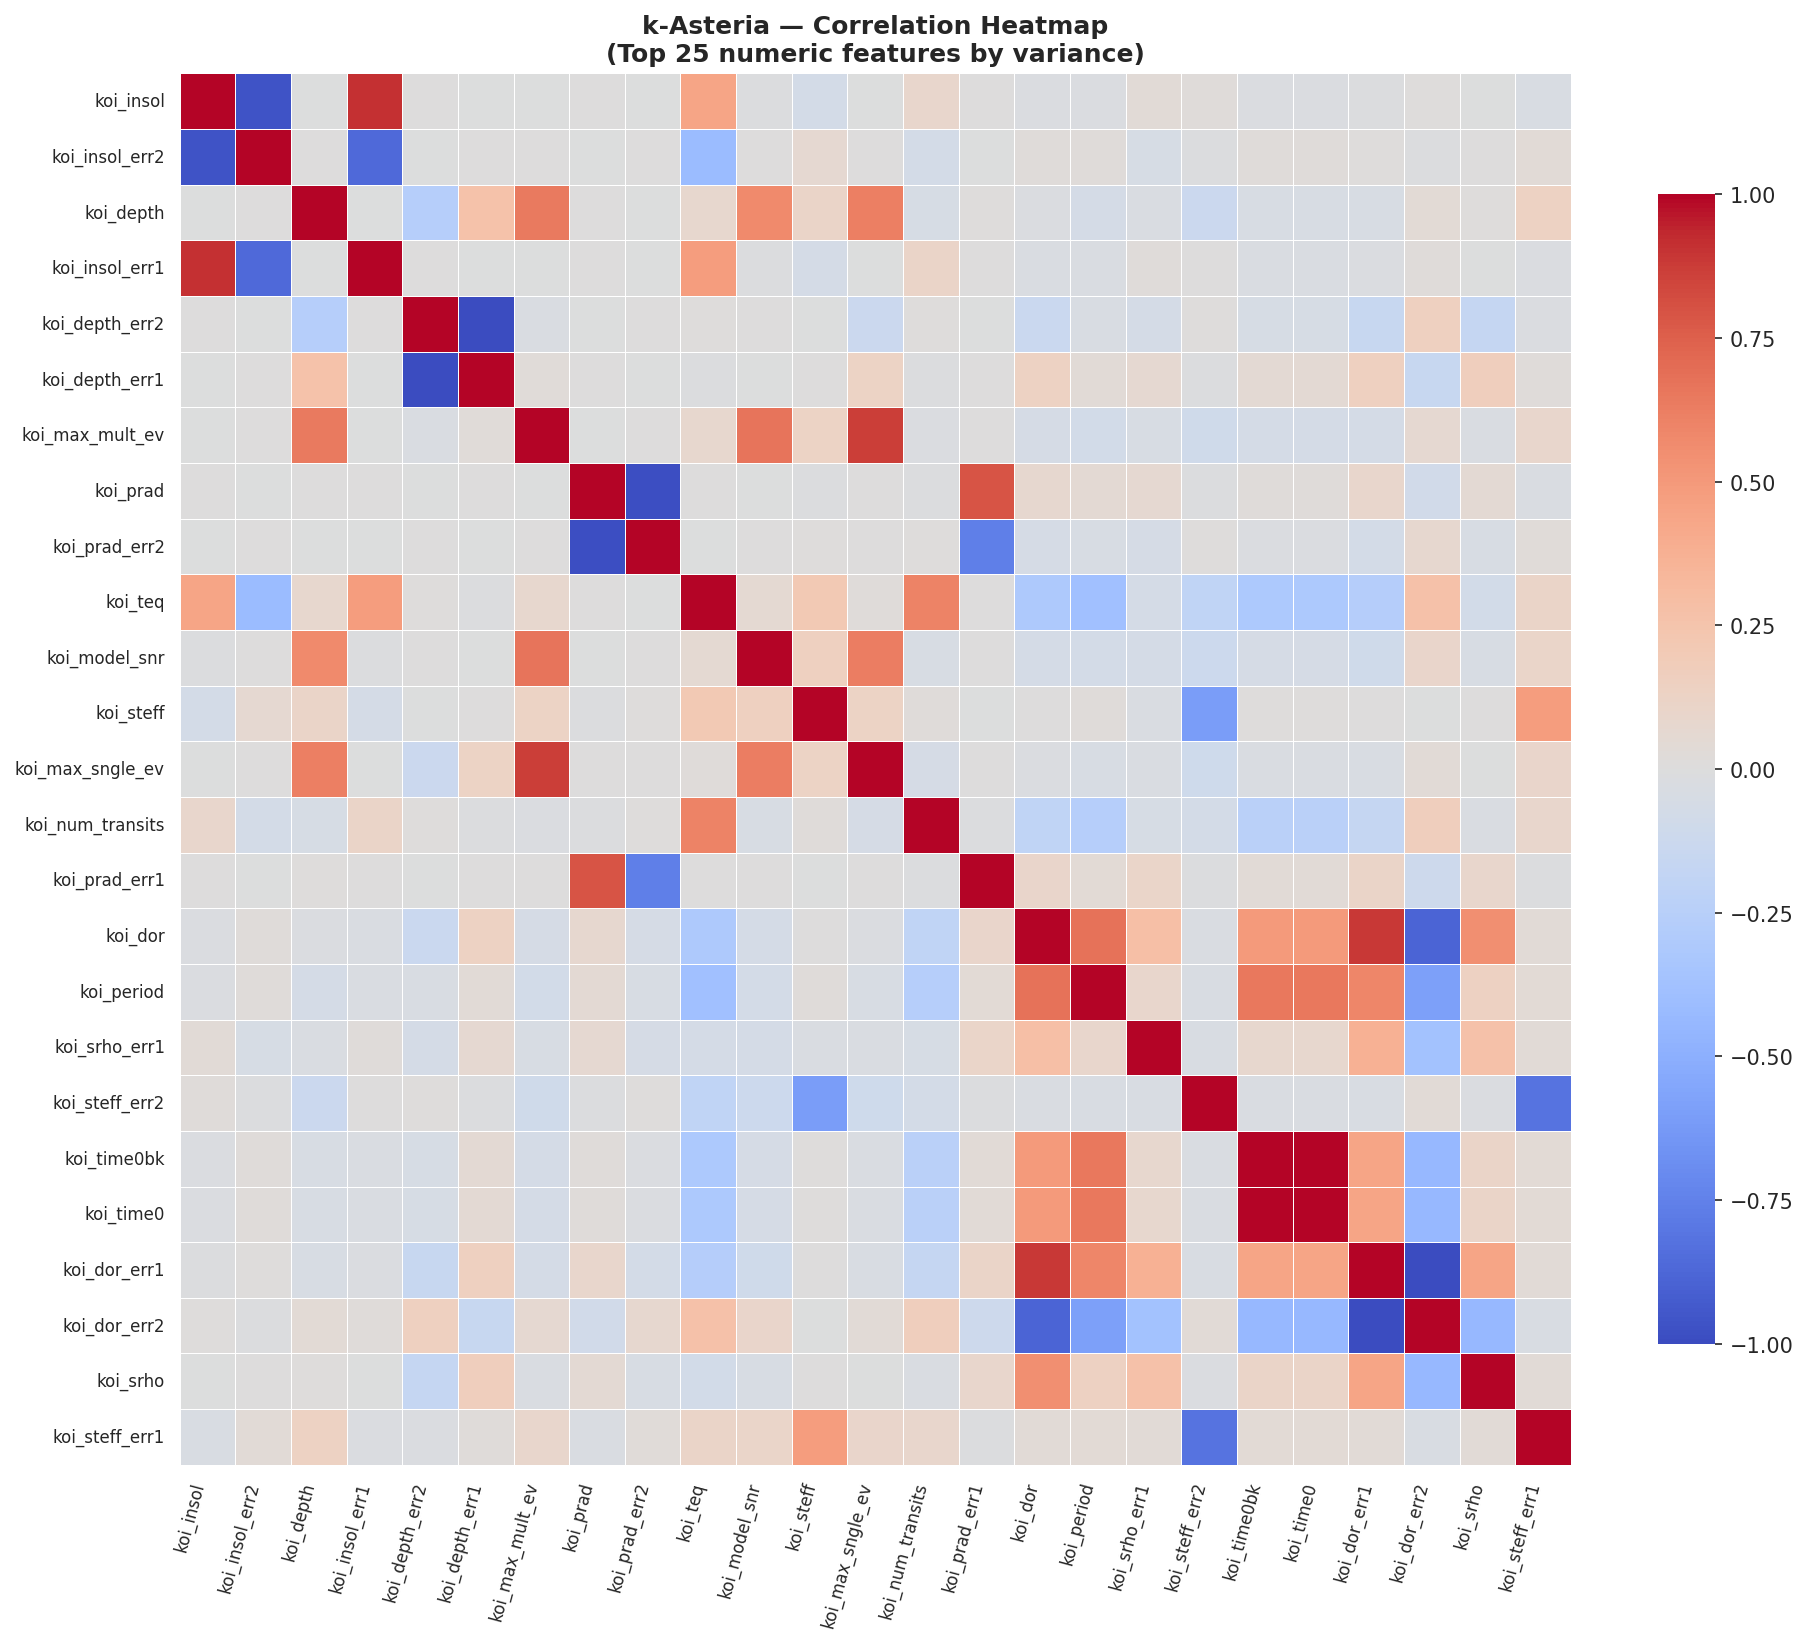
Stage1: Correlation Heat Map
-
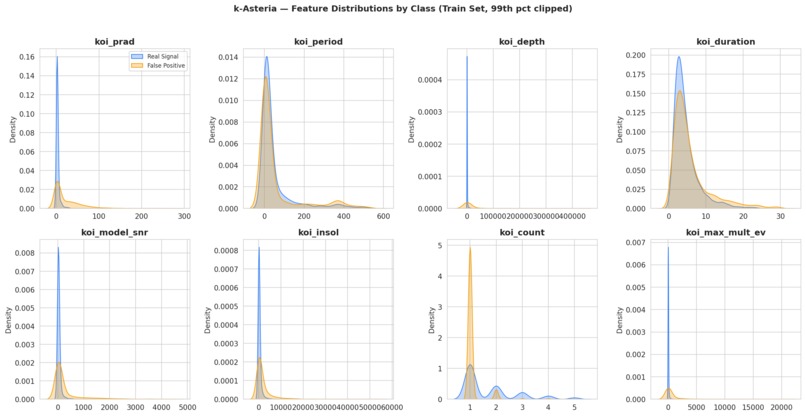
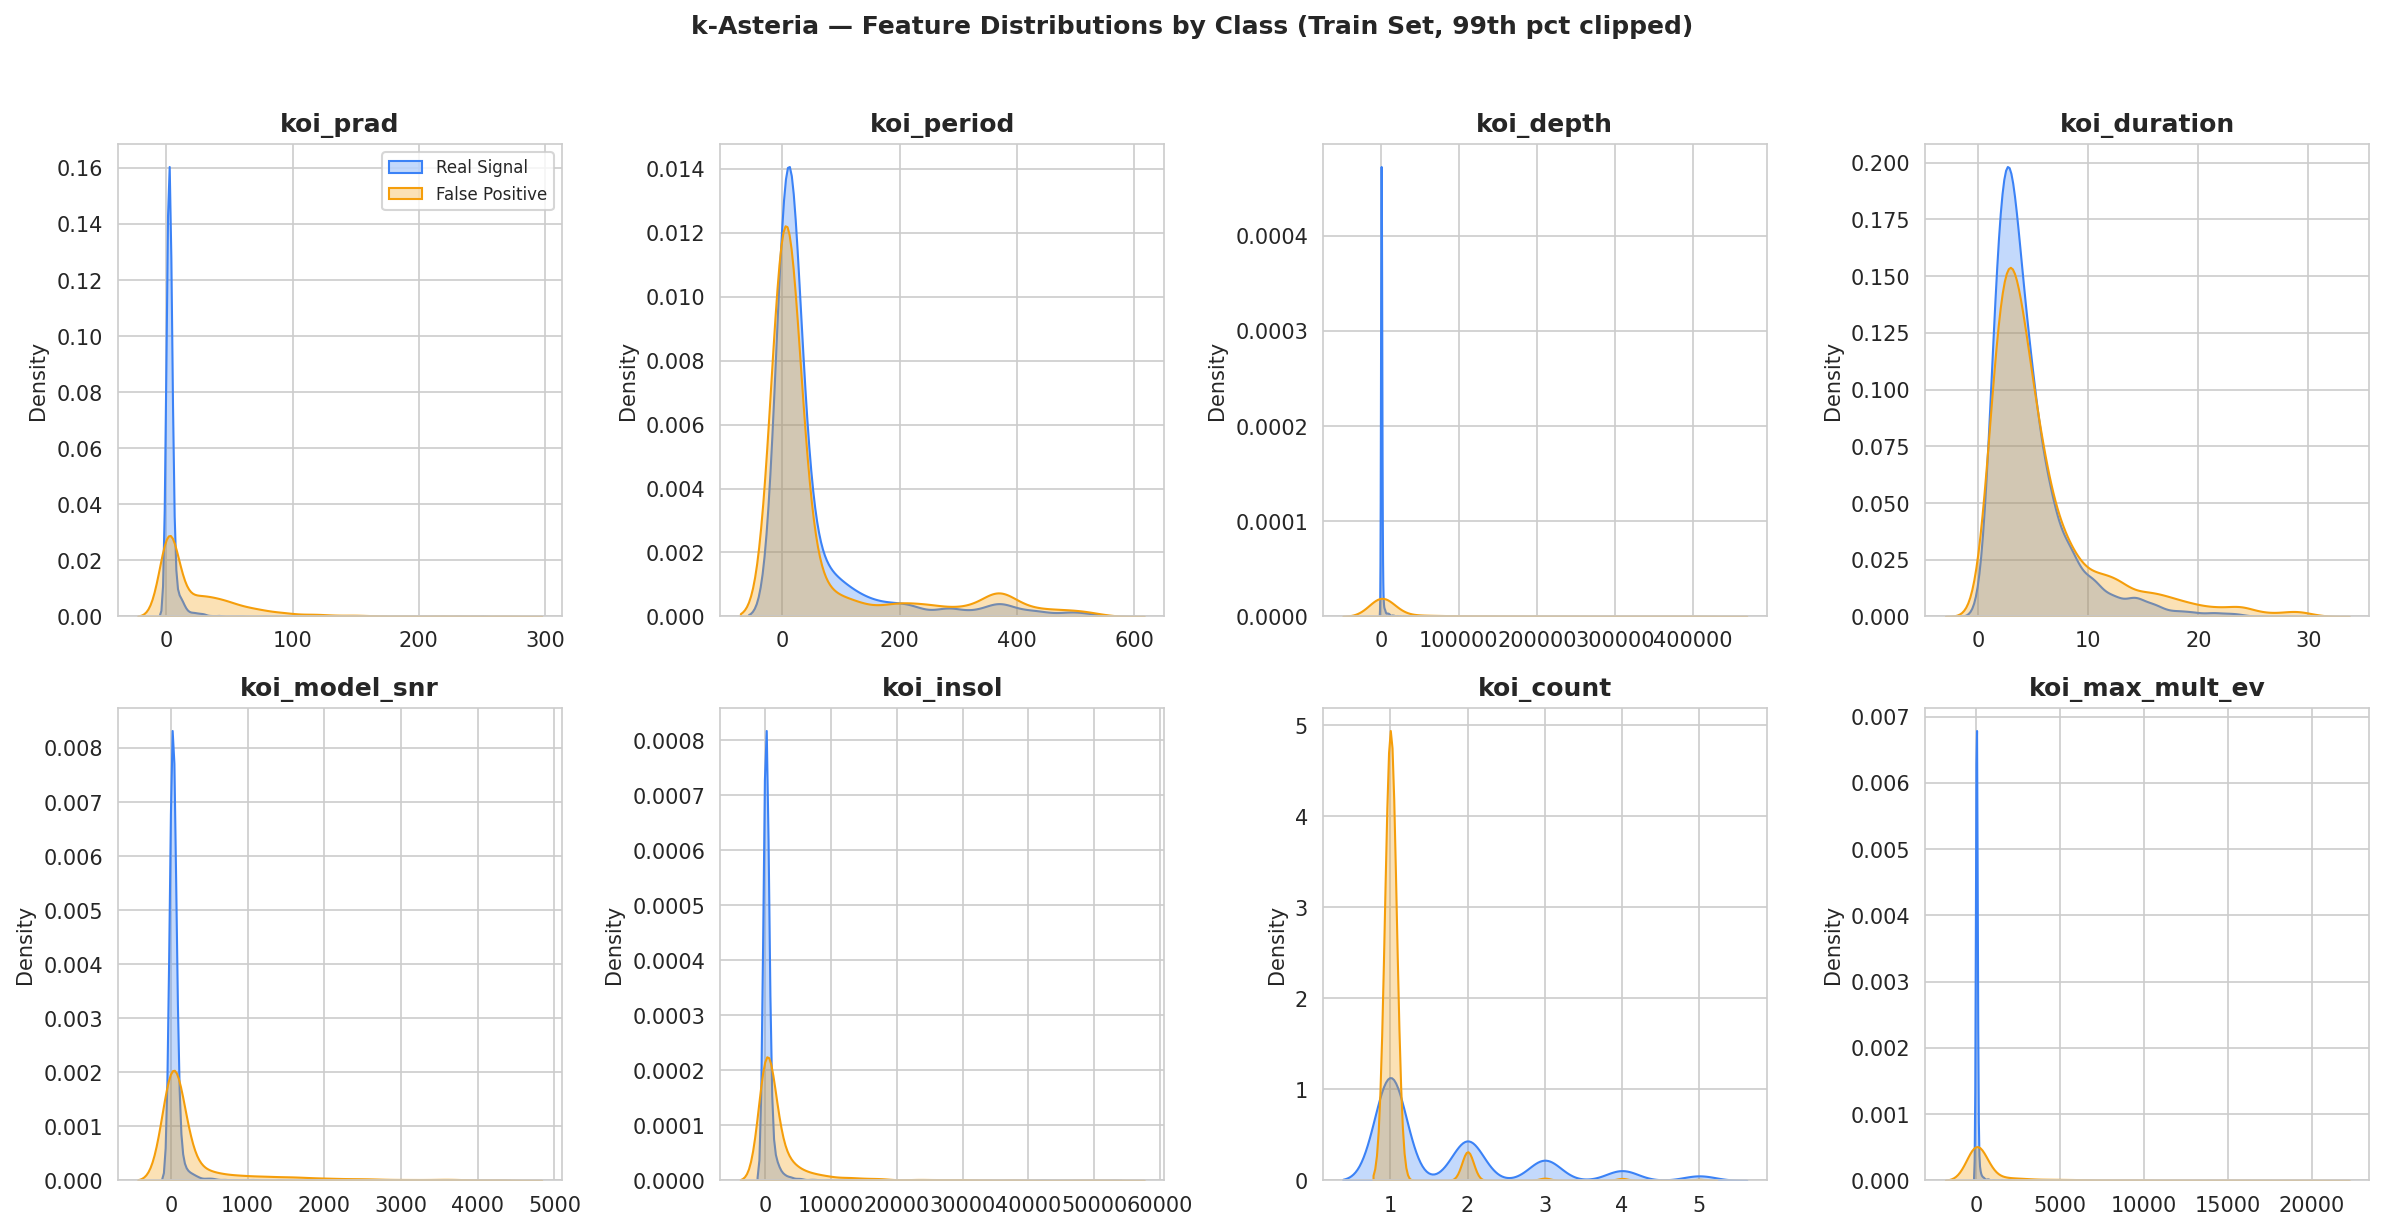
Stage1: Feature Distributions
-
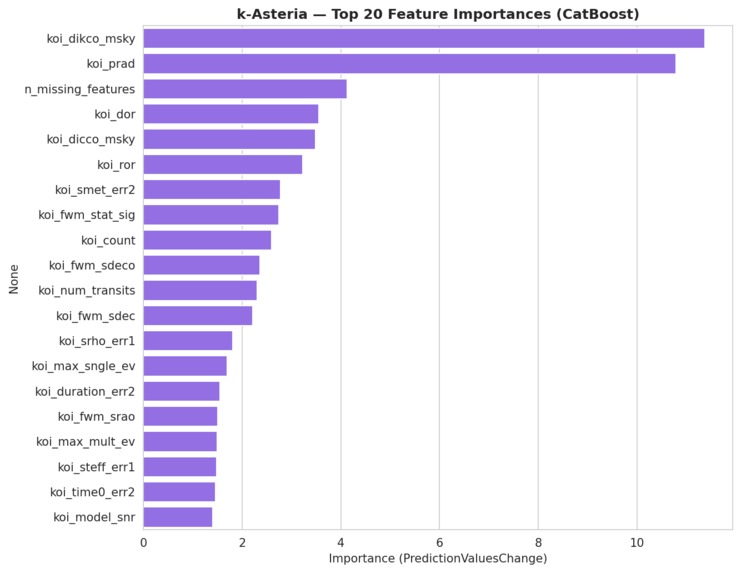
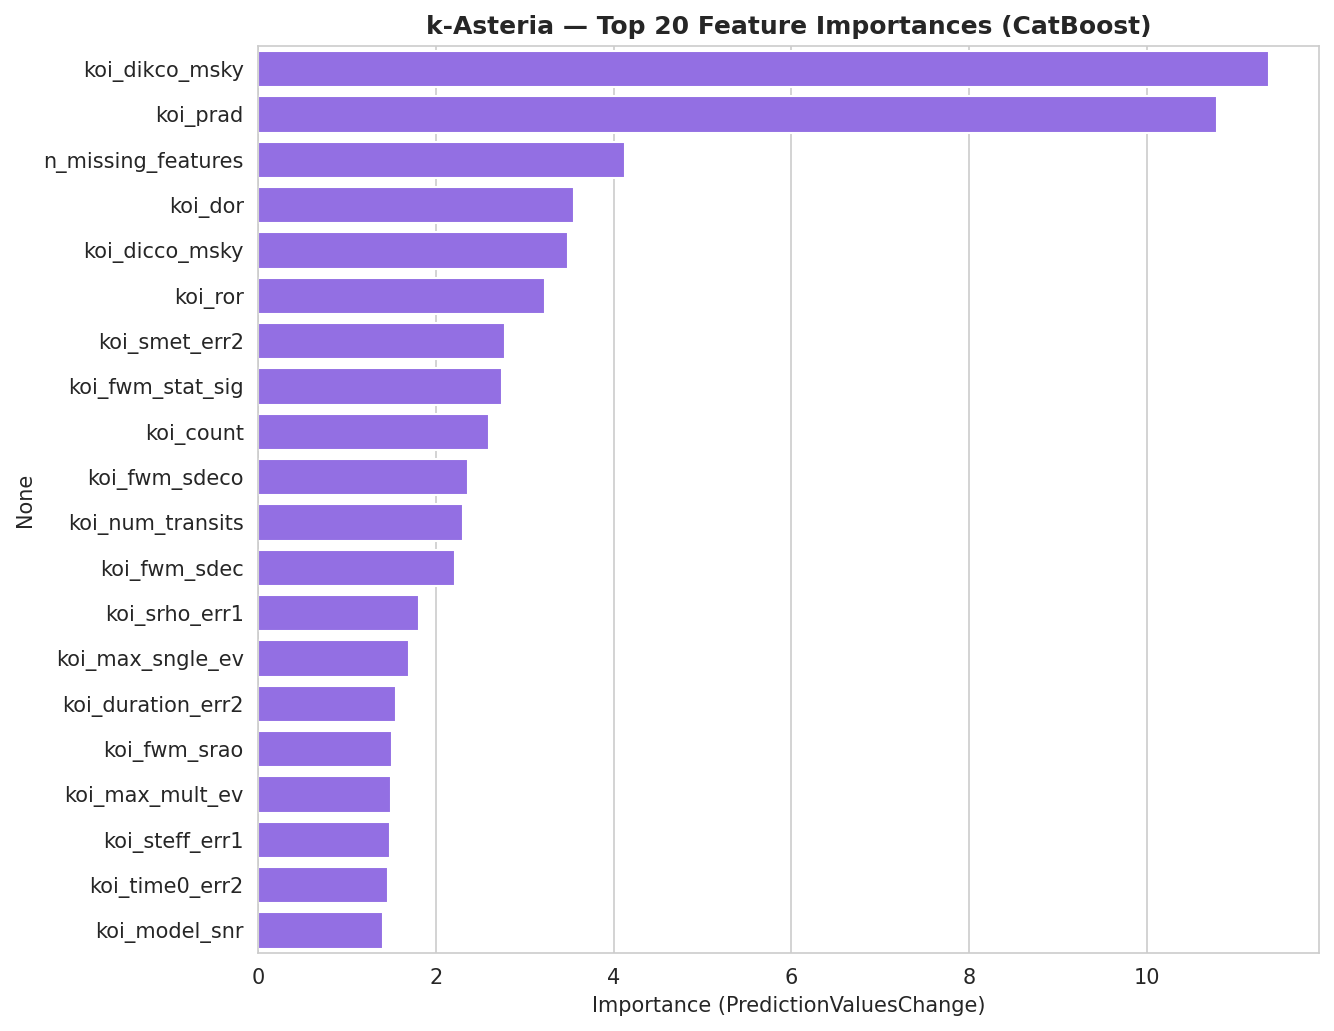
Stage2: Feature Importance
-
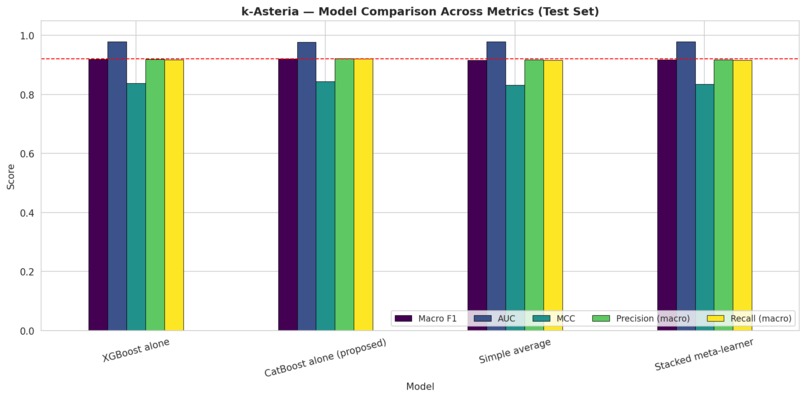
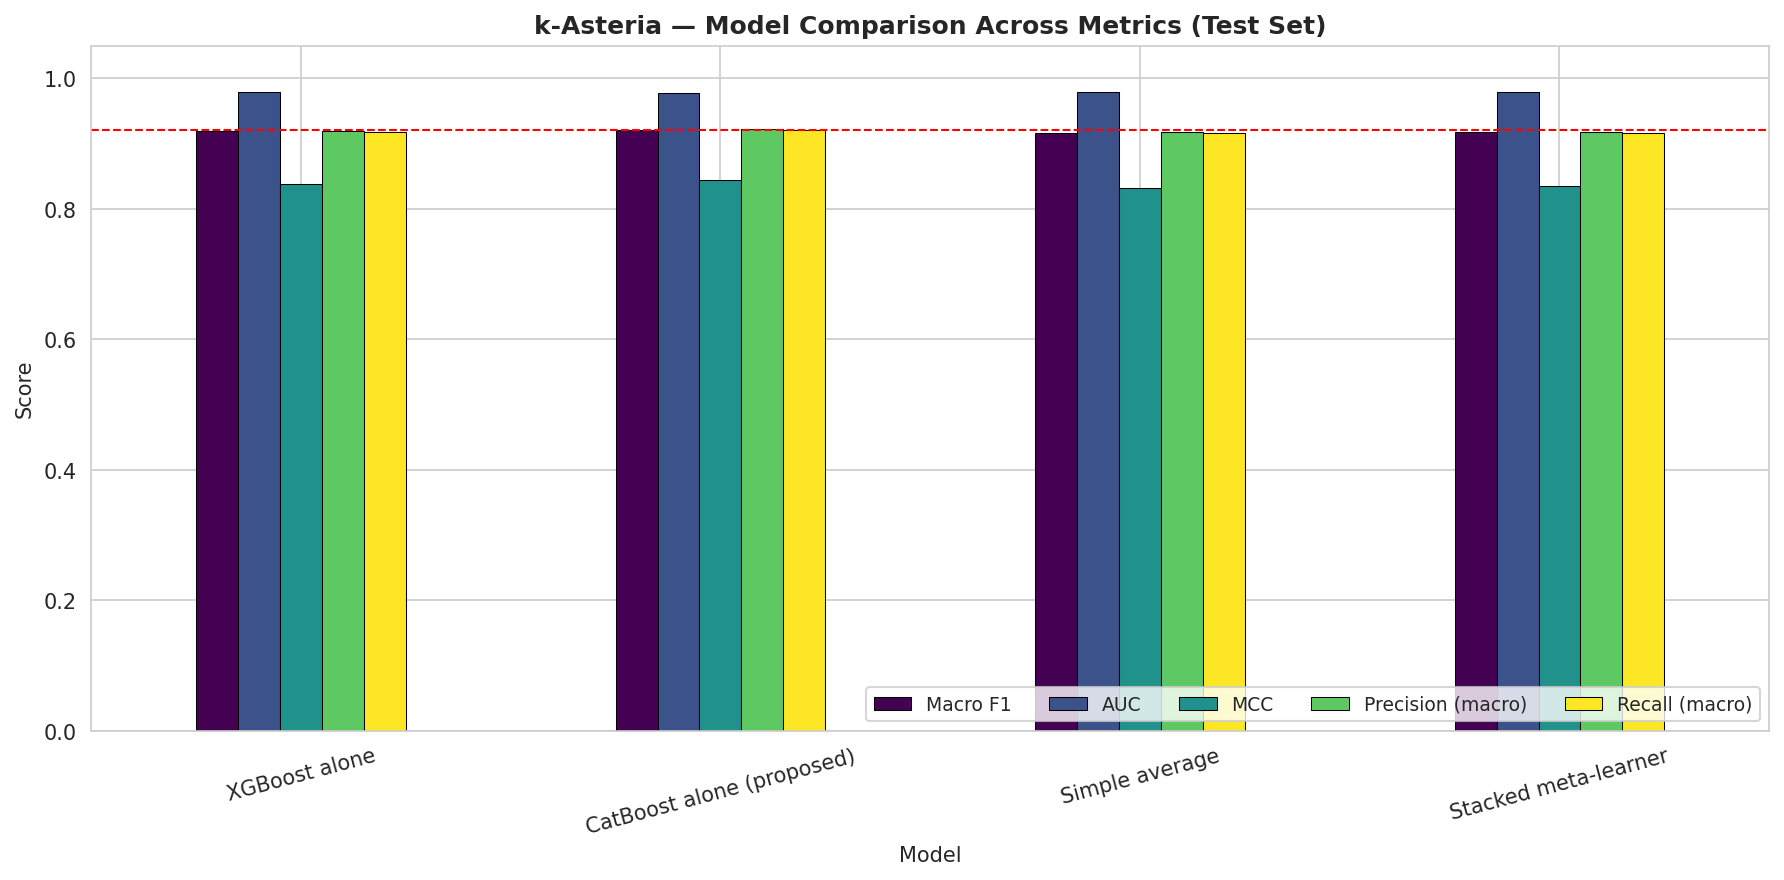
Stage2: Model Comparison Chart
-
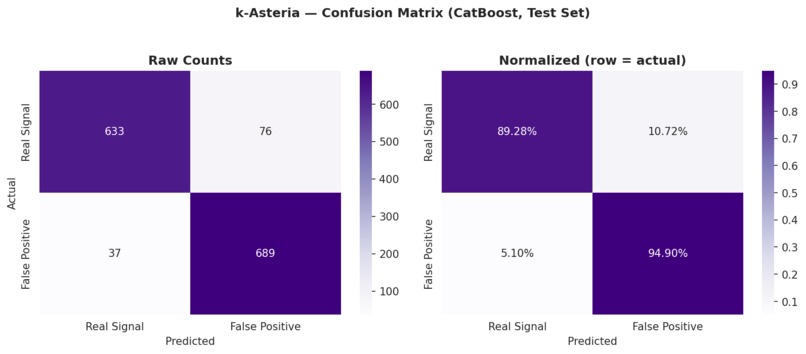
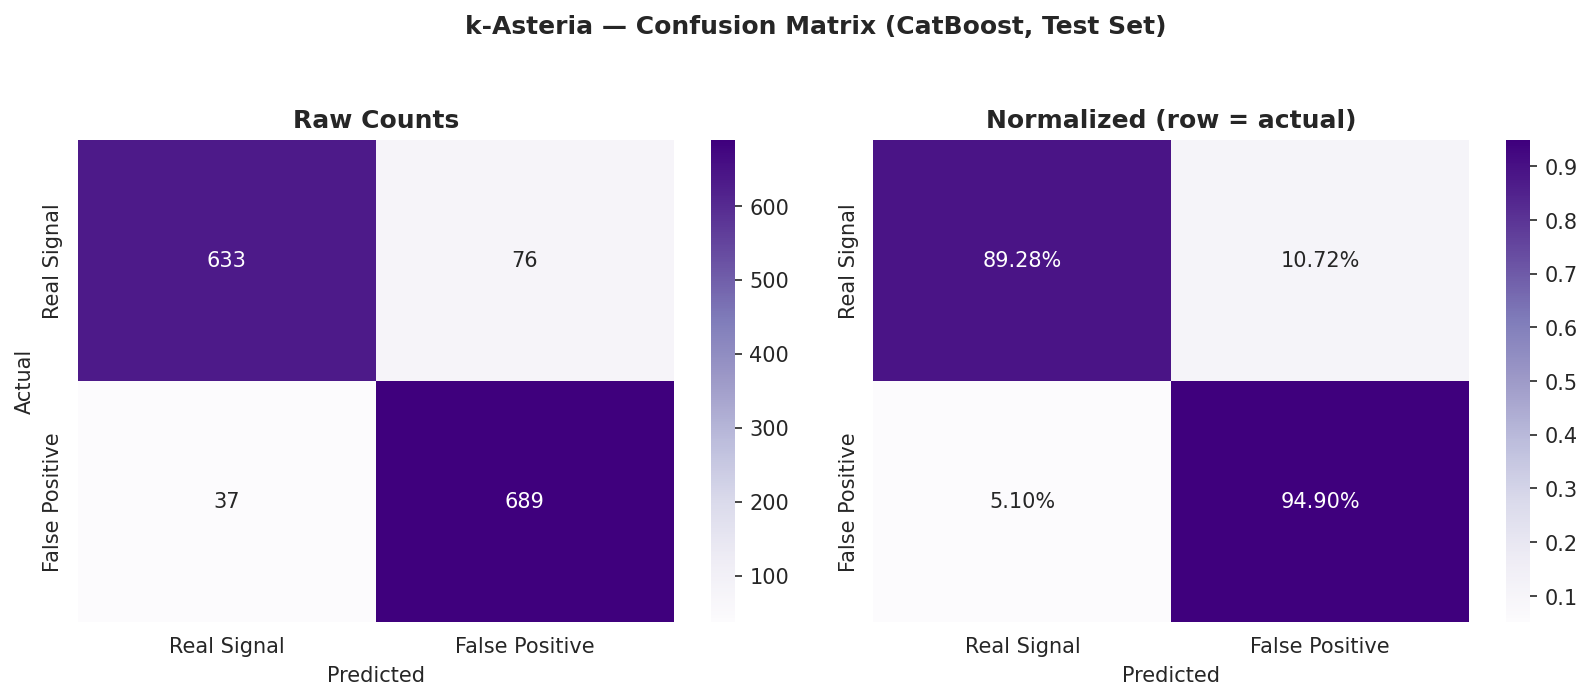
Stage2: Confusion Matrix
-
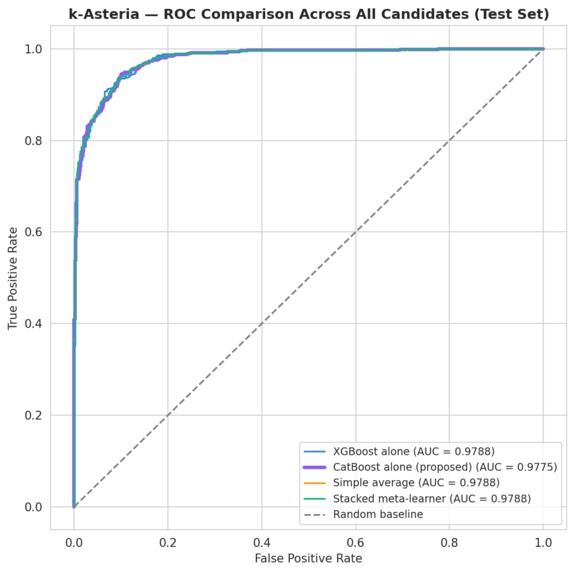
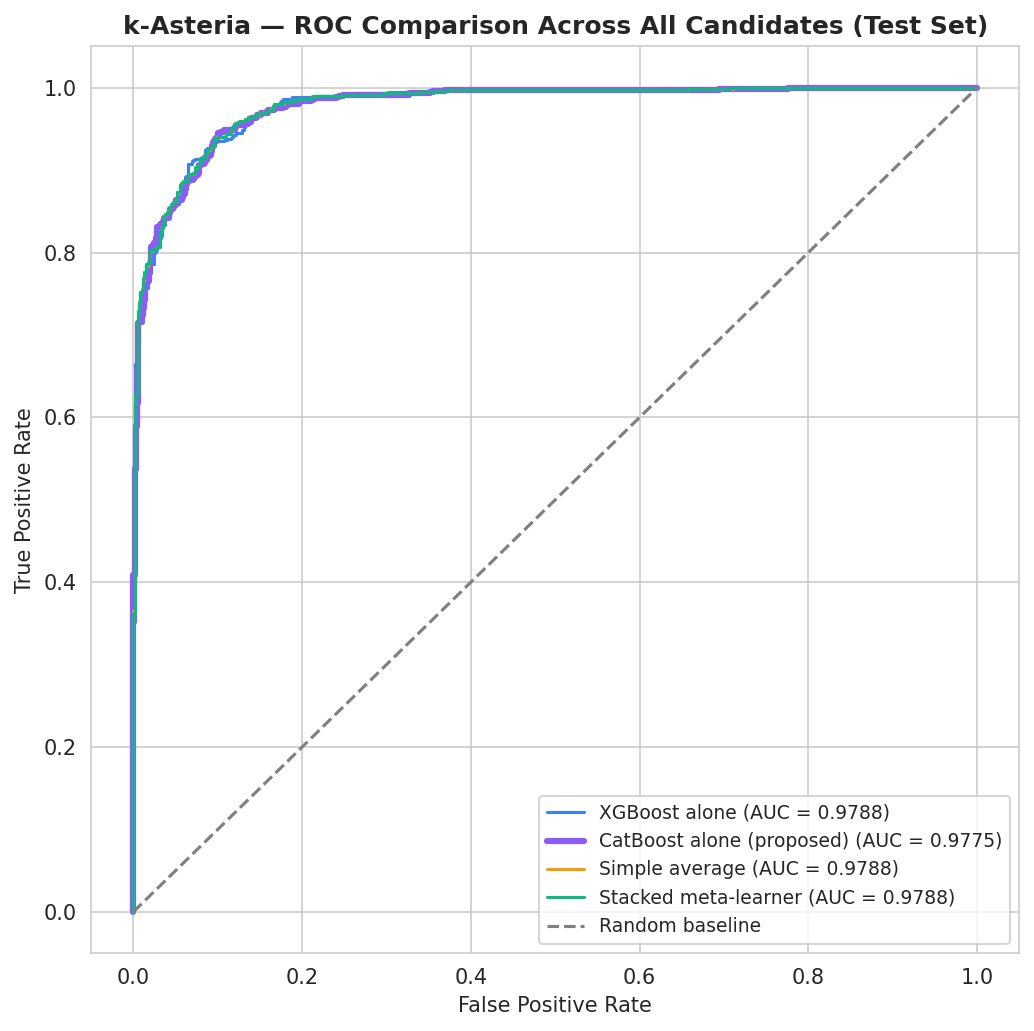
Stage2: ROC Comparison (All Candidates)
-
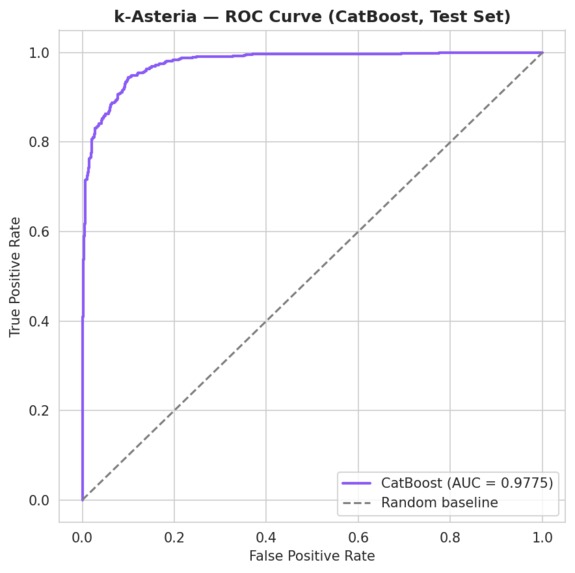
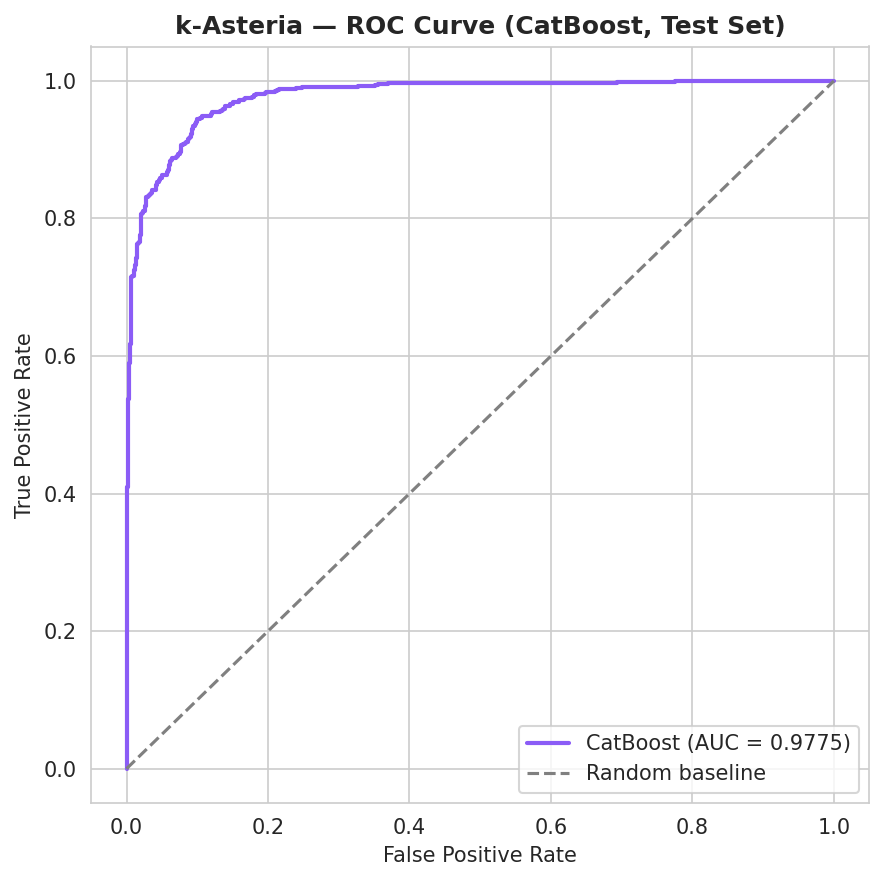
Stage2: ROC Curve CatBoost
kAsteria: Explainable AI for Exoplanet Discovery
What it does
Most AI systems can tell you what they predict—but not why. In scientific research, that lack of transparency makes it difficult to trust AI-generated results.
kAsteria is an Explainable AI platform that classifies NASA Kepler Objects of Interest (KOIs) into Confirmed Exoplanets, Planet Candidates, or False Positives while explaining the reasoning behind every prediction.
Users upload a Kepler-style dataset, and kAsteria automatically validates, preprocesses, and analyzes observations using our trained CatBoost classifier. Instead of returning only a label, the platform generates confidence scores, interpretable feature contributions, observation priority rankings, interactive visualizations, and educational explanations that make complex astronomical machine learning understandable to everyone—from high school students to professional researchers.
How we built it
Our workflow combines a complete machine learning pipeline with an interactive research interface, moving seamlessly from raw data to explainable predictions.
NASA Kepler KOI Dataset
        │
        ▼
Stage 1: Data Cleaning & Feature Engineering
• Missing value handling & normalization
• Domain-specific KOI attribute selection
• Correlation analysis & feature reduction
• Label encoding & train/test splitting
        │
        ▼
Stage 2: Model Training & Evaluation
• CatBoost multi-class classifier
• Hyperparameter optimization
• Ensemble comparison (XGBoost, Random Forest, meta-learner)
• Probability calibration & confidence scoring
        │
        ▼
Prediction Engine & Explainability
        │
        ├── Confidence Scores & Probabilities
        ├── Feature Importance via CatBoost
        ├── Observation Priority Ranking
        ├── SHAP-based Explanations (roadmap)
        ├── Interactive Dashboard & Analytics
        └── Mission-Style Report Generation
Technical Stack:
- Machine Learning: CatBoost, XGBoost, Scikit-learn, Pandas, NumPy
- Explainability: Feature importance analysis, probability estimates
- Frontend: HTML, CSS, JavaScript (NASA-inspired research notebook aesthetic)
- Visualization: Plotly, Matplotlib
- Reporting: ReportLab for mission-style PDF generation
- Deployment: Netlify
- Development: Python, Google Colab for experimentation
Machine Learning Performance
Using the NASA Kepler KOI dataset (9,564 observations, 40+ features), our final CatBoost model achieved exceptional performance across all evaluation metrics:
| Metric | Score |
|---|---|
| Macro F1 Score | 0.9211 |
| ROC-AUC | 0.9775 |
| Matthews Correlation Coefficient | 0.8436 |
| Macro Precision | 0.9227 |
| Macro Recall | 0.9209 |
These results demonstrate balanced performance across all three classes (Real Signal / False Positive / Candidate) with minimal class bias, making the model production-ready for real exoplanet discovery workflows.
Key Features Driving Predictions
Our correlation analysis identified the top astronomical features most predictive of exoplanet signals. The model heavily weights:
- koi_dikco_msky — depth and signal characteristics
- koi_prad — planetary radius measurements
- n_missing_features — data completeness indicator
- koi_dor — orbital properties
- koi_ror — radius ratios
- koi_model_snr — signal-to-noise ratio
This feature hierarchy aligns with domain expertise: real exoplanet signals show distinct patterns in transit depth, planet radius, and measurement quality.
Eliminating Target Leakage: Why We Excluded Label-Dependent Columns
To ensure our classifier learned genuine transit physics rather than decoding the automated vetting pipeline, we conducted an extensive leakage audit. Direct label leakage columns were the most important category we identified and removed:
koi_pdisposition— This is the automated pipeline's own disposition call, computed by the same system that (eventually, with human review) produceskoi_disposition. We verified via crosstab thatkoi_pdispositionmatcheskoi_disposition's CANDIDATE/FALSE POSITIVE split in 9,555 of 9,564 rows (99.9% agreement). Training on this column is not learning to detect false positives — it's learning to copy a value that already almost is the answer.koi_fpflag_nt,koi_fpflag_ss,koi_fpflag_co,koi_fpflag_ec(the four "false positive flags") — These were the single most important leakage finding in this whole project, discovered after we had already shipped a model, when we compared a "with flags" version against the model without them and score jumped from 0.9211 to ~0.99. We went back and ran a crosstab specifically to understand why:koi_fpflag_nt,koi_fpflag_ss,koi_fpflag_co,koi_fpflag_ec(the four "false positive flags") — These were the single most important leakage finding in this whole project, discovered after we had already shipped a model, when we compared a "with flags" version against the model without them and score jumped from 0.9211 to ~0.99. We went back and ran a crosstab specifically to understand why:
| Disposition Class | Total Rows | koi_fpflag_co (flag=0/flag=1) | koi_fpflag_ec (flag=0/flag=1) |
|---|---|---|---|
| CANDIDATE | 1,978 | 1,978 (100%) / 0 (0%) | 1,978 (100%) / 0 (0%) |
| CONFIRMED | 2,747 | 2,747 (100%) / 0 (0%) | 2,747 (100%) / 0 (0%) |
| FALSE POSITIVE | 4,839 | 2,950 / 1,889 | 3,691 / 1,148 |
Every CANDIDATE and CONFIRMED row has all four flags at exactly 0 — by definition of how the vetting pipeline works, a flag can only be raised as part of the process that assigns FALSE POSITIVE. These flags are not independent physical measurements; they are outputs of the same automated system that assigns the label.
Every CANDIDATE and CONFIRMED row has all four flags at exactly 0 — by definition of how the vetting pipeline works, a flag can only be raised as part of the process that assigns FALSE POSITIVE. These flags are not independent physical measurements; they are outputs of the same automated system that assigns the label. A model trained on them isn't detecting false positives from transit physics, it's decoding the vetting pipeline's own internal rule set.
We found independent confirmation of this exact risk in NASA's own ExoMiner paper (Zink et al.) — even their production-grade model treats "flagged by an FP indicator" and "classified as false positive" as essentially the same event in their own validation examples, underscoring that this correlation is a known property of the dataset, not an artifact of our particular training run.
This is documented as a standalone warning in the notebook appendix (see the leakage section) specifically because we discovered other public work on this dataset uses these flags (or the related koi_score column) as top features without flagging the circularity — so we call this out explicitly for anyone else using this dataset.
Confusion Matrix Analysis
On the test set, the model achieved:
- 89.28% recall for Real Signals — correctly identifies genuine exoplanet candidates
- 94.90% recall for False Positives — effectively rejects instrumental noise
- Minimal false positives (5.10%) — avoids wasting valuable follow-up observation time
This balance is critical for astronomical research: missing a real signal is costly, but chasing false positives wastes scarce telescope resources.
What makes kAsteria different
Most astronomy ML projects stop at prediction. kAsteria continues.
We transform model outputs into actionable scientific insights through:
- 🔍 Explainable predictions backed by feature importance analysis and probability calibration
- ⭐ Observation Priority Score that ranks KOIs by likelihood and model confidence
- 📊 Interactive analytics dashboard for exploring the full KOI dataset
- 📄 Automatically generated mission reports that tell the story of each prediction
- 📈 Confidence visualizations using ROC curves and confusion matrices
- 📚 Built-in astronomy learning resources including glossaries and concept explanations
- 🤖 Polly, an educational AI assistant that explains astronomical concepts in plain language
- 🏗️ End-to-end reproducibility with open-source pipeline and transparent model selection
Rather than replacing human reasoning, kAsteria augments it by making every prediction transparent, interpretable, and trustworthy.
Challenges we ran into
Data Quality & Feature Engineering
- Kepler dataset contains 9,564+ observations with 40+ raw features, many with missing or inconsistent values
- Required domain-specific understanding to preserve meaningful astronomical properties while handling missingness
- Solution: Iterative correlation analysis and feature importance evaluation
Model Selection for Scientific Trust
- High accuracy alone isn't enough—scientists need reliable probability estimates
- Compared XGBoost, CatBoost, Random Forest, ensemble averaging, and stacked meta-learners
- CatBoost emerged as best balance of performance (0.9775 AUC) and calibrated probabilities
Class Balance Without Bias
- Real signals and false positives have different distributions across features
- Macro-averaged metrics critical to ensure balanced recall across both classes
- Achieved 0.9209 macro recall without sacrificing per-class precision
Interface Design for Multiple Audiences
- Scientists need detailed metrics and feature explanations
- Students need accessible, narrative-driven explanations
- Solved through dual-mode interface: "technical dashboard" and "learn mode"
Pipeline Reproducibility
- Coordinating Python ML pipeline, visualization layer, report generation, and web frontend
- Solution: Modular architecture with versioned datasets, saved models, and documented hyperparameters
Accomplishments we're proud of
✅ 0.9211 Macro F1 & 0.9775 ROC-AUC on a challenging multi-class exoplanet classification problem
✅ Balanced class performance with 89.28% recall on real signals and 94.90% recall on false positives
✅ Interpretable feature hierarchy aligned with astronomical domain knowledge
✅ End-to-end workflow from CSV upload to explainable prediction and mission report
✅ Research-grade notebook aesthetic that feels like a scientific instrument, not a generic dashboard
✅ Model comparison framework documenting why CatBoost outperforms XGBoost and ensembles
✅ Educational scaffolding making complex ML accessible without sacrificing rigor
✅ Production-ready pipeline with data validation, model versioning, and reproducible training
What we learned
Model performance and model trust are not the same thing. A classifier can achieve 97% AUC and still be useless if scientists can't understand its reasoning. Explainability matters as much as accuracy in scientific decision support.
Balanced metrics reveal hidden class biases. Macro-averaged F1 (0.9211) told us things accuracy alone would have missed—ensuring we don't over-optimize for one class at the expense of another.
Feature importance is domain documentation. By analyzing which features drive predictions, we validated that the model learns real astronomy, not spurious patterns. The top features (transit depth, planet radius, signal-to-noise) match 50+ years of exoplanet science.
Interface design is part of the model. A brilliant classifier hidden behind confusing UI is worthless. We learned to design for different ways of thinking: exploratory mode for researchers, narrative mode for learners.
Scientific reproducibility requires discipline. Sharing a trained model means also sharing: the exact training data, preprocessing steps, feature engineering decisions, hyperparameters, train/test split methodology, and evaluation protocols.
What's next for kAsteria
Our roadmap includes:
- SHAP local explanations — explain individual predictions at the feature level
- Real-time inference API — enable programmatic access for astronomy research teams
- Model evolution dashboard — track performance across dataset updates and retraining cycles
- Multi-mission support — extend beyond Kepler to TESS and future exoplanet surveys
- Collaborative analysis — enable research teams to share predictions, annotations, and insights
- Advanced visualization — interactive 3D orbital parameter space, signal phase folding
- Observation planning integration — connect predictions to telescope scheduling systems
Our long-term vision is for kAsteria to become the standard interpretable ML platform for exoplanet science—where machine learning enhances human expertise rather than replacing it.
Evidence & Artifacts
We've attached visualizations of our complete ML pipeline:
📊 stage1_correlation_heatmap.png — Top 25 features and their inter-relationships
📊 stage1_feature_distributions.png — Class separability across key astronomical features
📊 stage2_confusion_matrix.png — Per-class recall and precision on test set
📊 stage2_feature_importance.png — Top 20 predictive features ranked by CatBoost
📊 stage2_model_comparison_chart.png — XGBoost vs CatBoost vs ensemble methods
📊 stage2_roc_comparison_all_candidates.png — ROC curves for all model variants (AUC 0.9775)
📊 stage2_roc_curve_catboost.png — Final CatBoost ROC curve with baseline comparison
Team
Nightmare-De9 — Vishwajith S
Frontend • UI/UX
HypeXBreaker — Aditya Mohapatra
Backend • Development
Links
🚀 Live Demo: https://kasteria.netlify.app
📌 GitHub Repository: https://github.com/Nightmare-De9/kAsteria
kAsteria: Everything begins with a singal.


Log in or sign up for Devpost to join the conversation.