-
KASE analysis demonstration
kase
Kinome Array Significance Evaluator
A tool to analyze Kinome Array data for scientific publication. Examples:
V1.0
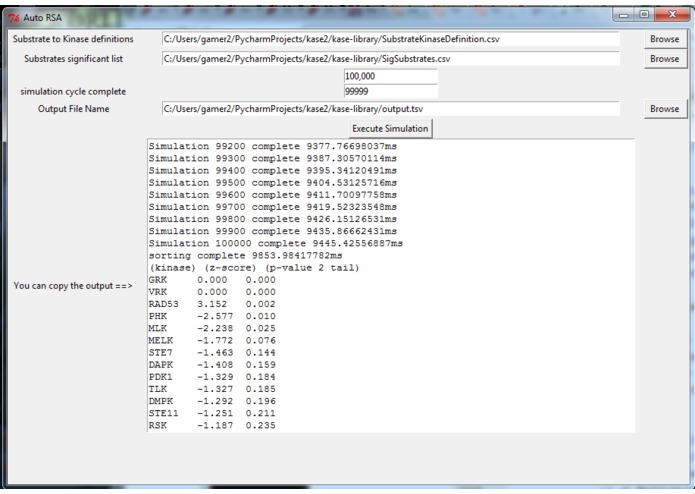
Re-coded application from EXCEL macro, reducing computation from hours to seconds Runs 100,000 iterations of a simulation in ~10s
For Python 2.7 We recommend running using Anaconda for easy package install https://www.continuum.io/downloads
PLANNED FUTURE FEATURES:
Figure generation
Configurable random seed
Purpose
Kinome Arrays often give confusing results because each detector corresponds to multiple kinases. Therefore, using simulation, this program approximates a parametric analysis of the distribution of number of hits for each kinase given that x substrates are chosen, where x equals the actual number of substrates chosen. Using this approximated distribution, a z-score and subsequent p-value (two-tailed) is calculated for each kinase.
An inexact approximation: Standard normal distribution is used as simplifying assumption; although we expect a skewed distribution due ot proximity to zero. While a large n=100,000 (random) simulations can be accomodated, this is a tiny fraction of all the true combinations. 141 C 10 ~= 617 trillion Nonetheless, this is sufficent to rank and compare effect size.
Instructions
Run kase_gui.py for interactive analysis Note that three files are included as example input/output (in order to load in program) SubstrateKinaseDefinition.csv SigSubstrates.csv output.tsv
Authors
2016 Oct 9 UC Revolution Hackathon Jeremy Cox (JeremyCoxBMI@github.com) and Erica DePasquale (careyea@github.com) author of original tool
Built With
- anaconda
- python
- python2.7


Log in or sign up for Devpost to join the conversation.