Inspiration
I wanted to test if prediction markets actually reflect rational beliefs or if they encode systematic bias. LLM capabilities seemed perfect: lots of hype, lots of uncertainty, and Kalshi had the data.
What it does
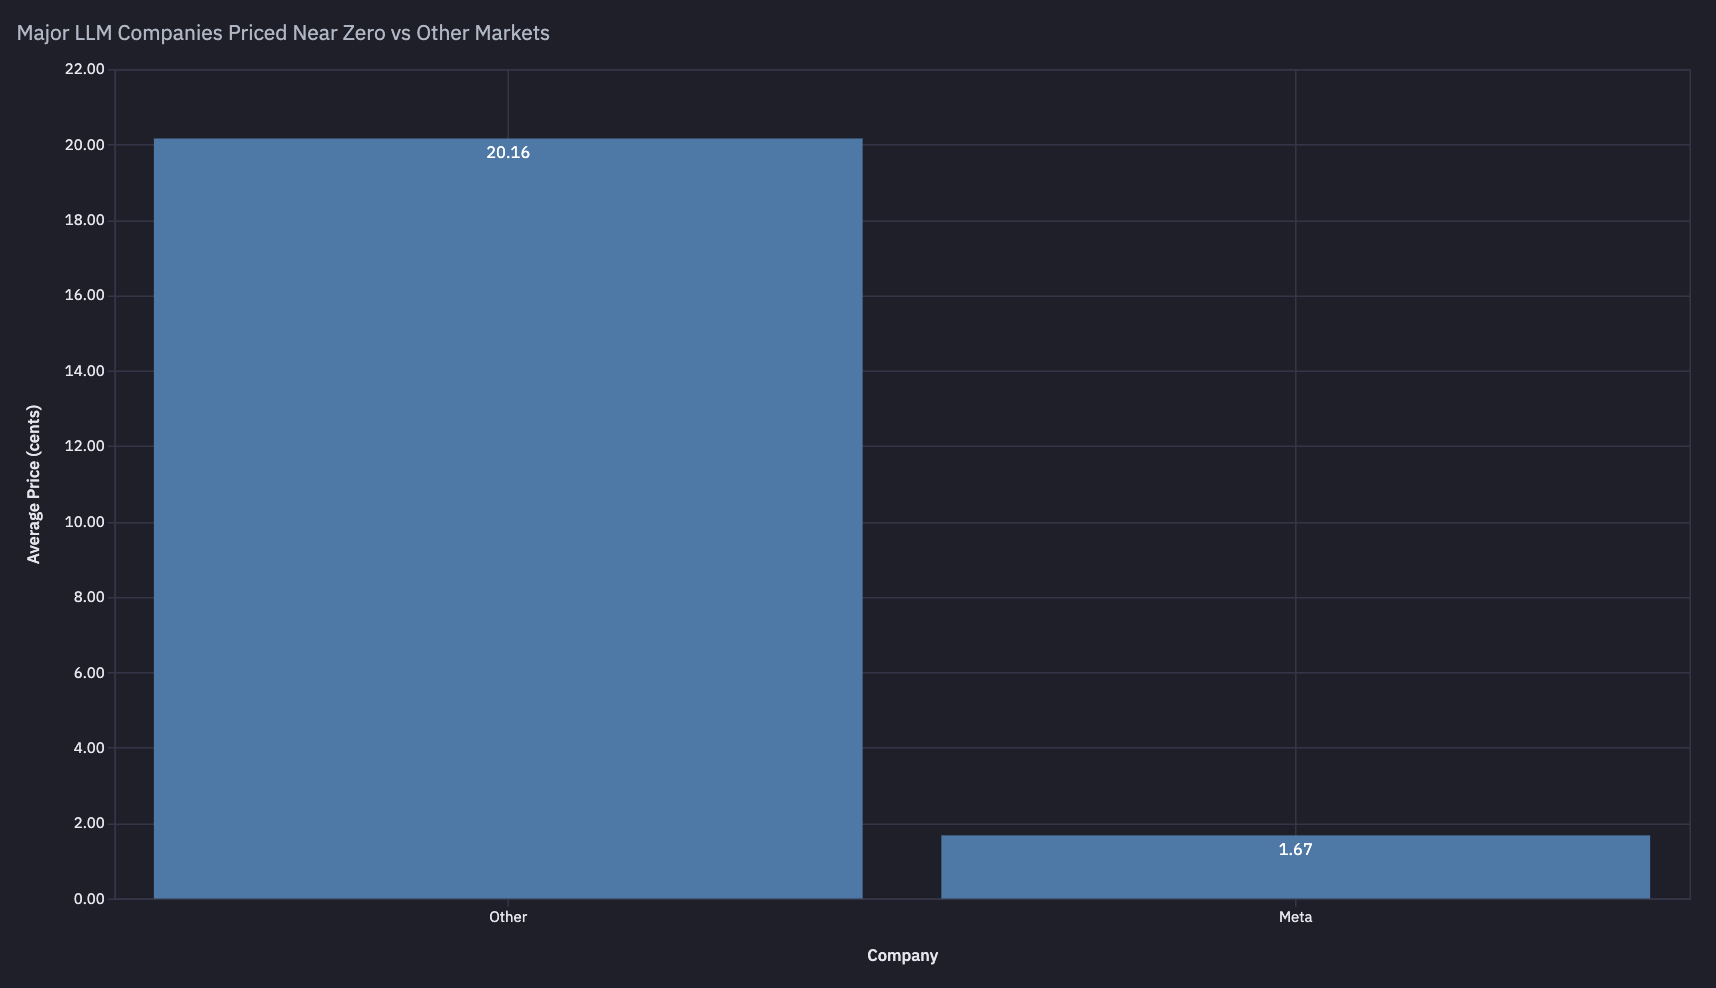
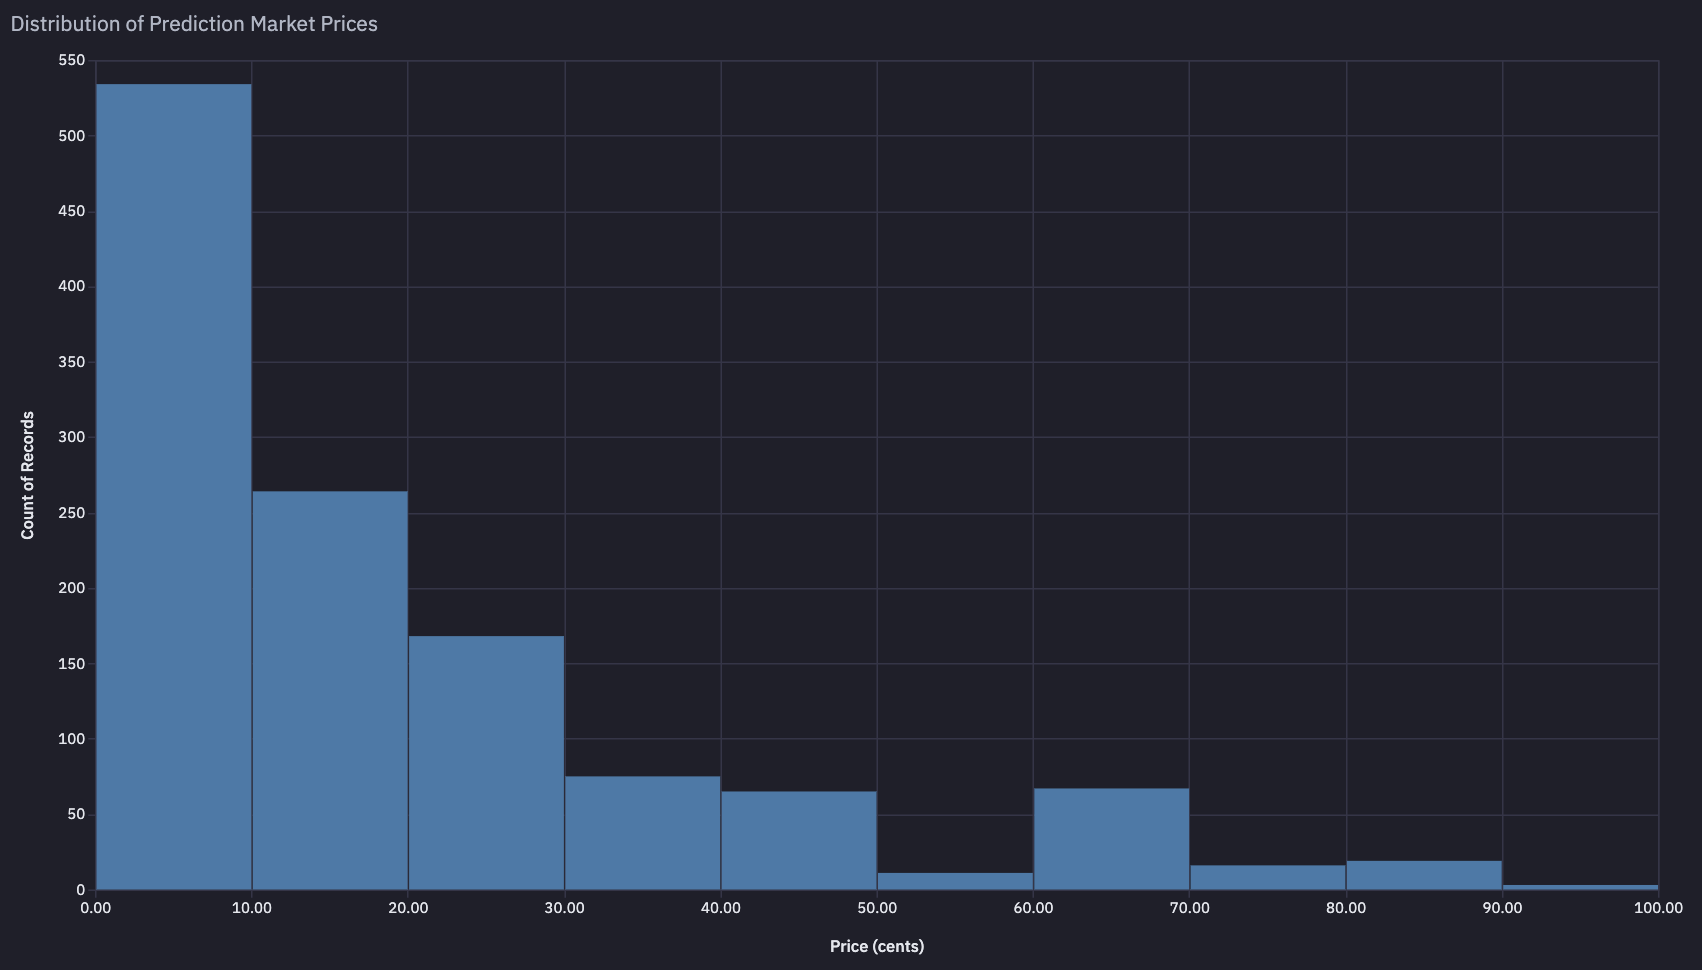
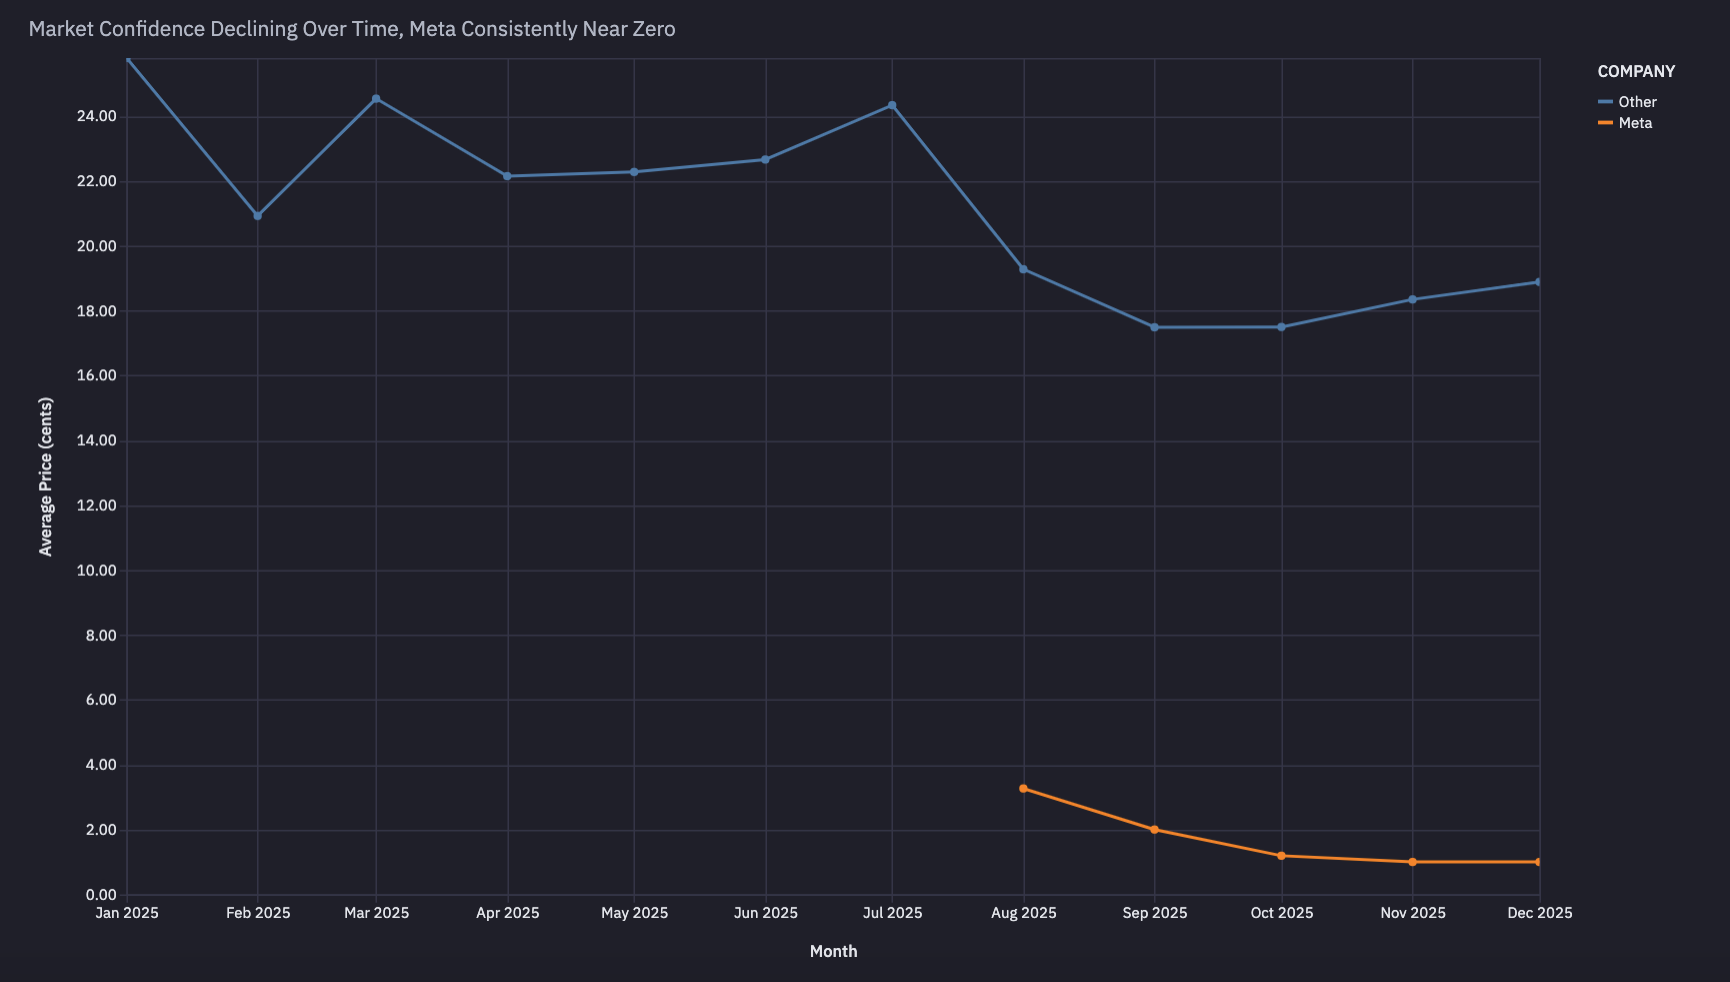
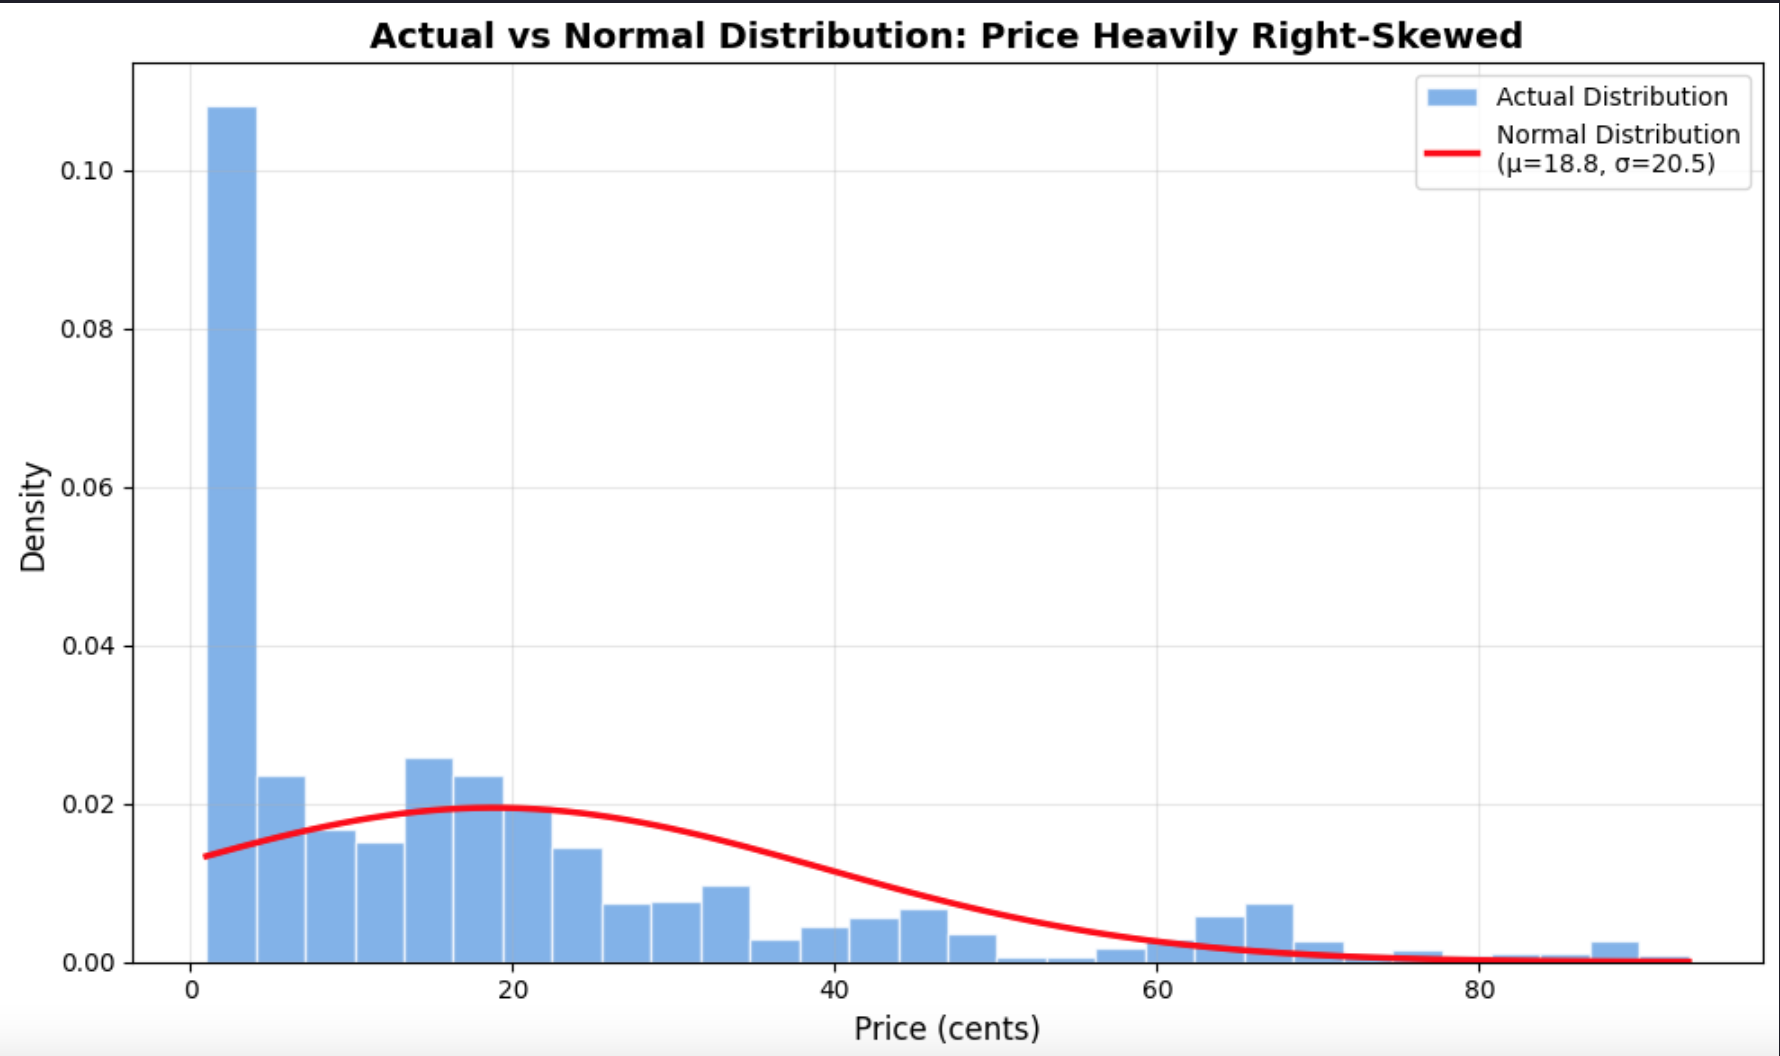
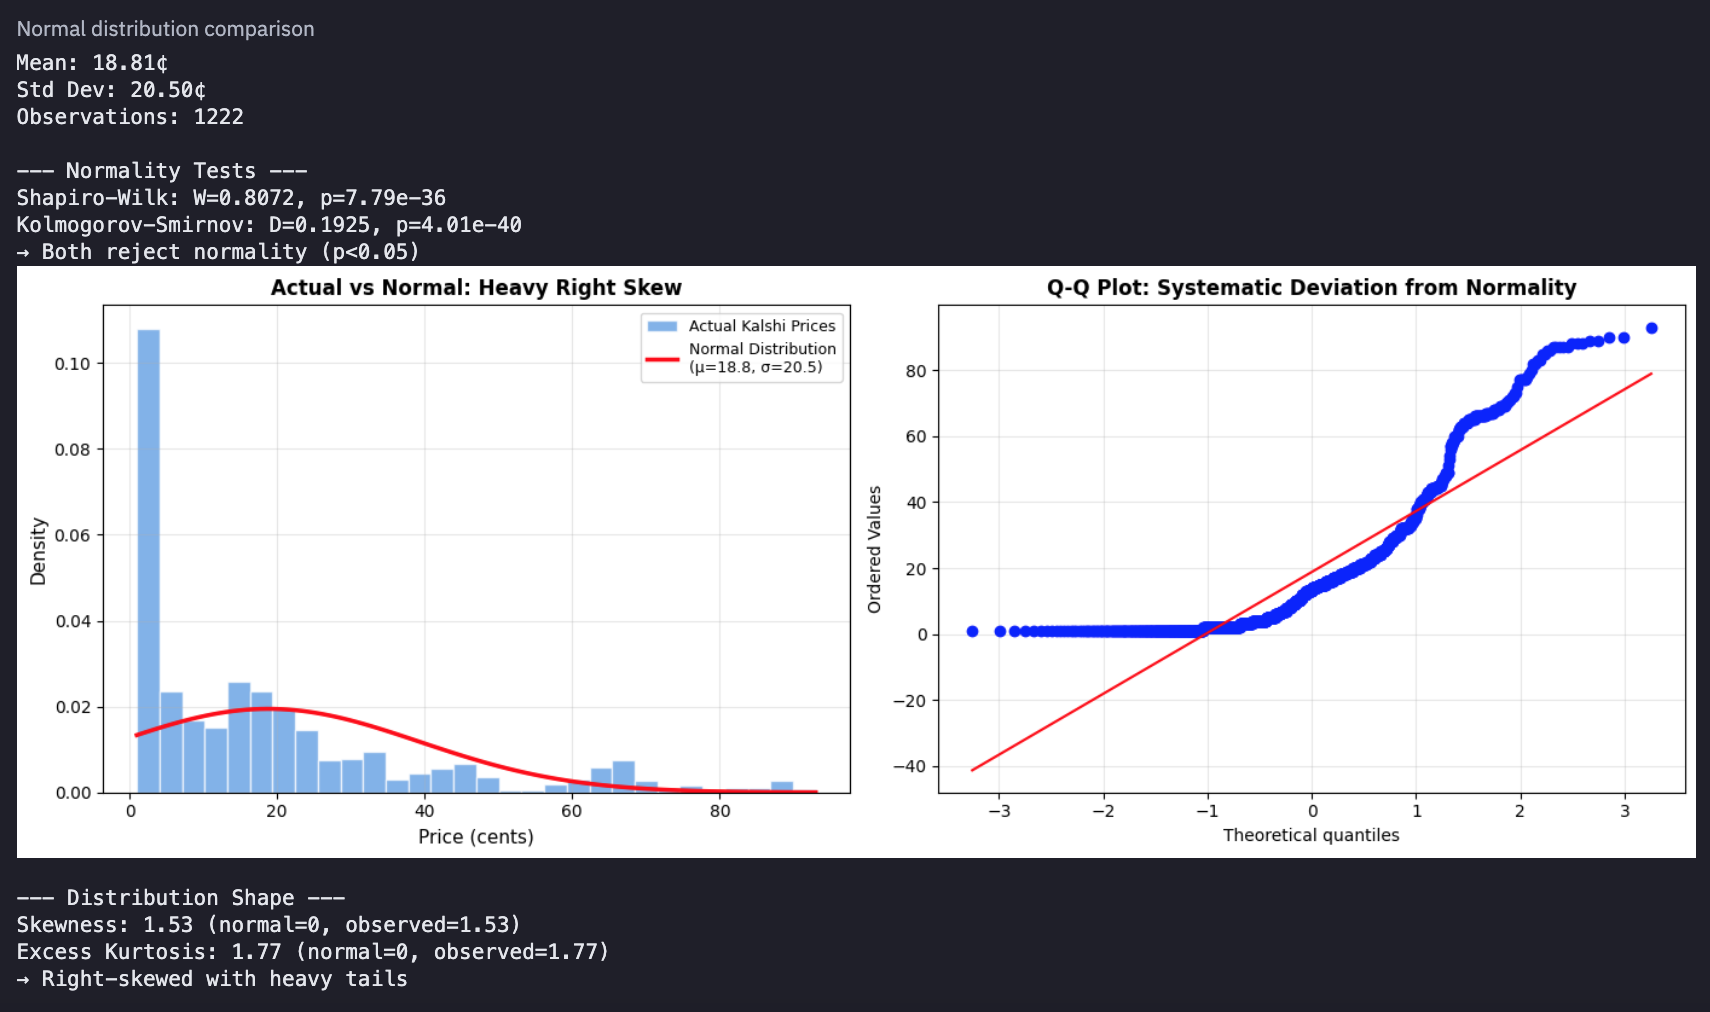
Quantifies how far Kalshi LLM market prices deviate from a normal distribution using formal statistical tests. I found violent rejection of normality (p<0.001, skew=1.53) and identified Meta as a 12x outlier (1.67¢ vs 20.16¢), revealing systematic trader pessimism that compounds over time.
How I built it
Pulled Kalshi's TOP_LLM_PREDICTIONS table, ran distributional analysis in Python (Shapiro-Wilk, K-S tests, Q-Q plots), segmented by company, tracked temporal trends. Used Hex for the full pipeline, SQL for extraction, Python for statistics, explore cells for visualization.
Challenges I ran into
The data was messier than expected, so i needed to filter out null prices and handle market segmentation carefully. Also had to decide between parametric vs non-parametric tests given the obvious non-normality. Q-Q plot made the deviation undeniable.
Accomplishments that I'm proud of
The dual-plot comparison (histogram + Q-Q) makes the deviation from normality immediately visual and statistically rigorous. Finding the Meta outlier wasn't planned, it emerged from the segmentation analysis, which felt like real discovery.
What I learned
Prediction markets don't converge to efficient distributions, even with active trading. Trader psychology (especially Meta skepticism) creates persistent structural anomalies that show up in the shape of the distribution, not just the mean.
What's next for Kalshi LLM Markets vs Normal Distribution (Bell Curve)
Compare to other Kalshi categories to see if LLM markets are uniquely irrational. Build a "deviation index" to track how far any market strays from normality. Test if Meta's discount predicts actual capability gaps vs other companies.
Built With
- hex
- kalshi
- python


Log in or sign up for Devpost to join the conversation.