Inspiration
As a Kubernetes operator, I was tired of juggling multiple terminal windows running kubectl commands just to debug a single issue. But the real pain point was network debugging - kubectl can show you pod logs and events, but it can't show you actual network traffic between pods. When a microservice fails to communicate, you're left guessing. I wanted to build a tool that brings everything together in one interface, with eBPF giving us visibility into what's actually happening at the network layer. The eBPF Summit Hackathon was the perfect opportunity to explore Cilium Hubble's capabilities.
What it does
k8s-debug-tui is an interactive terminal interface for Kubernetes debugging that combines traditional monitoring (logs, events, metrics) with eBPF-powered network observability.
Key features:
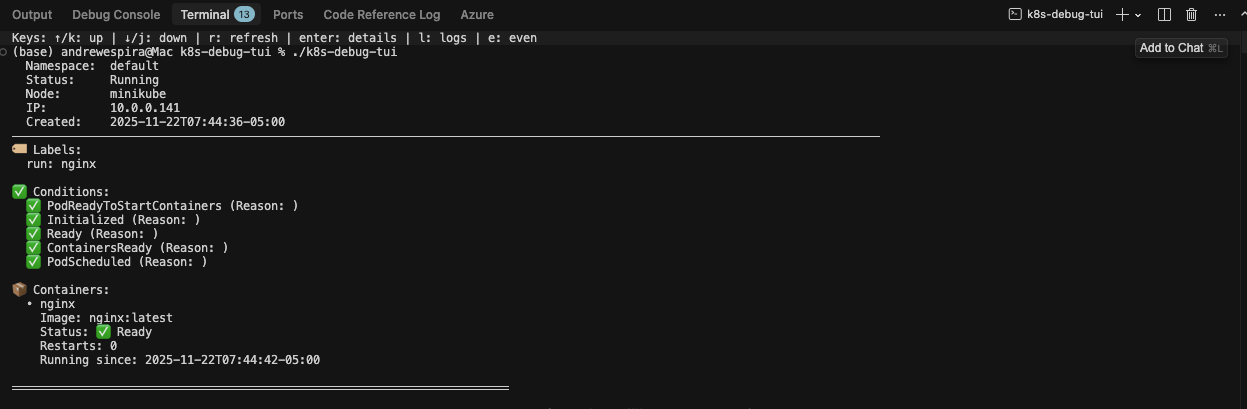
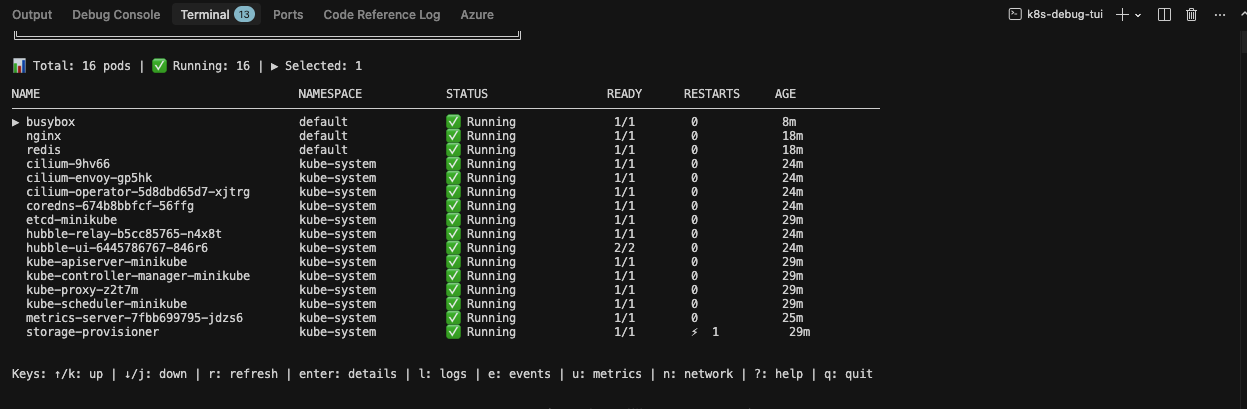
- Real-time pod monitoring across all namespaces with color-coded health status
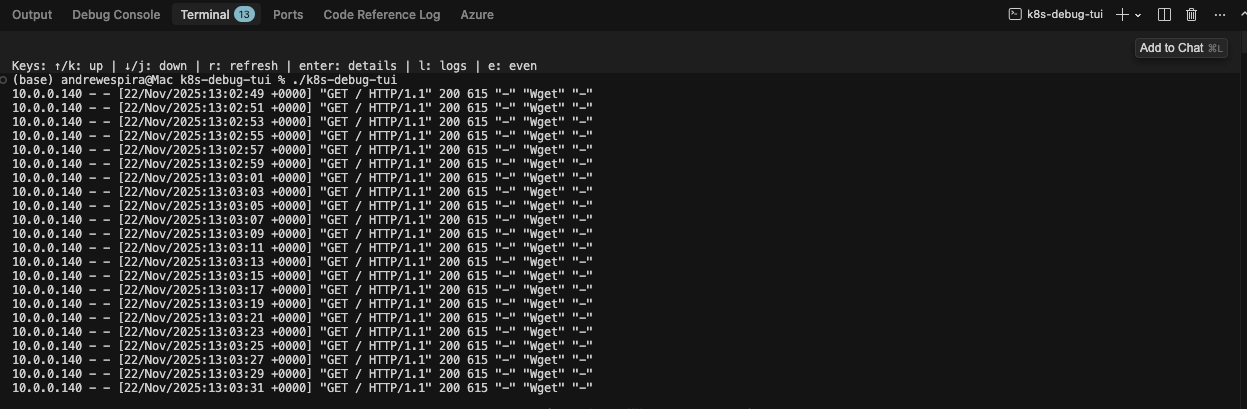
- Live log streaming with multi-container support
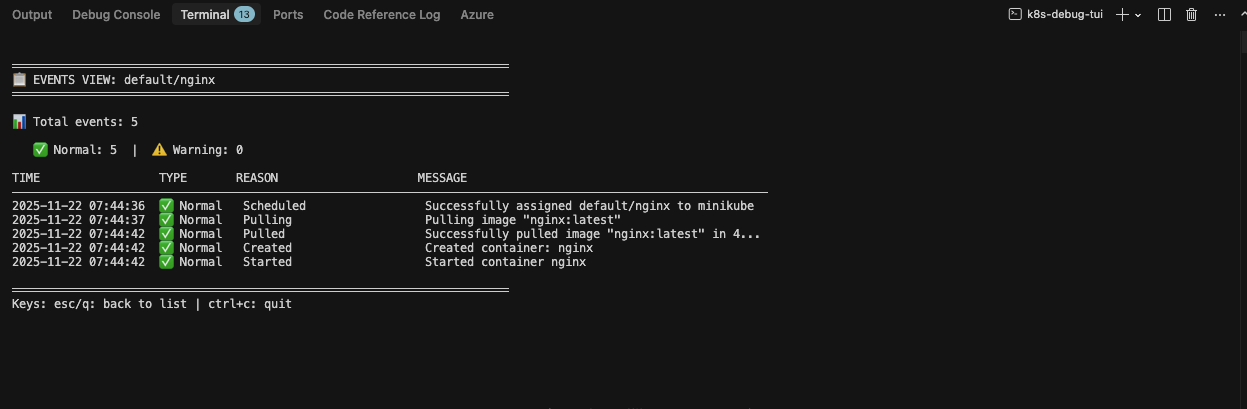
- Kubernetes event tracking for lifecycle debugging
- CPU/Memory metrics with visual progress bars
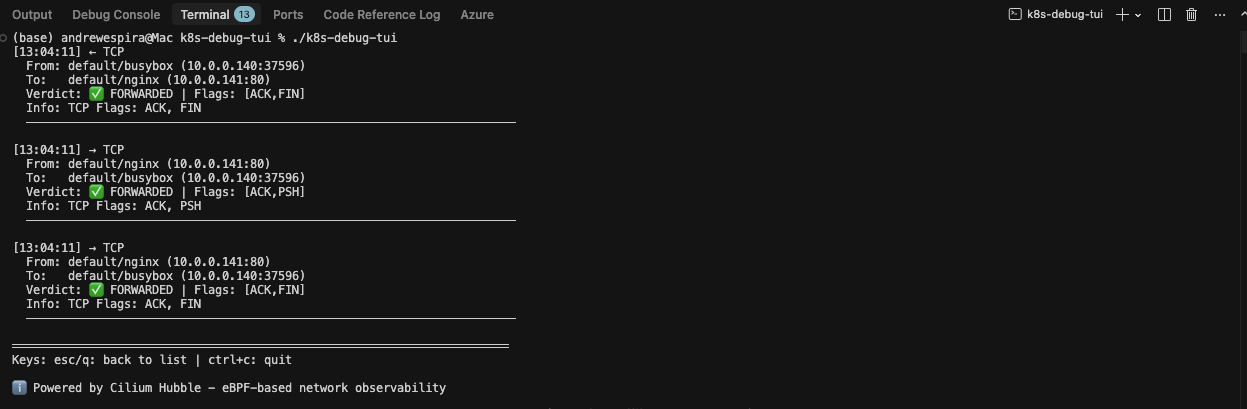
- eBPF network flow visibility via Cilium Hubble showing: • Actual packet flows between pods (source/dest IPs and ports) • L7 HTTP inspection (method, URL, status codes) • TCP connection state tracking (SYN, ACK, FIN flags) • Network policy debugging (DROPPED flows highlighted in red) • Traffic direction analysis (inbound vs outbound) • Real-time flow statistics
Everything in a single, keyboard-driven interface - no more switching between multiple kubectl commands and tools.
How we built it
The project is built in Go using several key technologies:
Bubbletea TUI Framework - Provides the interactive terminal interface with real-time updates and keyboard navigation
Kubernetes client-go - Connects to the K8s API for pod metadata, logs, events, and metrics
Cilium Hubble gRPC API - The core eBPF integration. Hubble runs eBPF programs in the kernel to capture network flows, which we consume via gRPC streaming
Color-coded ANSI output - For visual debugging with status indicators, directional arrows, and alert highlighting
The architecture streams data from multiple sources (K8s API, Hubble flows, metrics-server) and presents it in a unified view. The network flows feature required understanding Hubble's flow protobuf format and extracting L3/L4/L7 data including TCP flags and HTTP details from the eBPF-captured packets.
Development was iterative: started with basic pod listing, added log streaming, then integrated Hubble for the eBPF network flows (the main hackathon feature), and finally added events, metrics, and UX polish.
Challenges we ran into
Hubble gRPC Integration - Understanding the Observer API and flow protobuf format was initially complex. Had to learn how Hubble structures network flow data and extract meaningful information from L7 protocols.
Real-time Updates - Coordinating multiple async data sources (pod updates, log streams, flow streams) in a TUI without blocking or race conditions required careful message passing design with Bubbletea's command pattern.
Network Flow Filtering - Hubble captures all cluster traffic. Implementing efficient per-pod filtering to show only relevant flows while maintaining performance was tricky.
Graceful Degradation - Making the tool useful even when Hubble isn't available required proper error handling and fallback behavior.
Terminal Rendering - Getting color coding, flow statistics, and detailed network information to display cleanly in an 80-column terminal while remaining readable was an iterative UX challenge.
L7 Protocol Extraction - Parsing HTTP details (methods, URLs, status codes) from Hubble's L7 data structures and handling cases where L7 data isn't available.
Accomplishments that we're proud of
Deep eBPF Integration - Successfully integrated Cilium Hubble to provide kernel-level network observability in an interactive TUI. This gives visibility that's impossible with standard Kubernetes tools.
L7 HTTP Inspection - Extracting and displaying HTTP methods, URLs, and status codes from eBPF flow data, making application-level debugging possible from network flows.
Network Policy Debugging - The red-highlighted DROPPED flows make it immediately obvious when network policies are blocking traffic - a common pain point in K8s debugging.
Production-Ready UX - Color coding, flow statistics, real-time updates, comprehensive help screen, and smooth keyboard navigation make it feel like a professional tool, not a hackathon prototype.
Unified Debugging Workflow - Successfully brought together logs, events, metrics, and network flows in one interface, eliminating the need to juggle multiple kubectl commands.
Complete Implementation - Built a fully functional tool with all planned features working smoothly, including demo scripts for easy testing.
What we learned
eBPF's Power - Gained deep appreciation for how eBPF enables kernel-level observability without application changes. Seeing actual packet flows with TCP flags and L7 data is incredibly powerful for debugging.
Cilium/Hubble Architecture - Learned how Cilium's eBPF programs capture network events and how Hubble aggregates and exposes them via gRPC. Understanding the flow of data from kernel → eBPF → Hubble → our application was enlightening.
Protocol Inspection - Learned about L7 protocol detection in eBPF and how Hubble can extract application-layer details (HTTP, DNS, etc.) from raw packets.
Network Policy Impact - Working with FORWARDED vs DROPPED flows gave me better understanding of how Kubernetes network policies work at the packet level.
TUI Design Patterns - Learned Bubbletea's Elm-inspired architecture and how to handle async operations, streaming data, and state management in terminal UIs.
Real-world Debugging Needs - Testing the tool revealed what information is actually useful during debugging: not just "what happened" but "where did traffic go" and "why was it blocked."
What's next for k8s-debug-tui
Short-term enhancements:
- DNS query tracking - Show DNS lookups and failures using eBPF
- Flow filtering and search - Filter by protocol, namespace, or IP
- Export capabilities - Save flows and logs to JSON for later analysis
- Multi-cluster support - Switch between contexts within the TUI
- Pod exec integration - Drop into a shell without leaving the interface
Long-term vision:
- Custom dashboards - User-configurable views for different debugging workflows
- Historical flow analysis - Store and query past network flows
- Anomaly detection - Highlight unusual network patterns using eBPF metrics
- Service mesh integration - Support Istio/Linkerd alongside Cilium
- Collaborative debugging - Share debugging sessions with team members
- Plugin system - Allow community extensions for custom data sources
The goal is to make k8s-debug-tui the go-to tool for Kubernetes debugging, combining the power of eBPF observability with an intuitive, efficient interface that works the way operators actually debug problems.
Built With
- bubbletea
- cilium
- client-go
- ebpf
- go
- grpc
- hubble
- kubernetes
- metrics

Log in or sign up for Devpost to join the conversation.