Inspiration
Wildfire data shows where risk exists, but not always what communities can do about it.
What it does
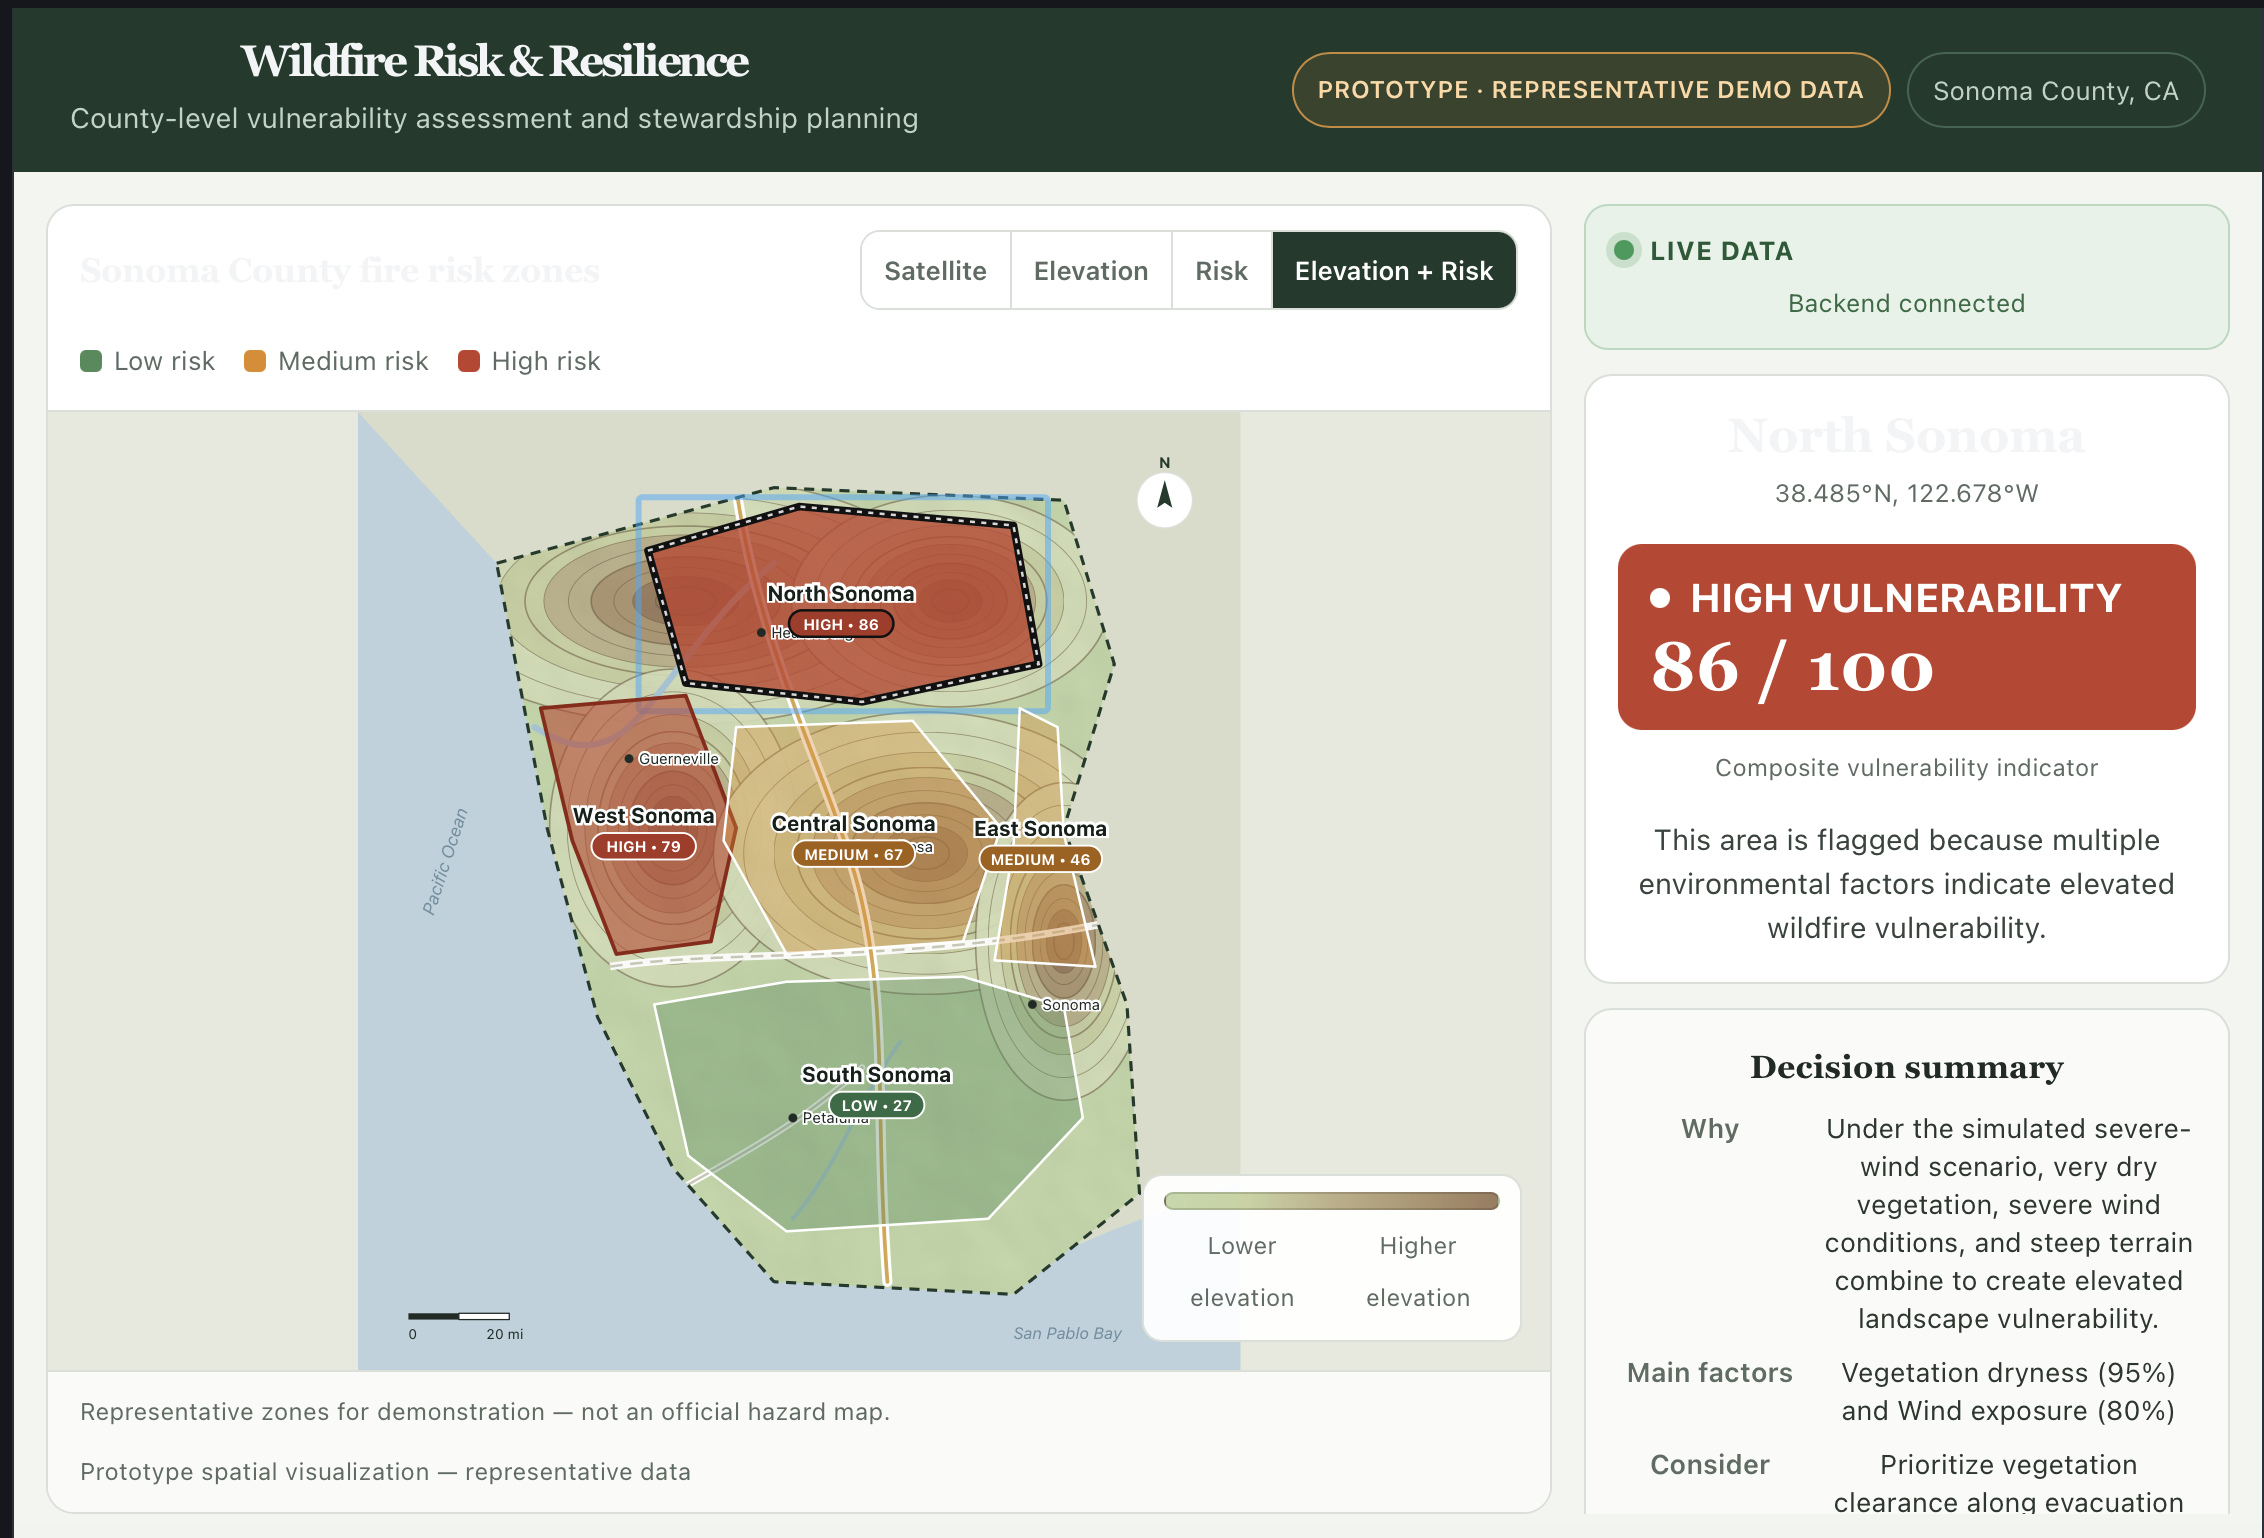
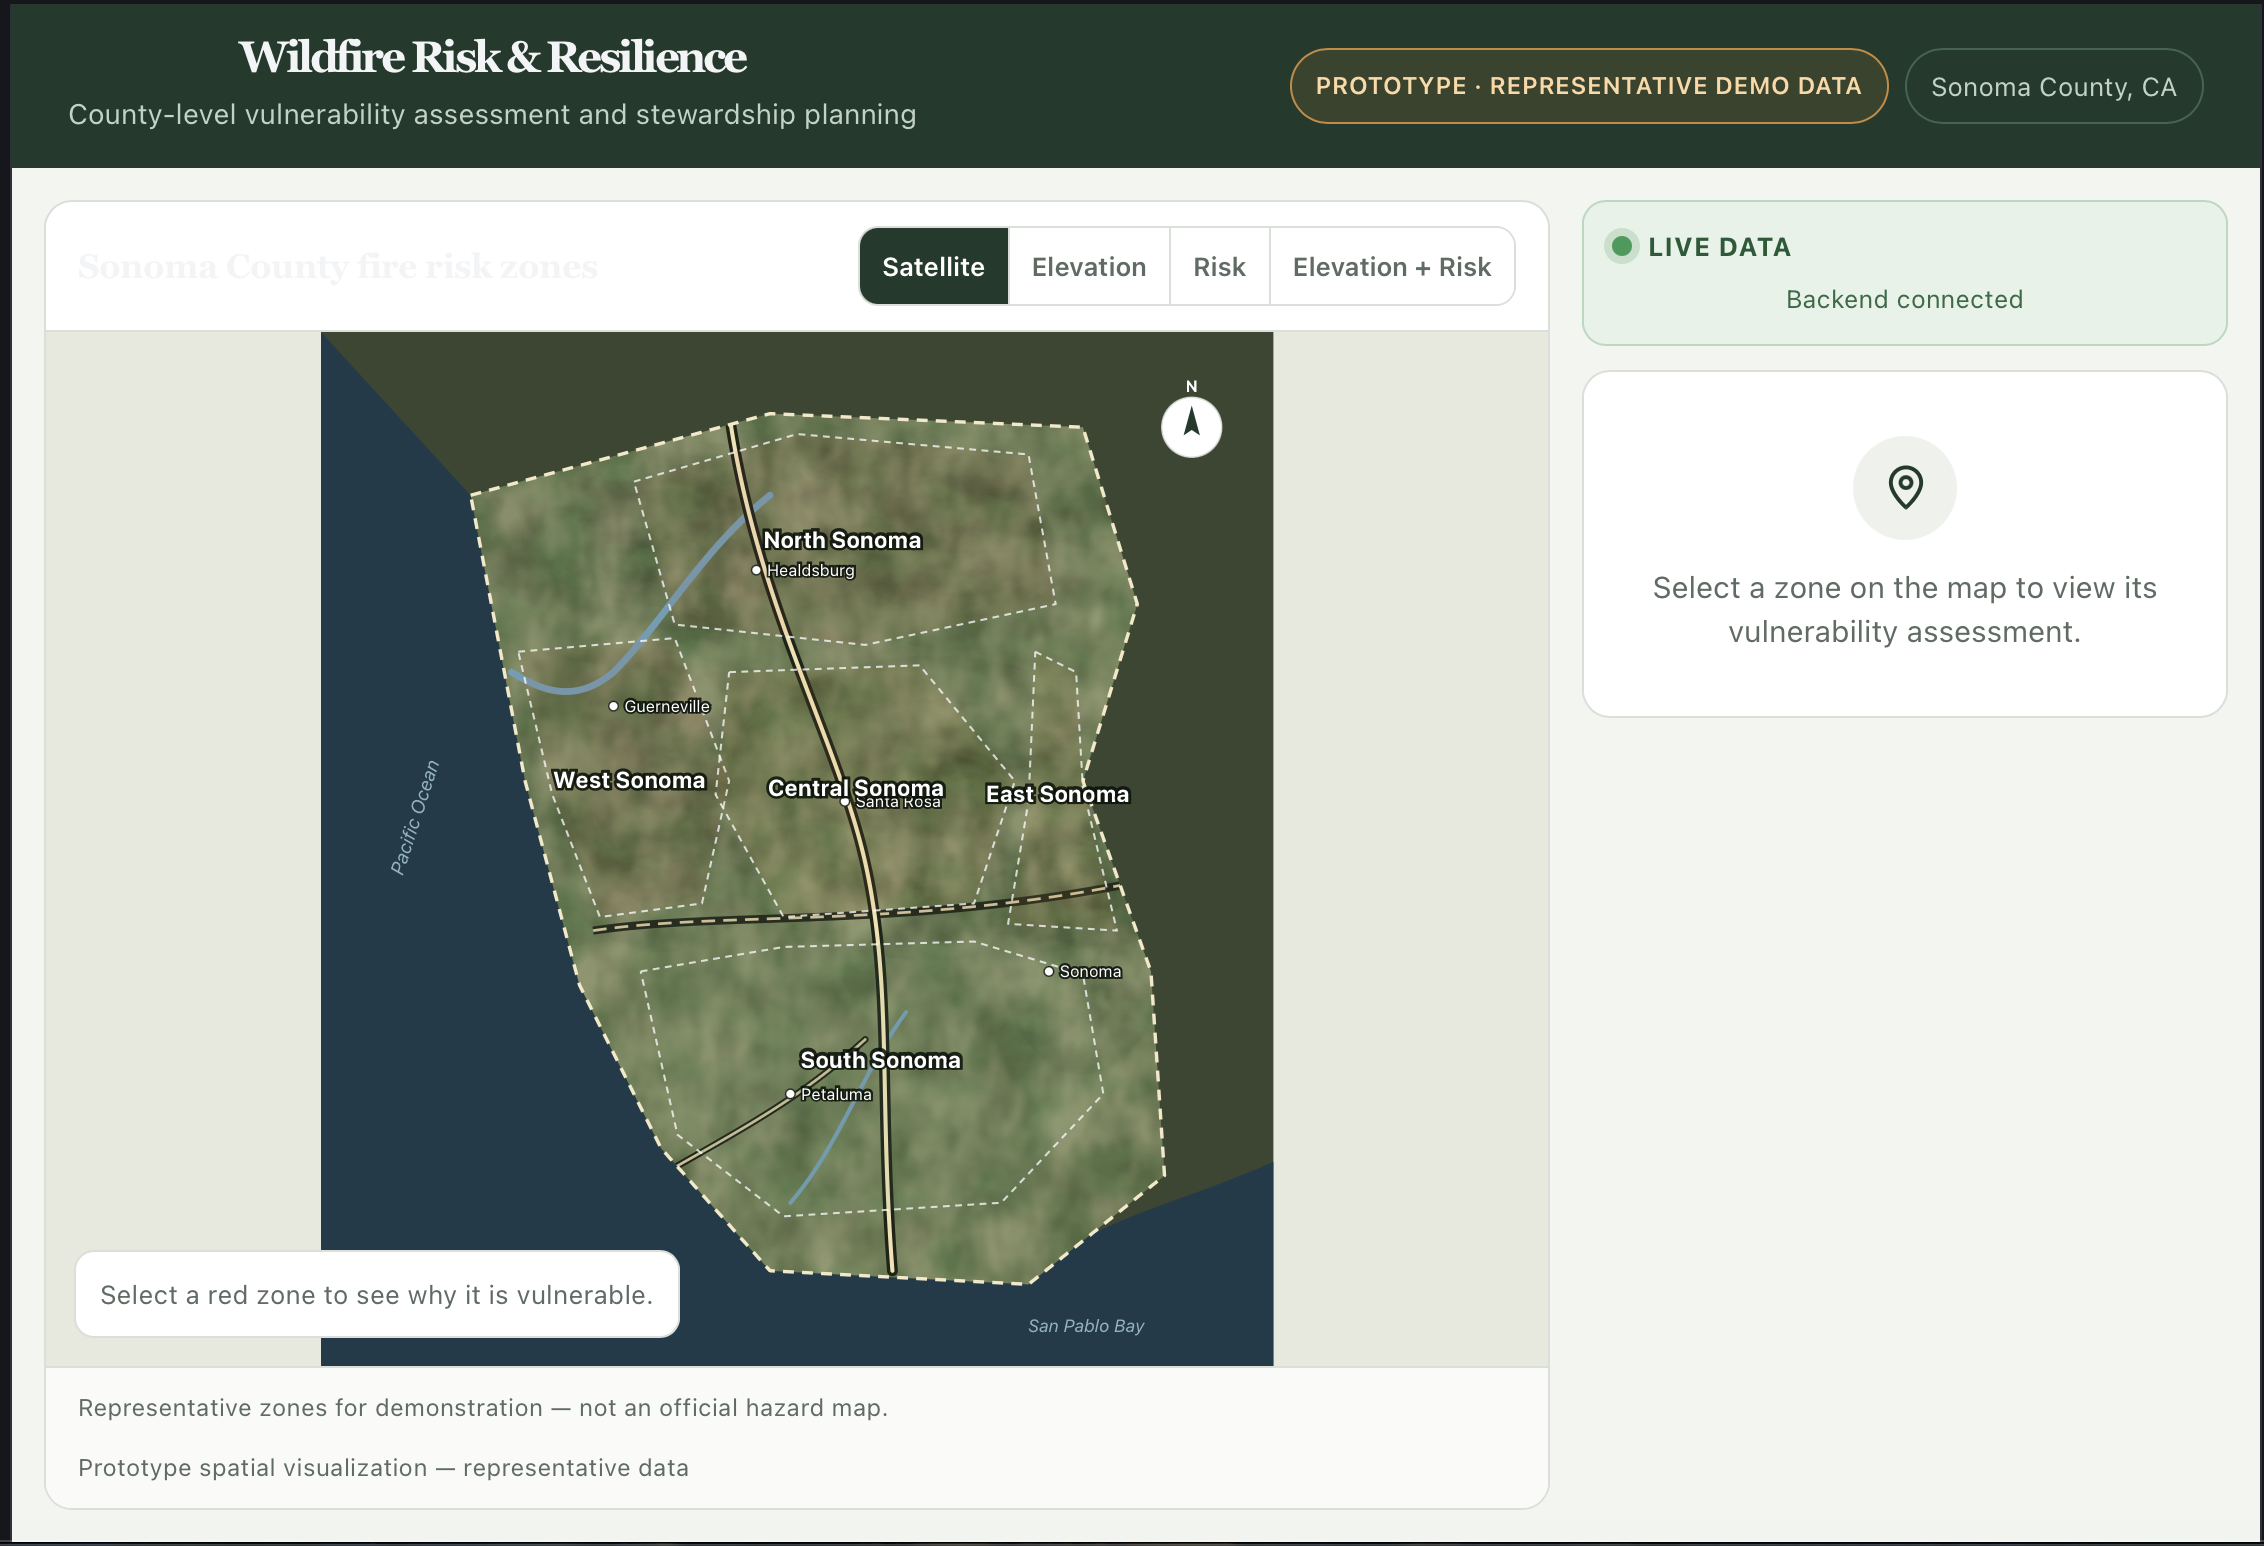
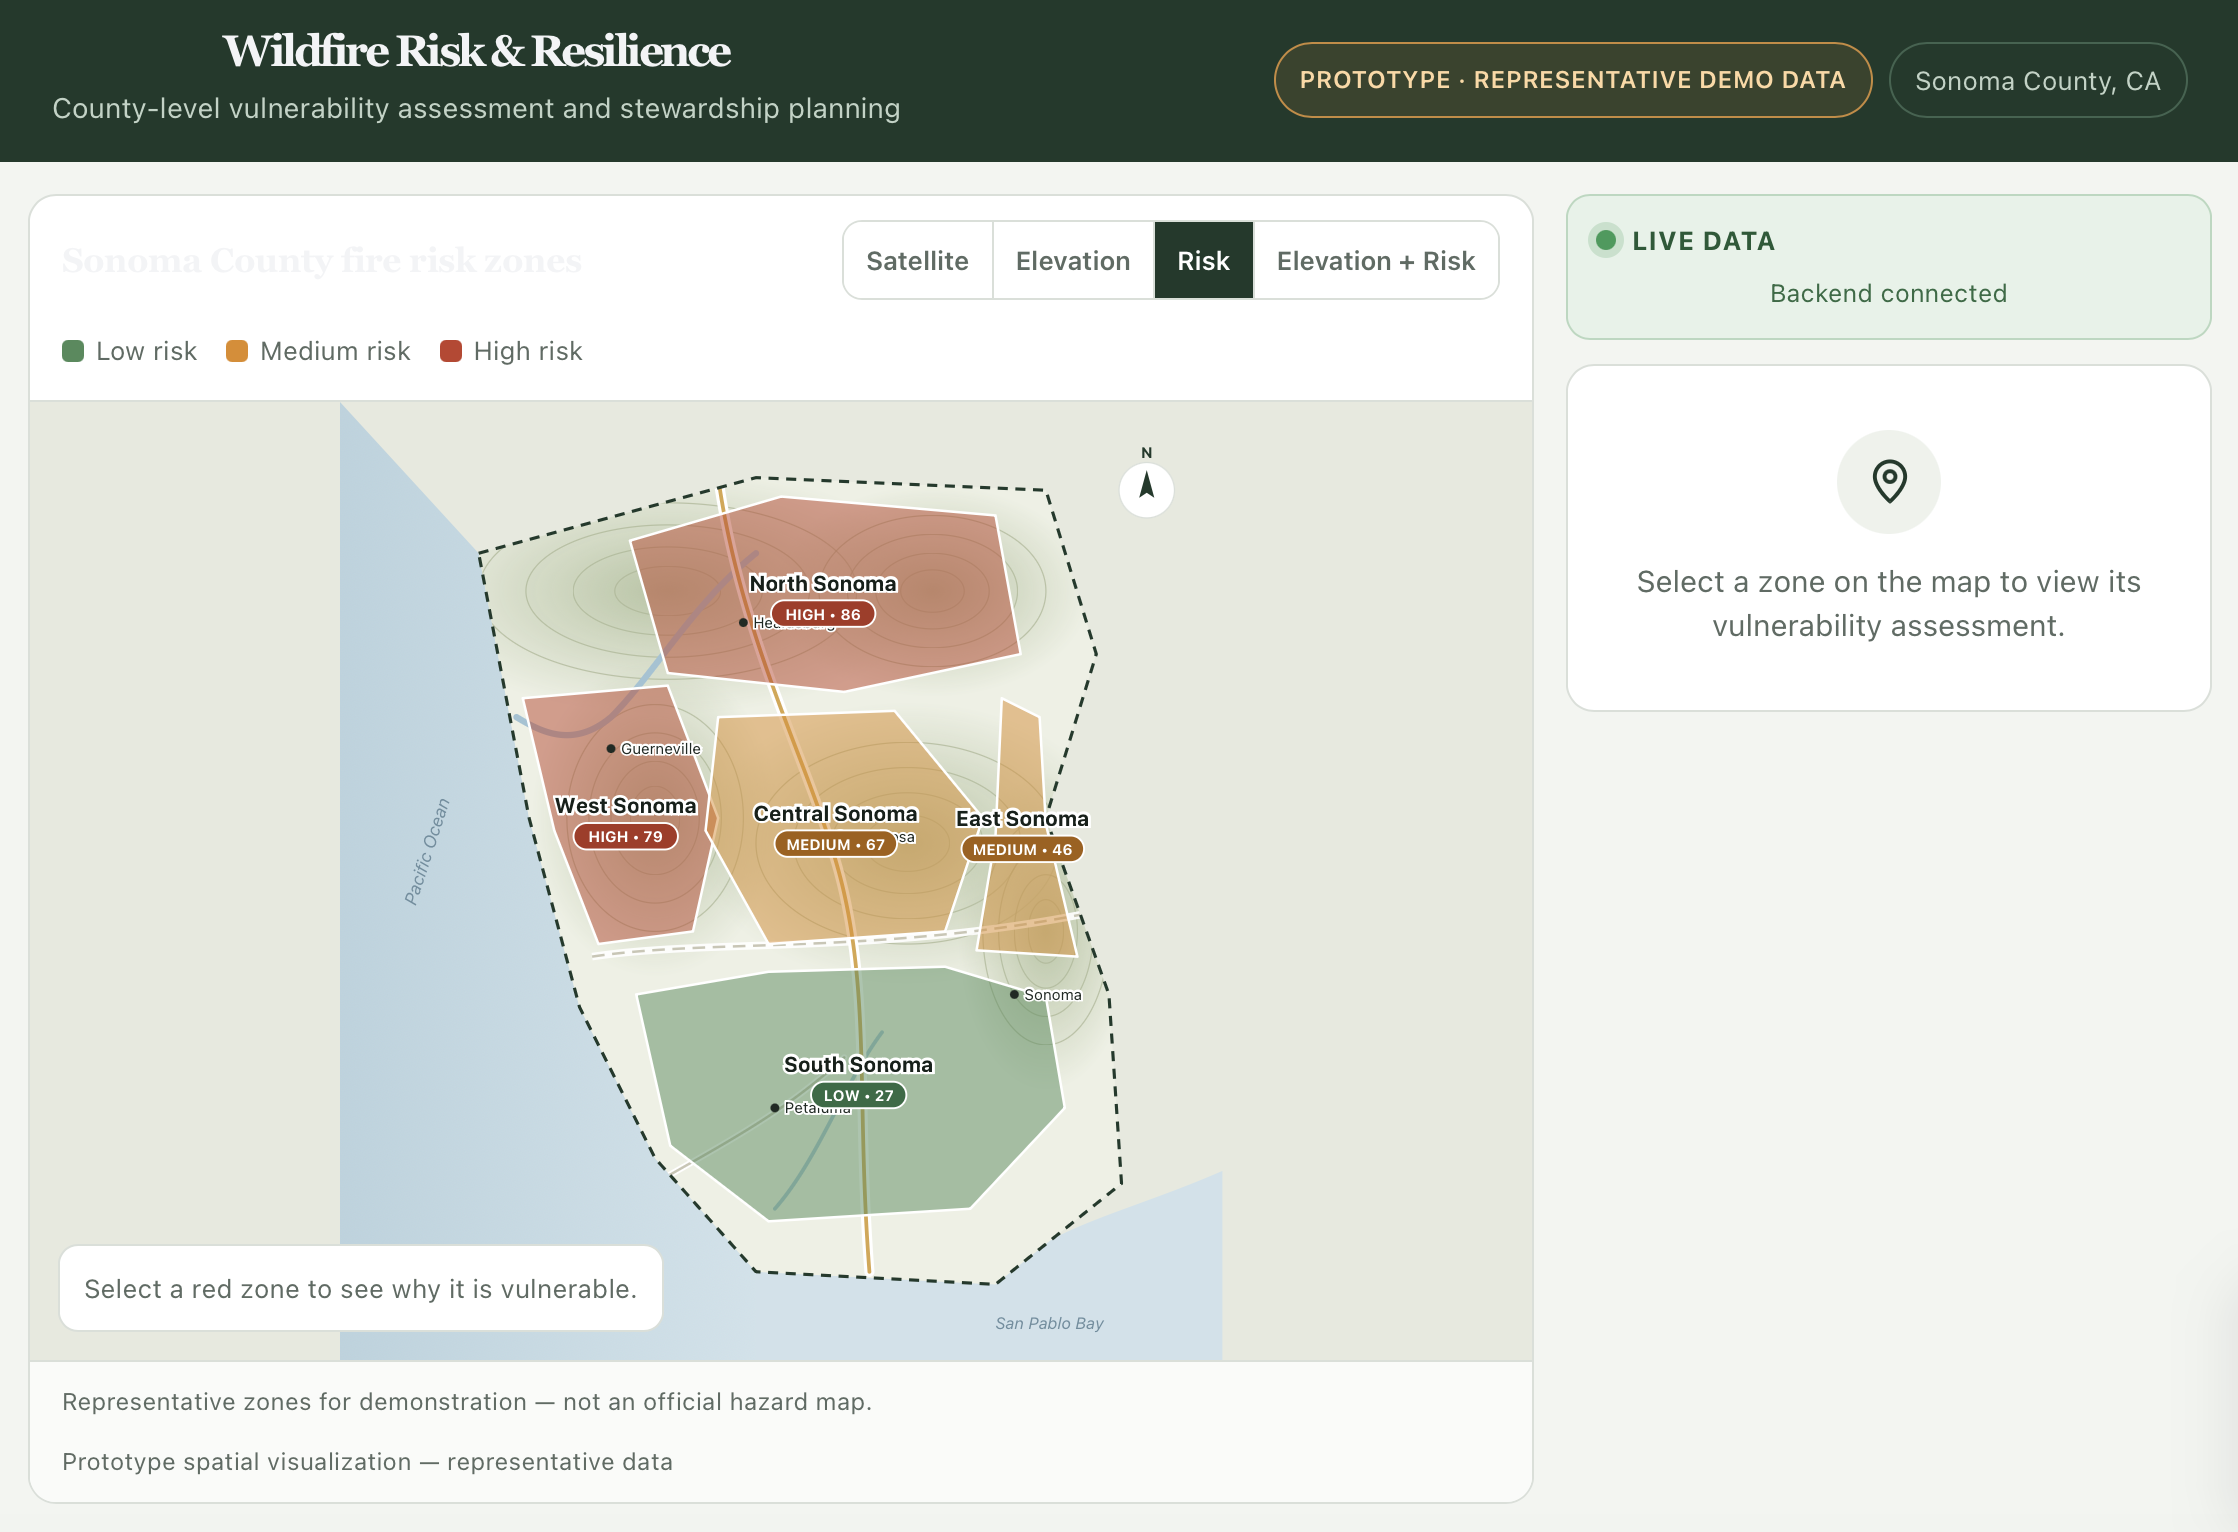
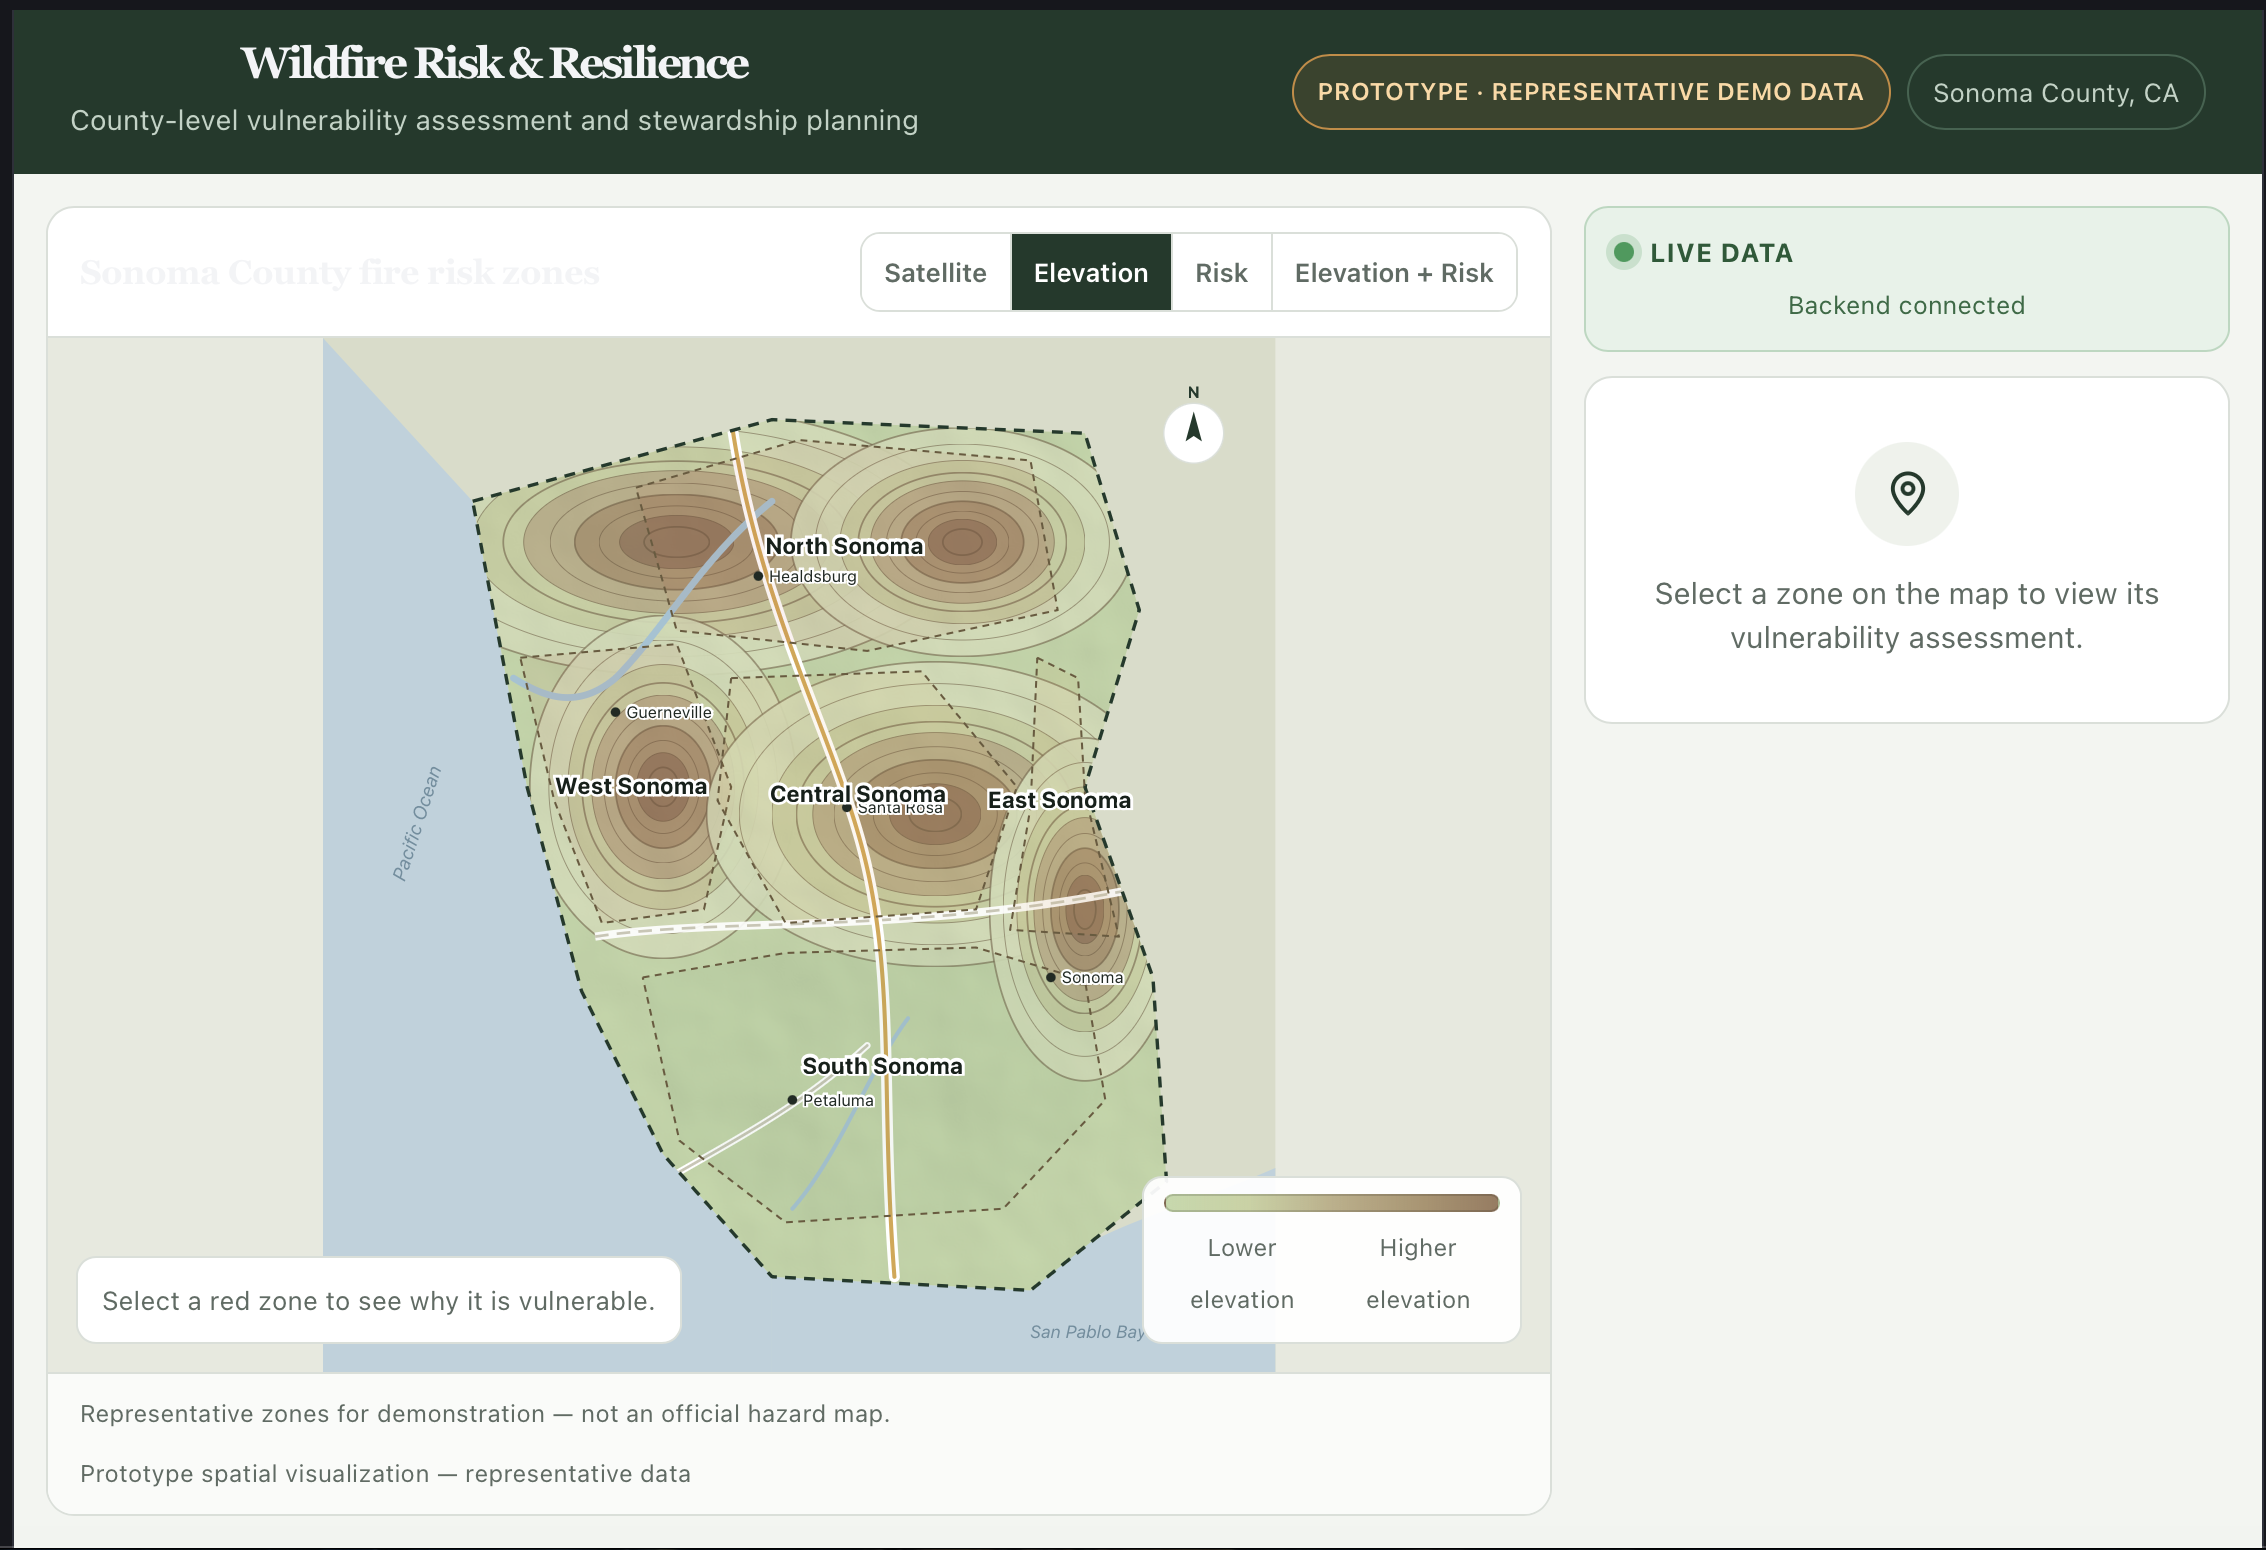
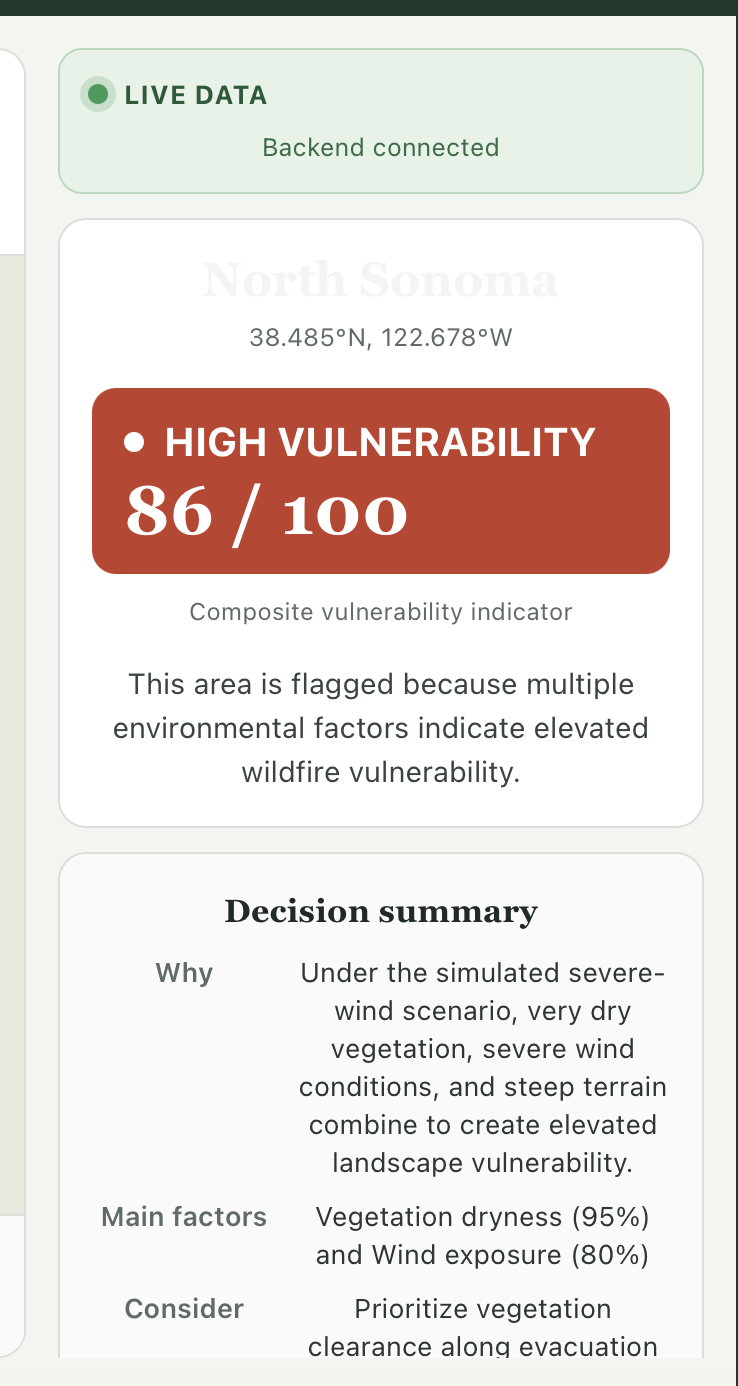
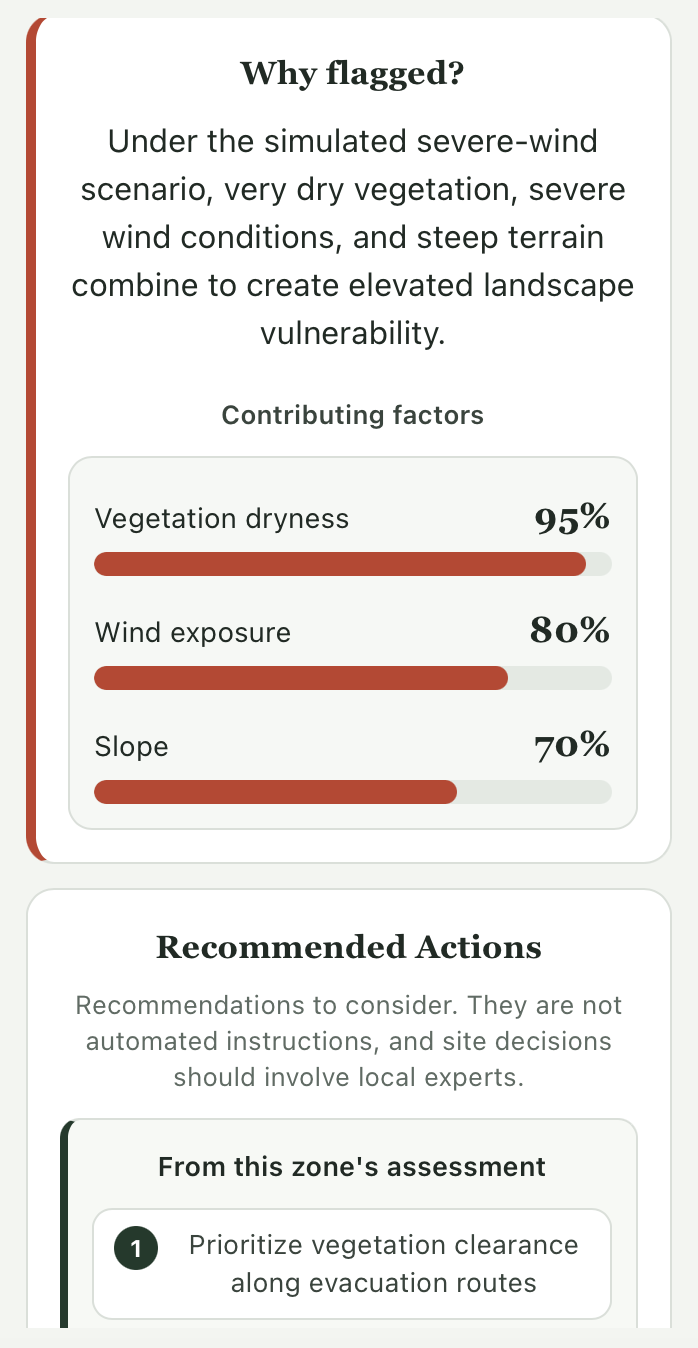
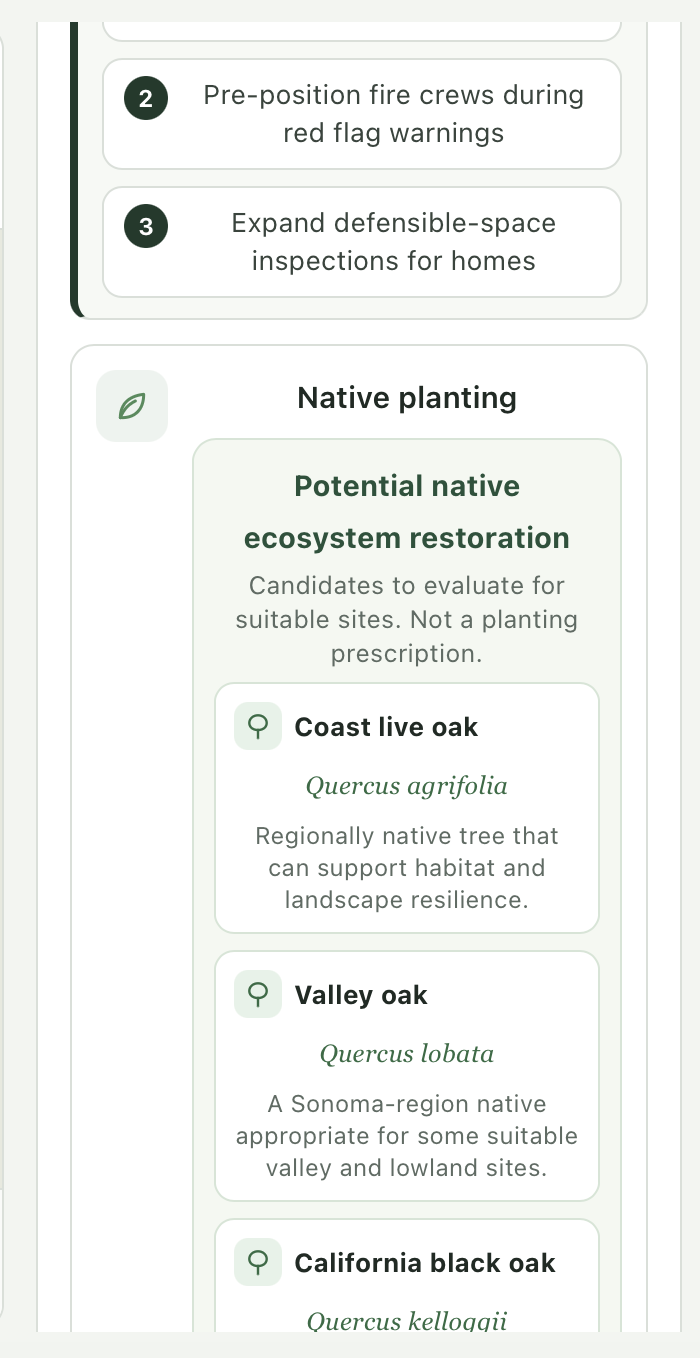
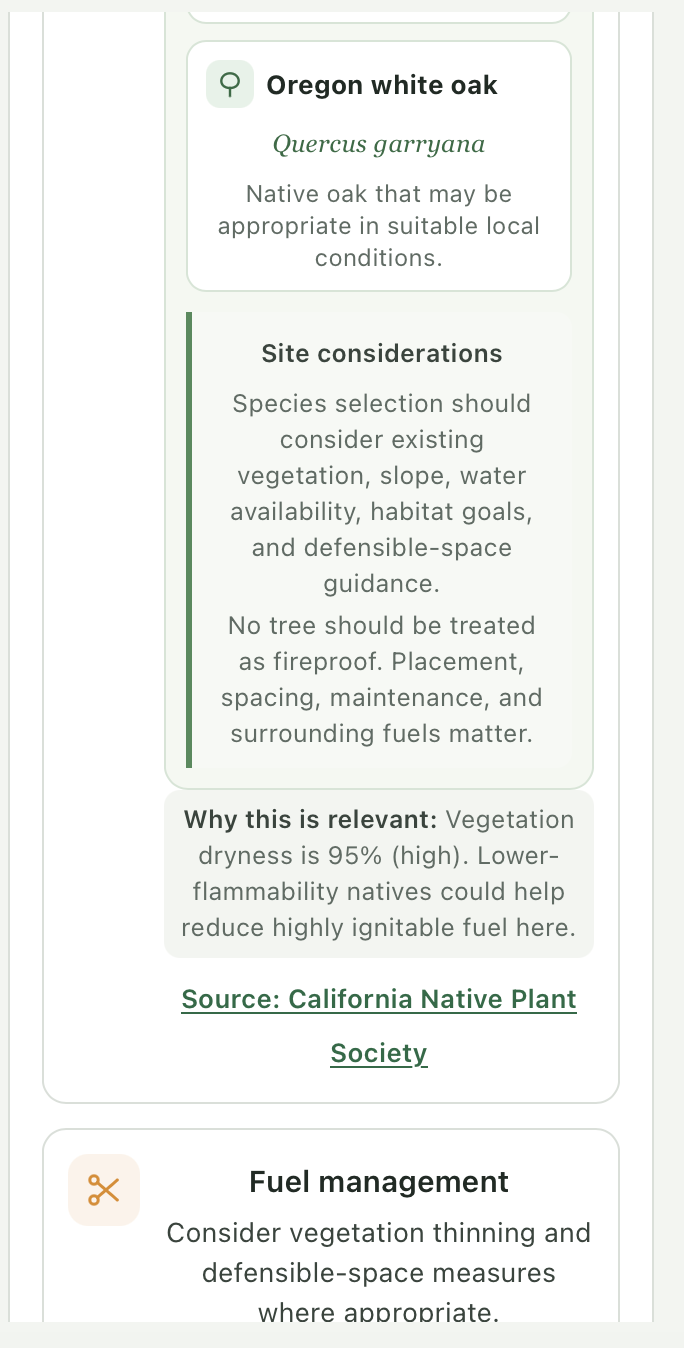
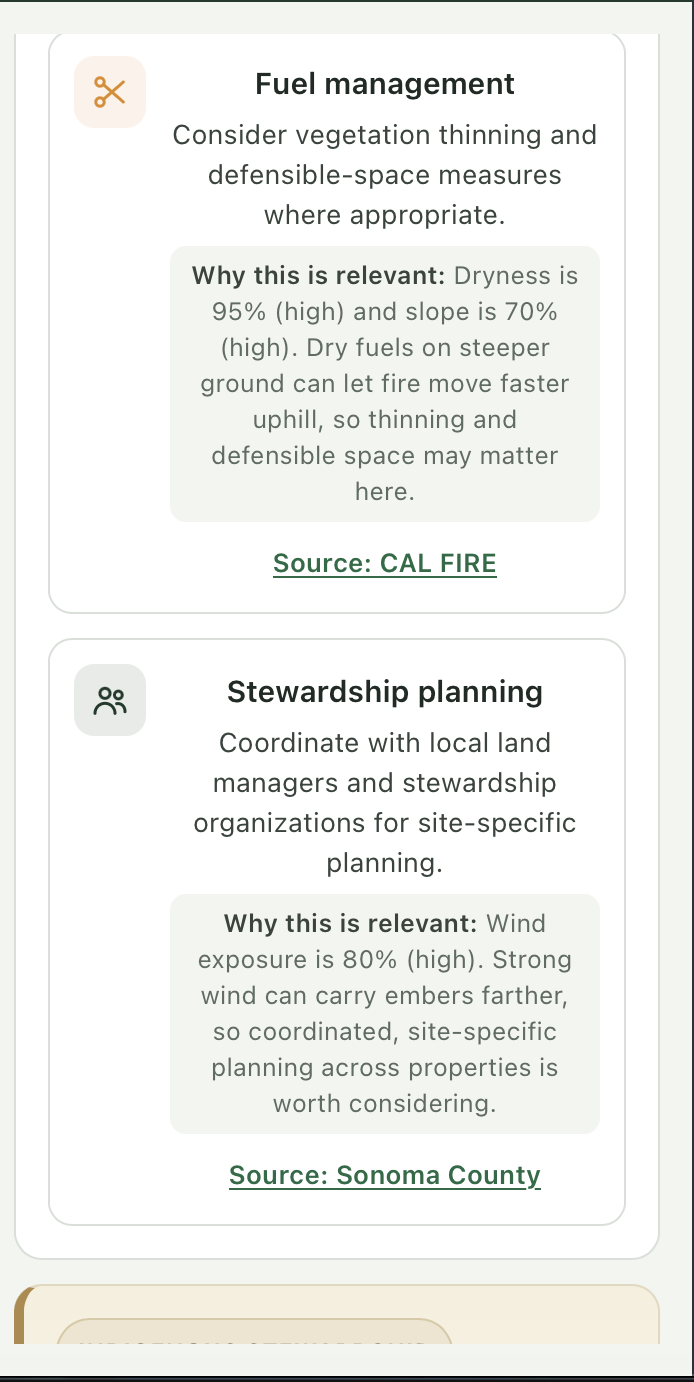
kǫ́ identifies wildfire vulnerability, explains why, and suggests resilience and stewardship actions.
How we built it
We built a React dashboard with a FastAPI backend using seasonal conditions, live wind data, and landscape factors.
Challenges we ran into
Connecting live data while keeping our vulnerability model transparent and responsible.
Accomplishments that we're proud of
Turning wildfire data into an interactive, actionable Sonoma County proof of concept.
What we learned
Environmental resilience requires both data and place-based stewardship.
What's next for kǫ́
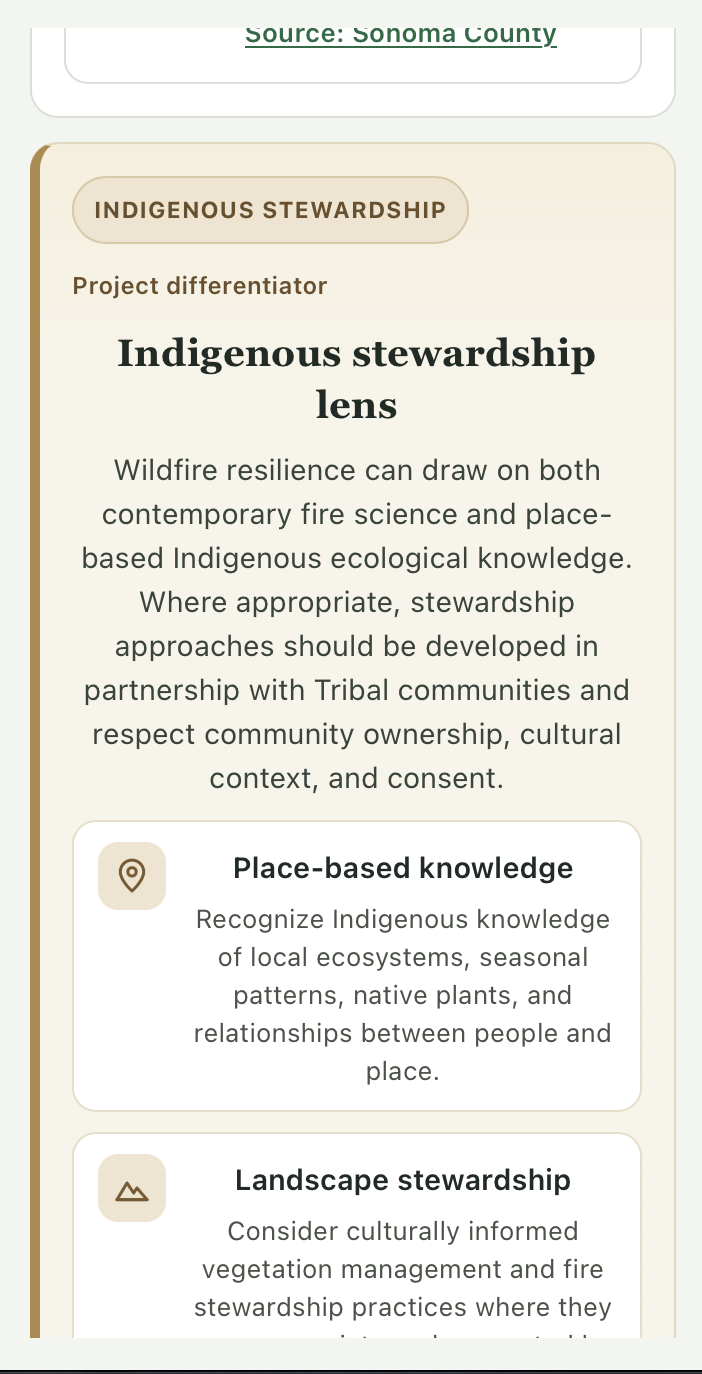
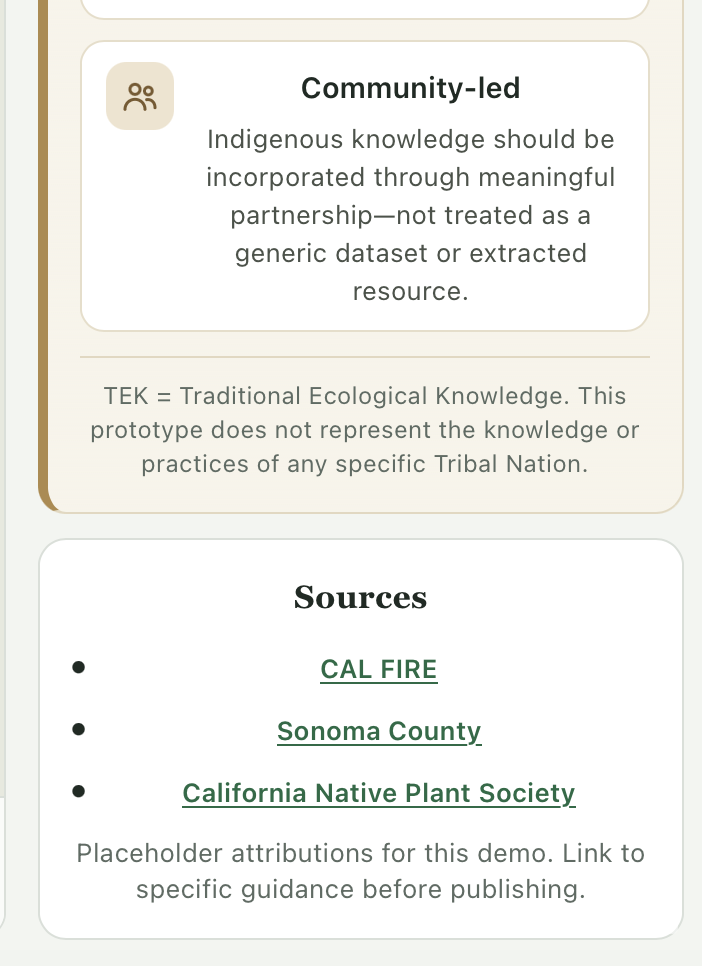
Expand to more regions, integrate richer environmental data, and develop recommendations with local and Tribal partners.

Log in or sign up for Devpost to join the conversation.