-
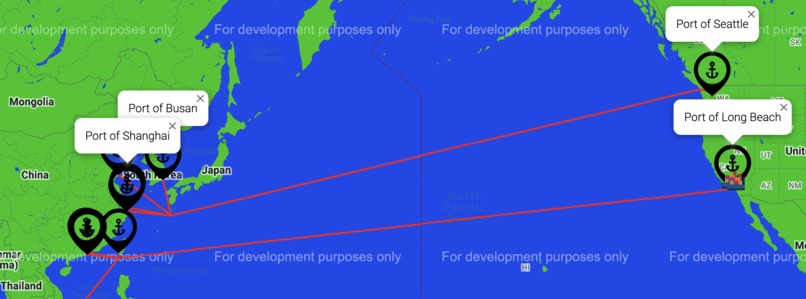
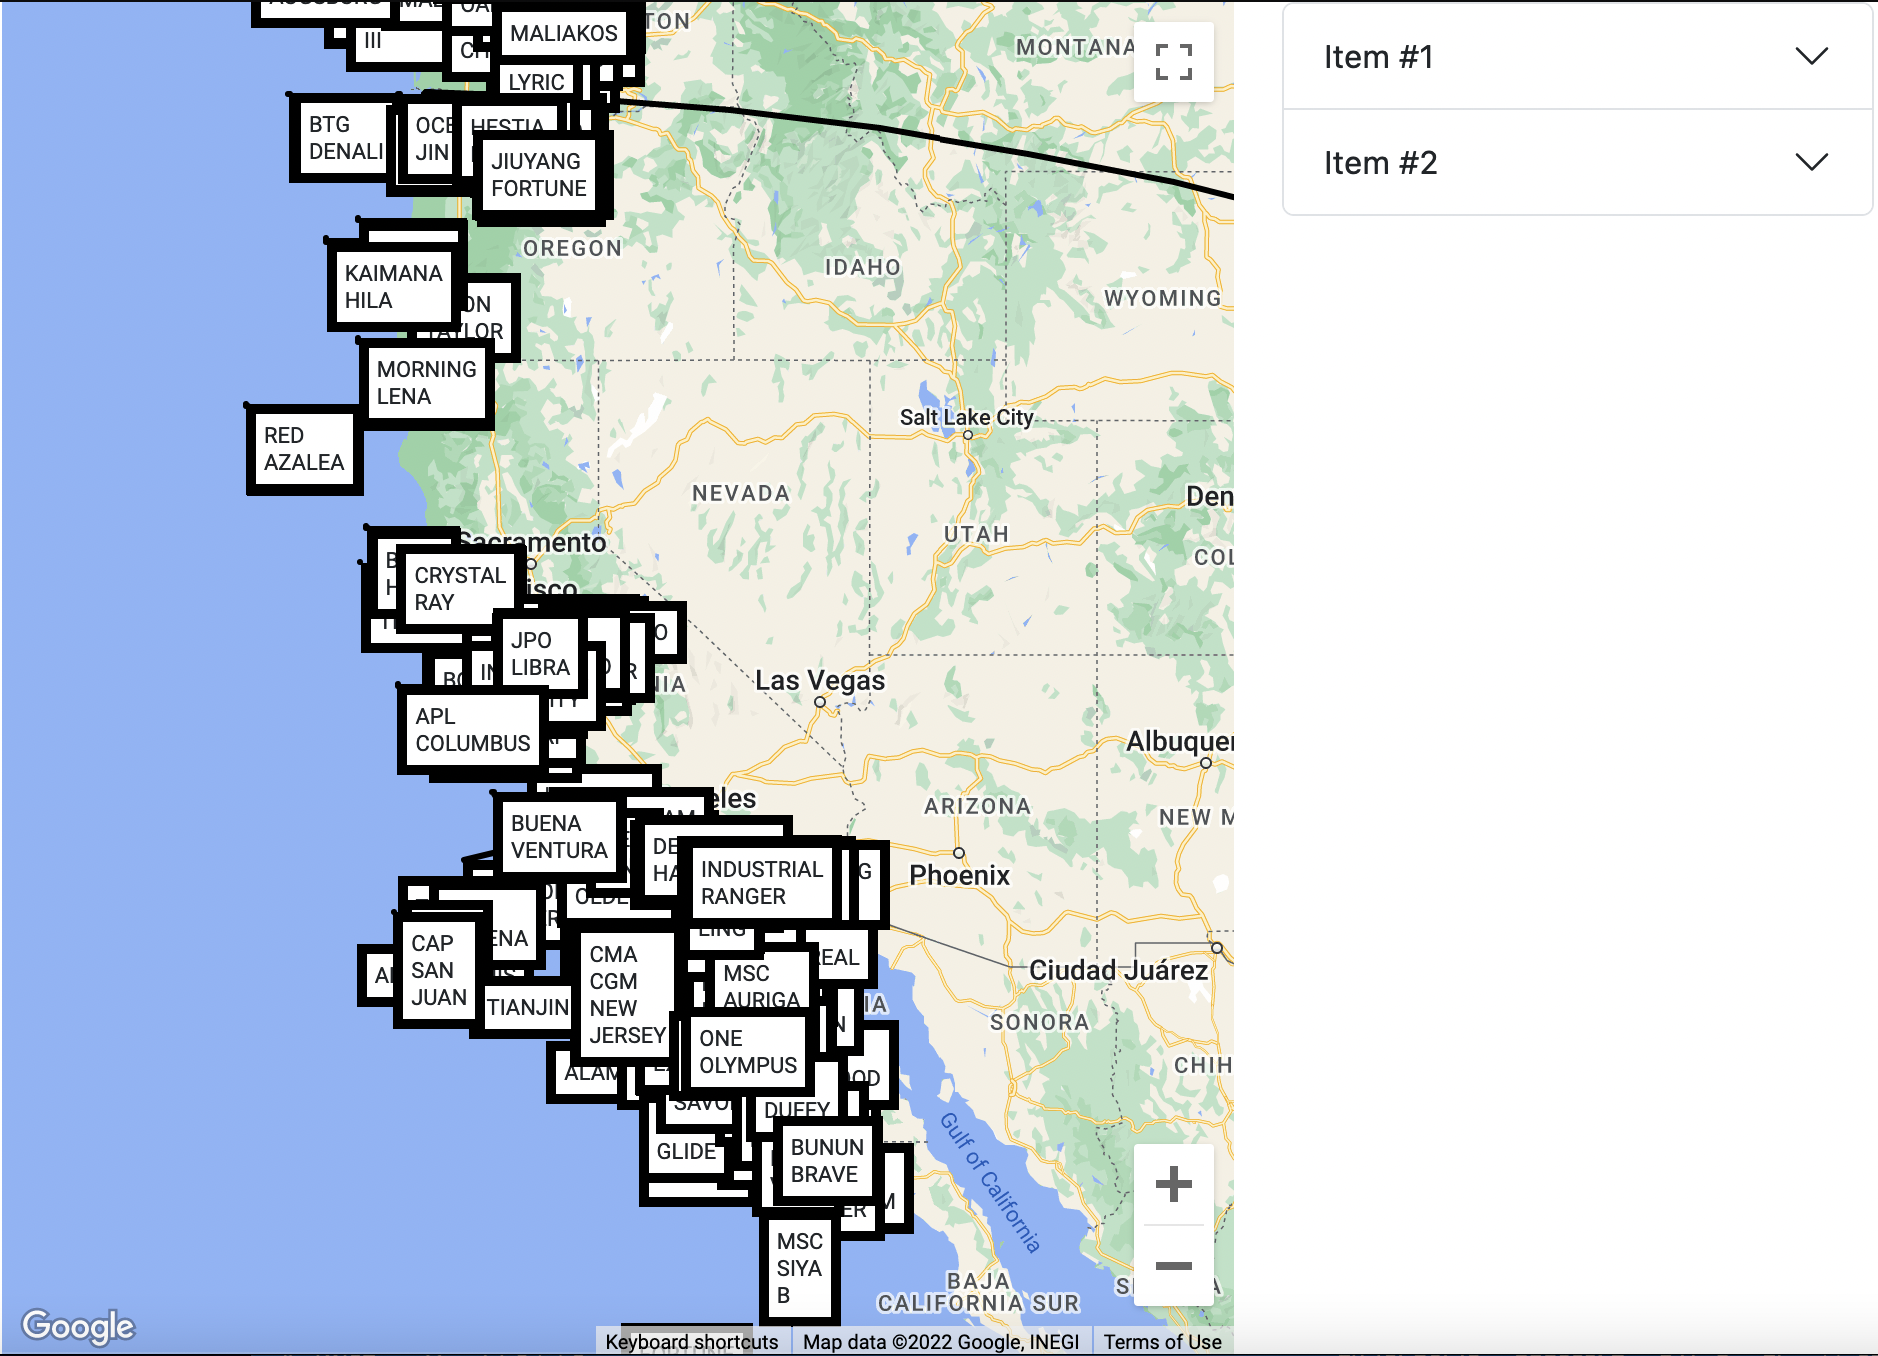
Early Example of the Website
-
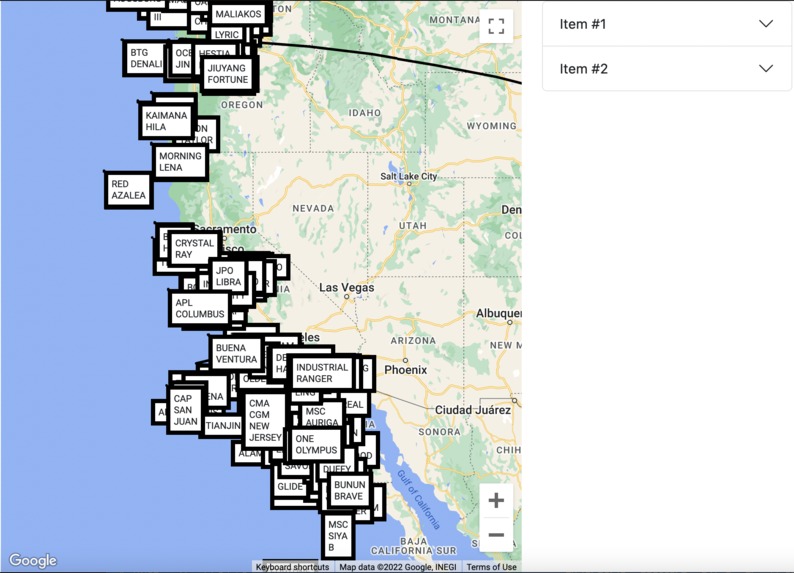
Later example of the website
-
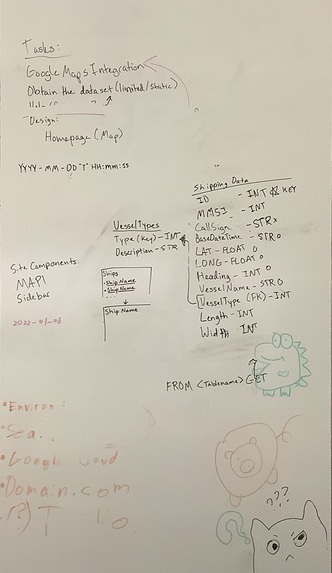
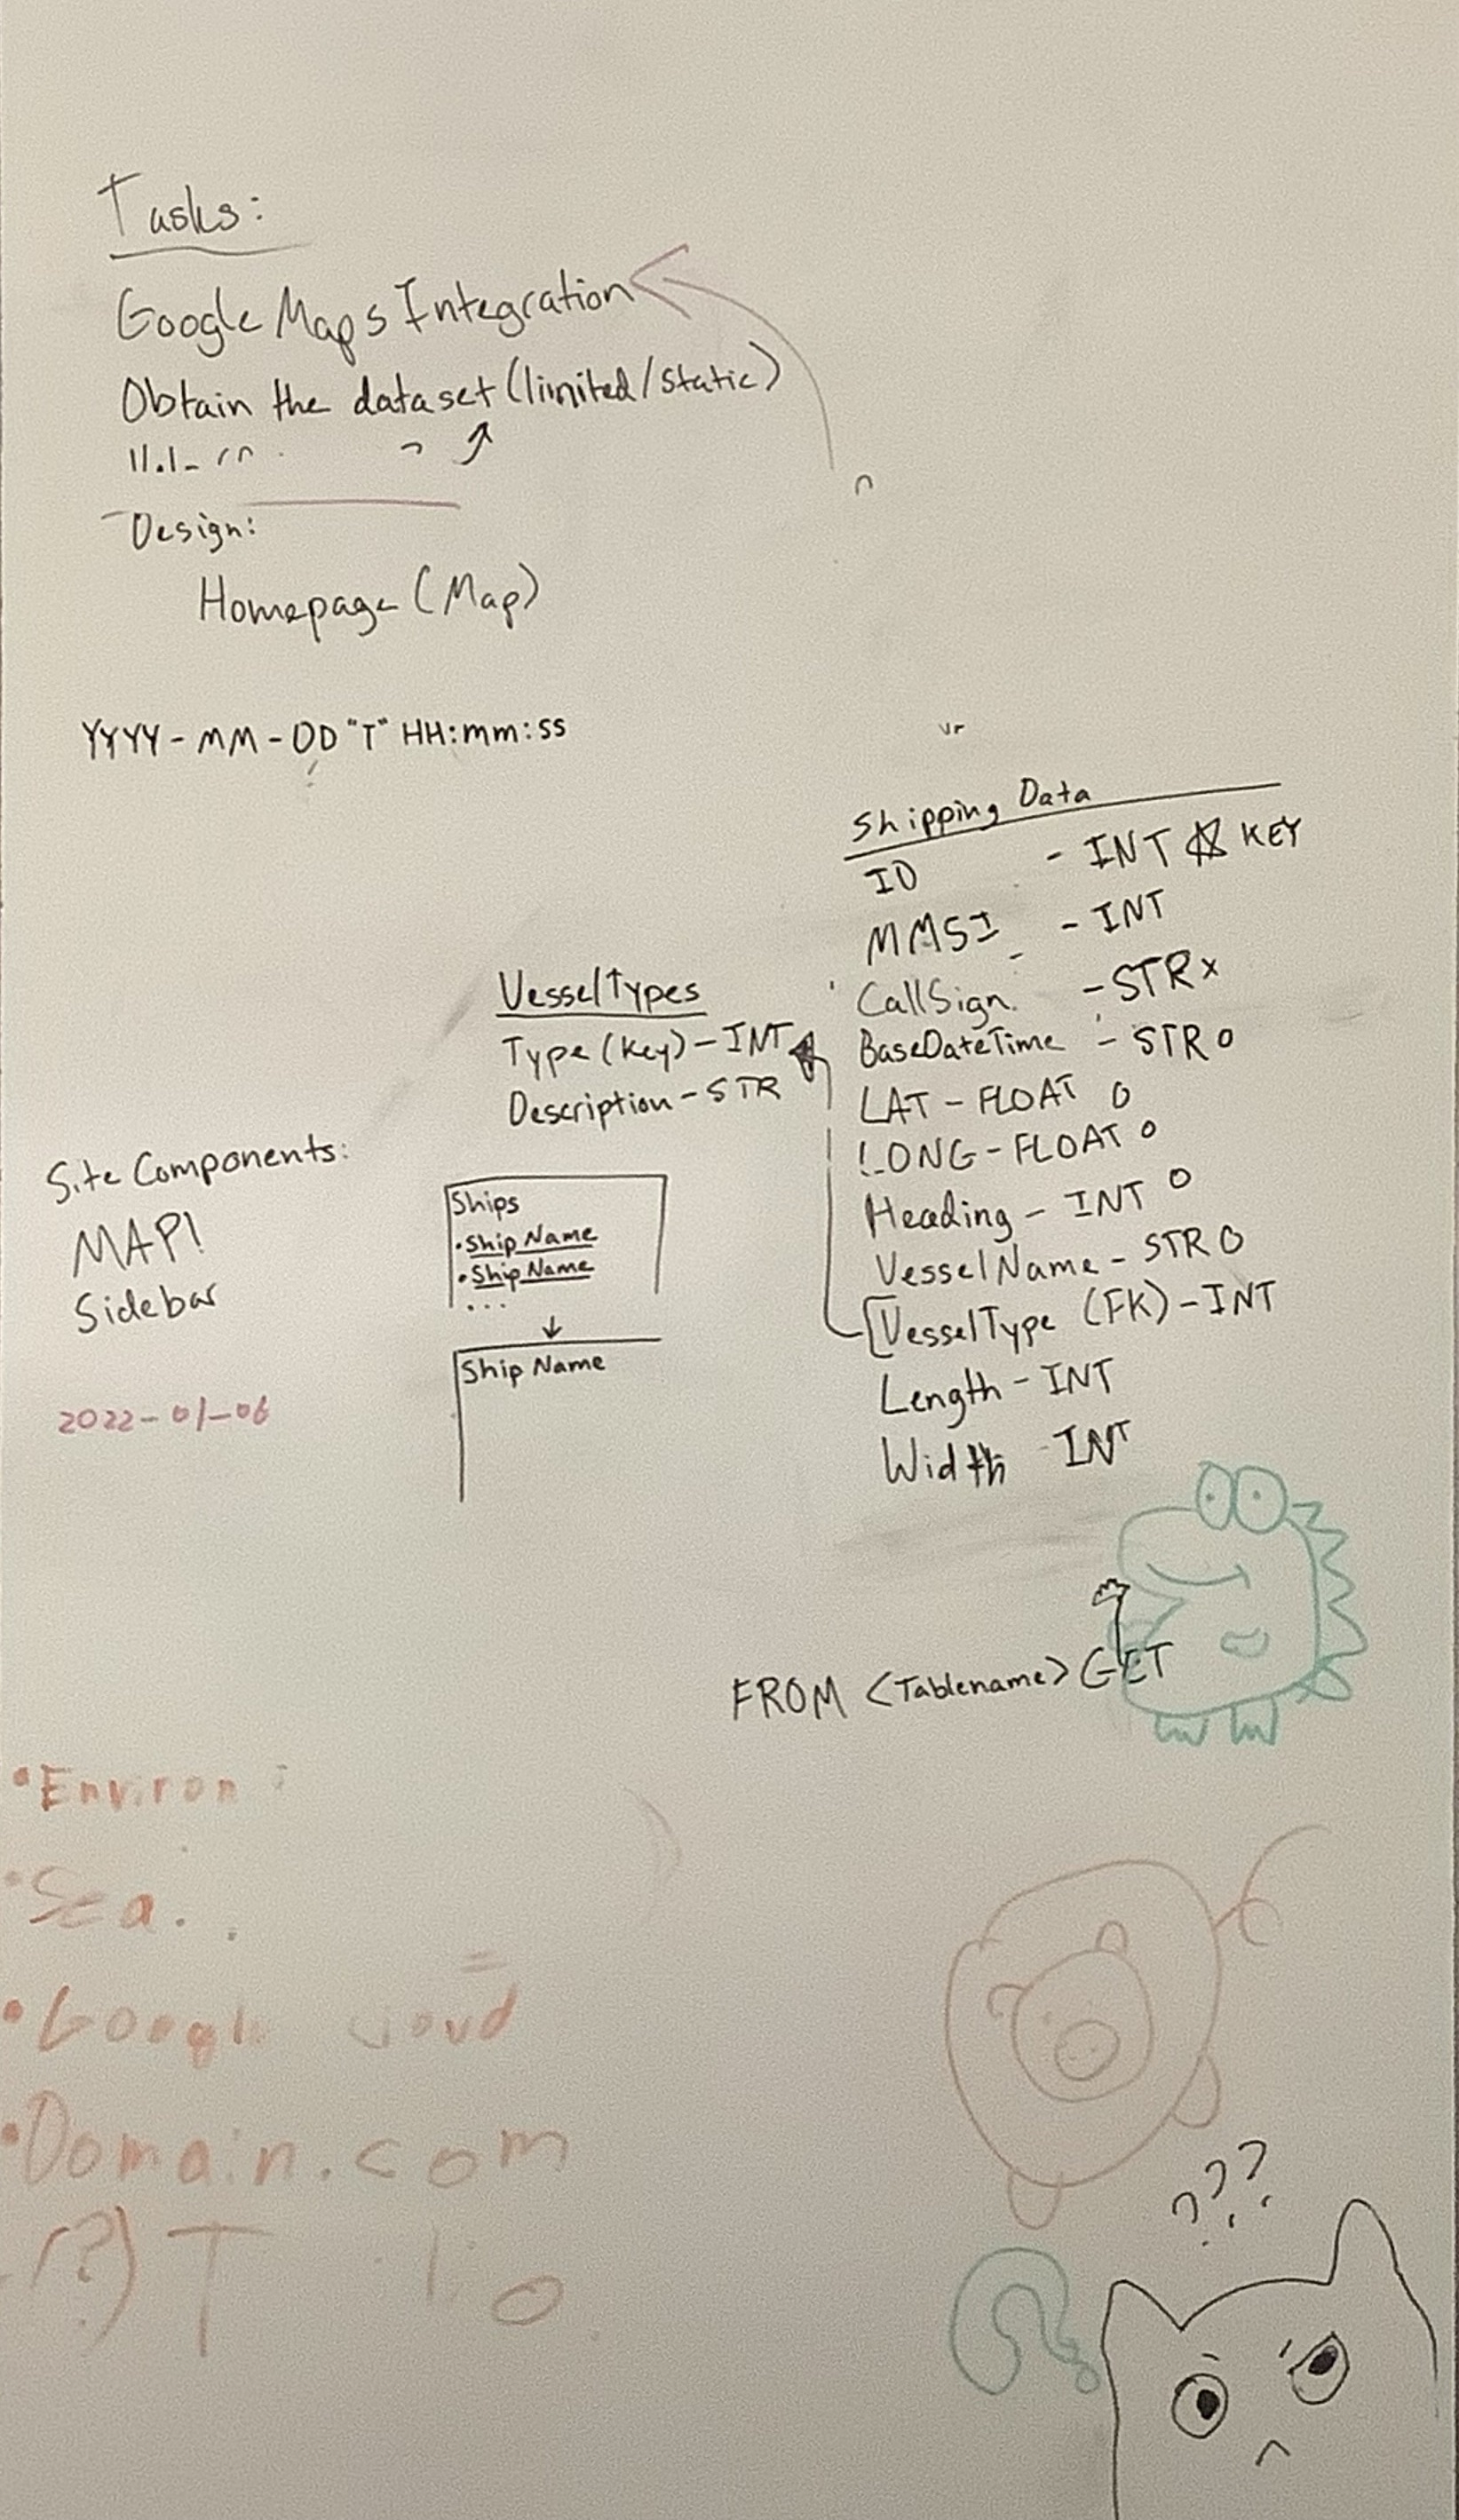
Some of our many white board write ups
-
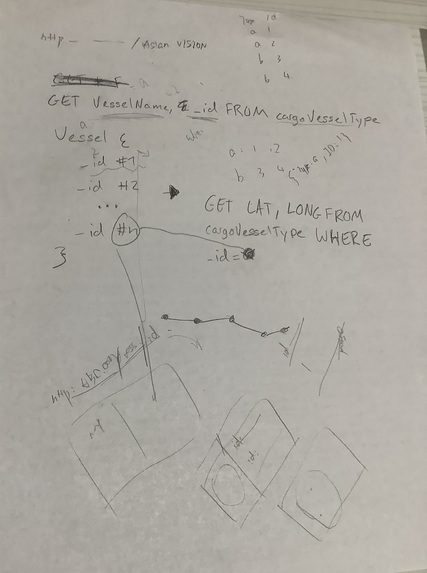
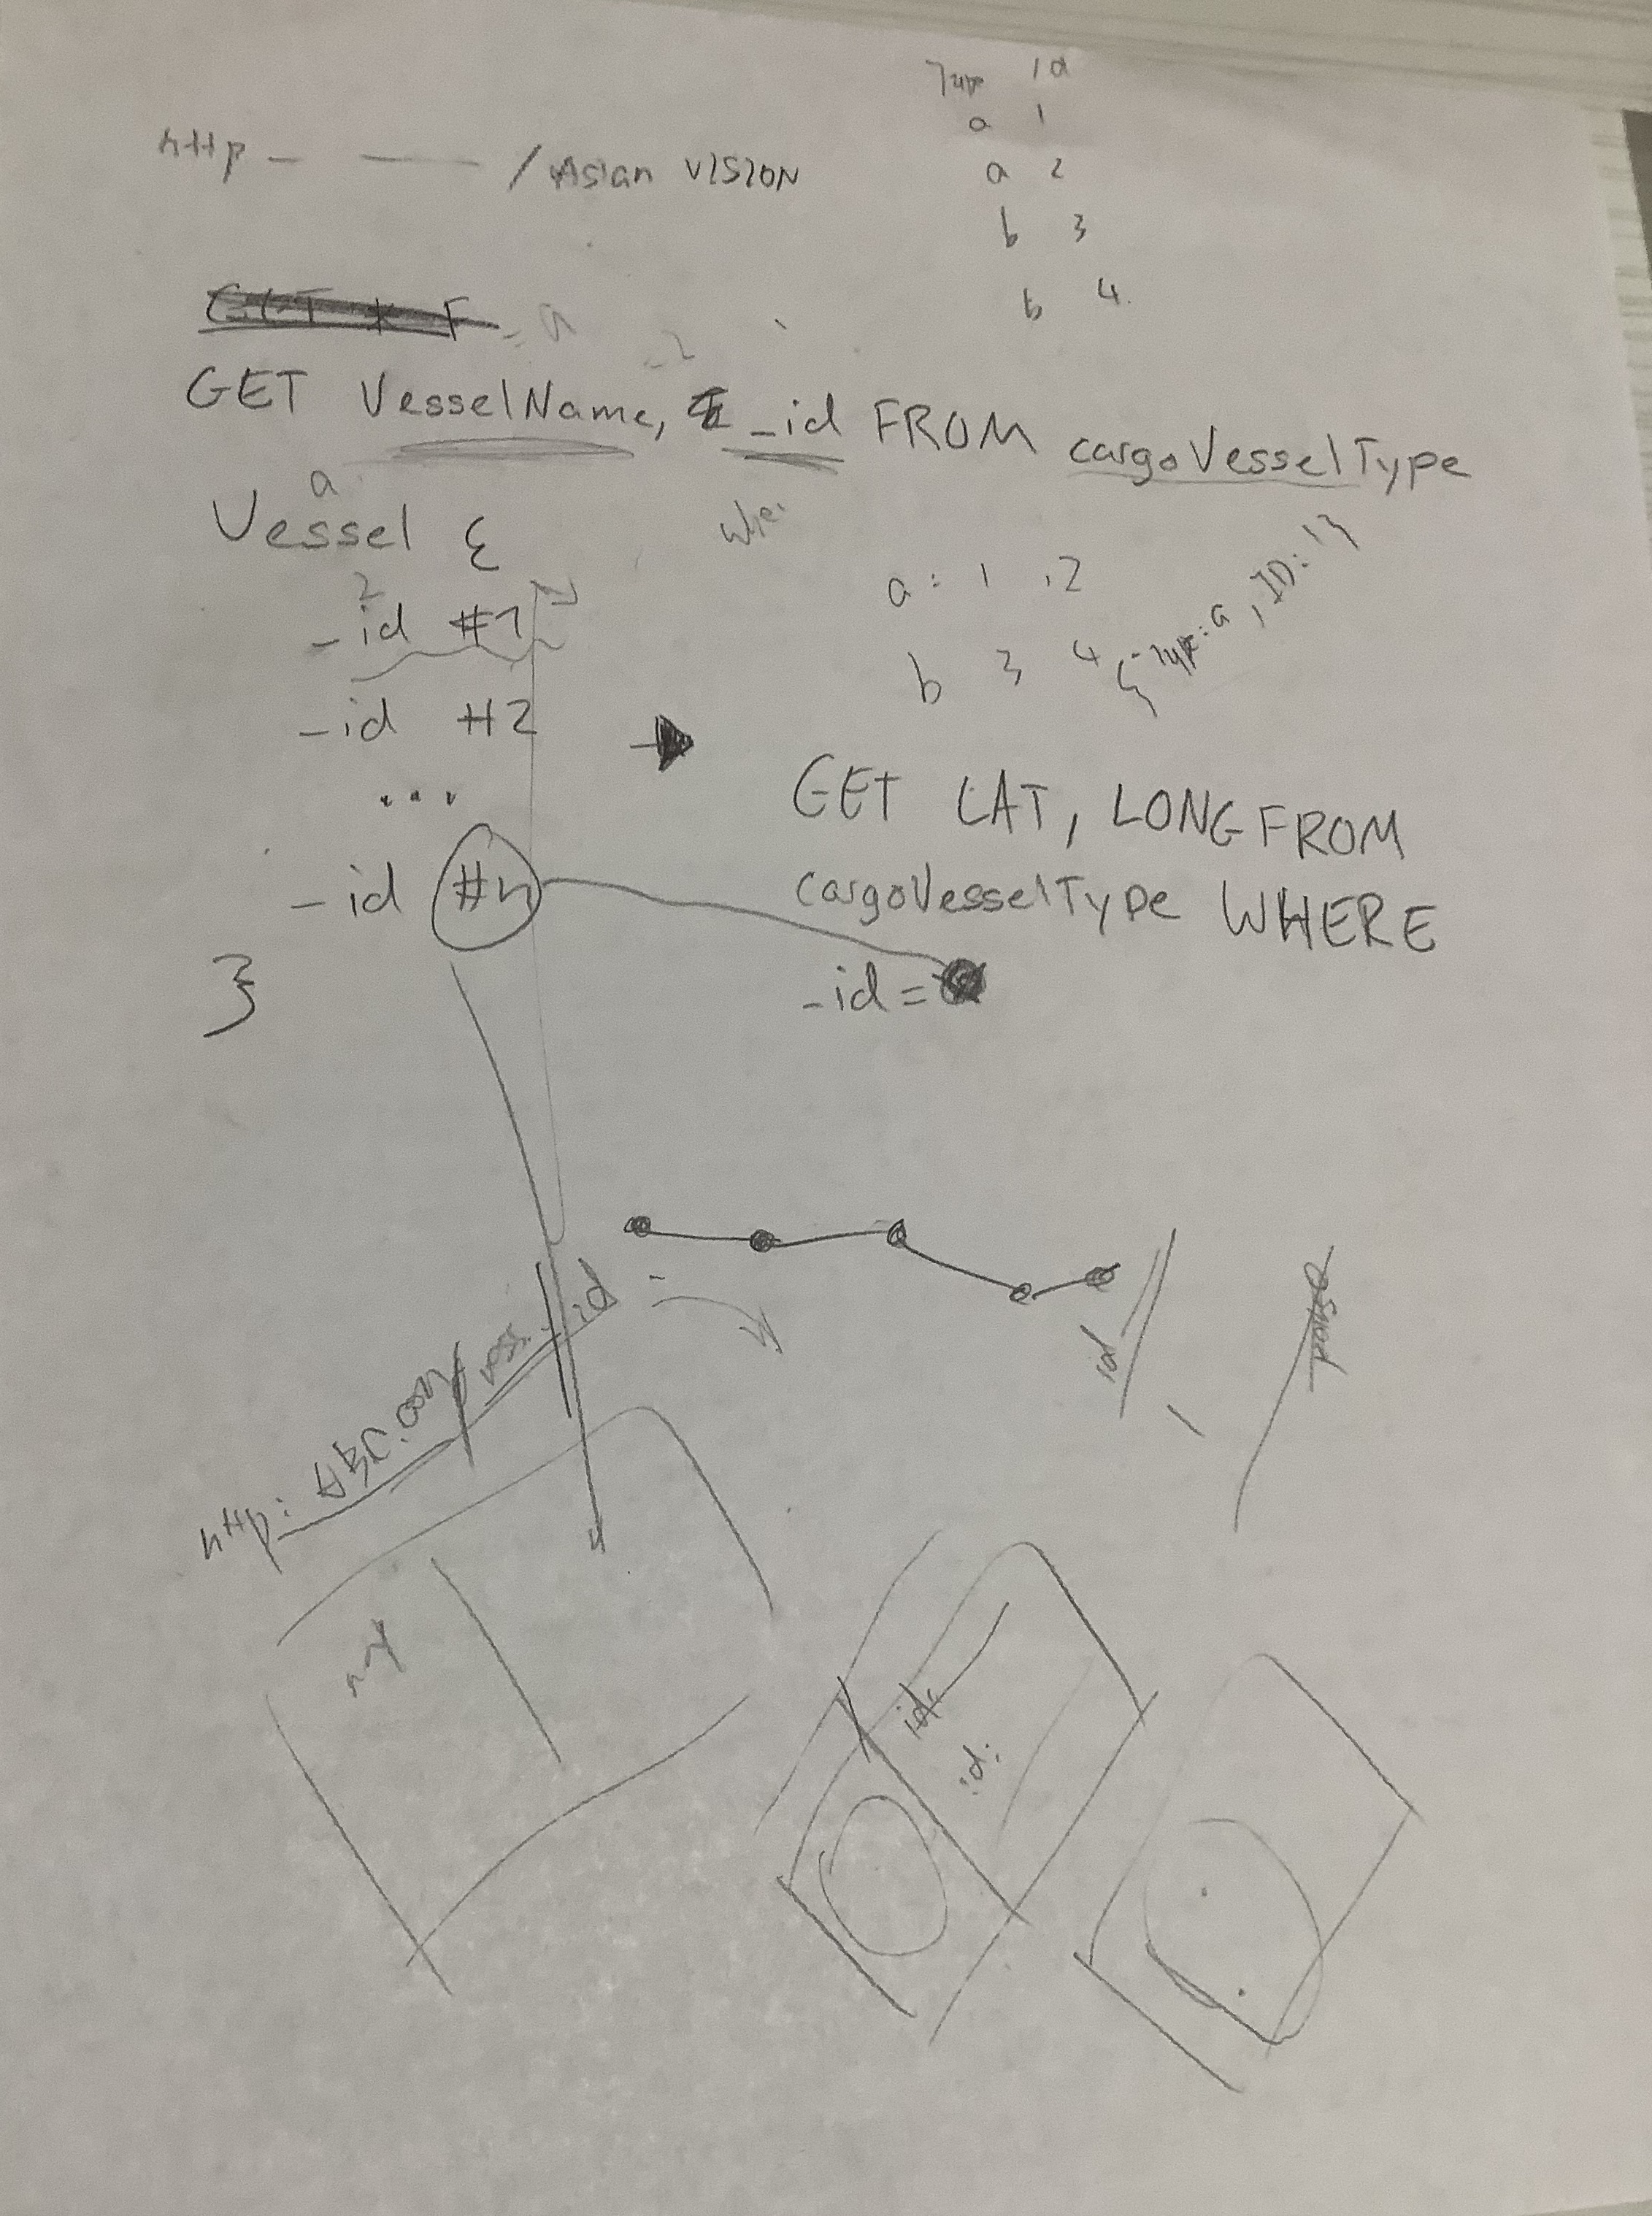
Some paper write ups
-
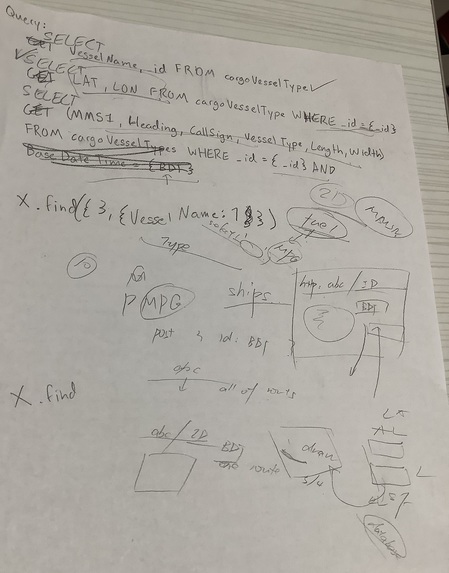
More paper write ups
-
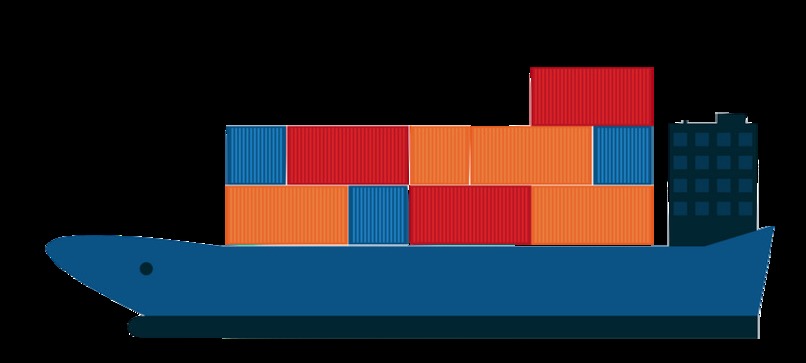
The image of the ship we used on the early maps


Inspiration
Each year, more than 11 billion tons of stuff gets carried around the world by large ships. Clothes, flat-screen TVs, grain, cars, oil — transporting these goods from port to port is what makes the global economy spin. In that case, we also want to track our gas mileage over time to maximize our profit. As a user, people might have some routes they want to travel. We can use the ship's route to calculate the miles per gallon usage as well as the carbon dioxide emissions.
What it does
Our React App could display the routes of ships and provide the cost per gallon of each type of ship. When you choose a ship, we could plot the route of this ship and obtain all the important information about it and then provide the relevant environmental and efficiency scores and values for the vessel.
How we built it
We utilized Google Maps API to generate a global map. We then integrated a National Oceanic and Atmospheric Administration service (NOAA) dataset. We used Node.js and Express at back end and obtain data from a MongoDB instance. This is accessed in the front end using the React.js library, which generates a landing page. In our landing page, we plot the graph about all the ships’ routes over a period of time. We could show any routes for a specific ship and display the cost per gallon and carbon emissions of the vessel. This makes it abundantly clear to all users of the site just how much of an environmental impact the shipping industry, among others, makes on the world. Data Used: https://coast.noaa.gov/data/marinecadastre/ais/VesselTypeCodes2018.pdf https://marinecadastre.gov/ais/
Challenges we ran into
This was most of the people at our team's first Hackathon, and before that, we haven’t had any experience about finishing a project in such a short time. We also learned all of the necessary skills as we went along. For example, Kyle is good at SQL but has no experience with MongoDB, so he spent about 5 hours learning how to use it and what it is, as well as getting more familiar with ReactJS. The integration of the front end and the back end was also one of the major challenges we encountered. Differences in pulling and testing each others code became a bit more difficult from differences in operating system (Windows, Mac).
Accomplishments that we're proud of
We are proud that this team worked out a project that achieved our expectations, especially seeing as this is the first hackathon for most of us and that none of us had working together in any similar way prior to this event. We experienced many tools that we had never previously used. We adapted to the timeline and handed in a website we were satisfied with.
What we learned
We attempted to adopt Velo for the full stack design but resulted a bit cumbersome to use since it doesn't allow concurrent editing. Then we tried to use SQL for data set extraction but we had to switch to MongoDB in the half way in order to import data into our back end.
What's next for MicroShip?
Enhance the interaction between the front end and back end of our ship route website. Expand our collection of data in ship routes. Try to find a solution for voyage planning.

Log in or sign up for Devpost to join the conversation.