-

-
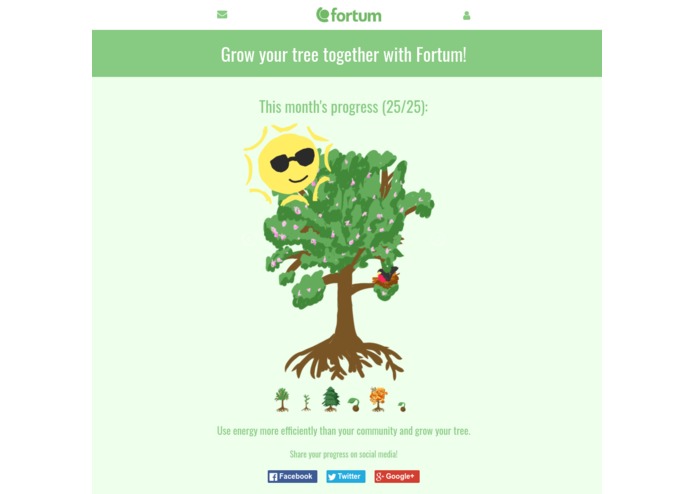
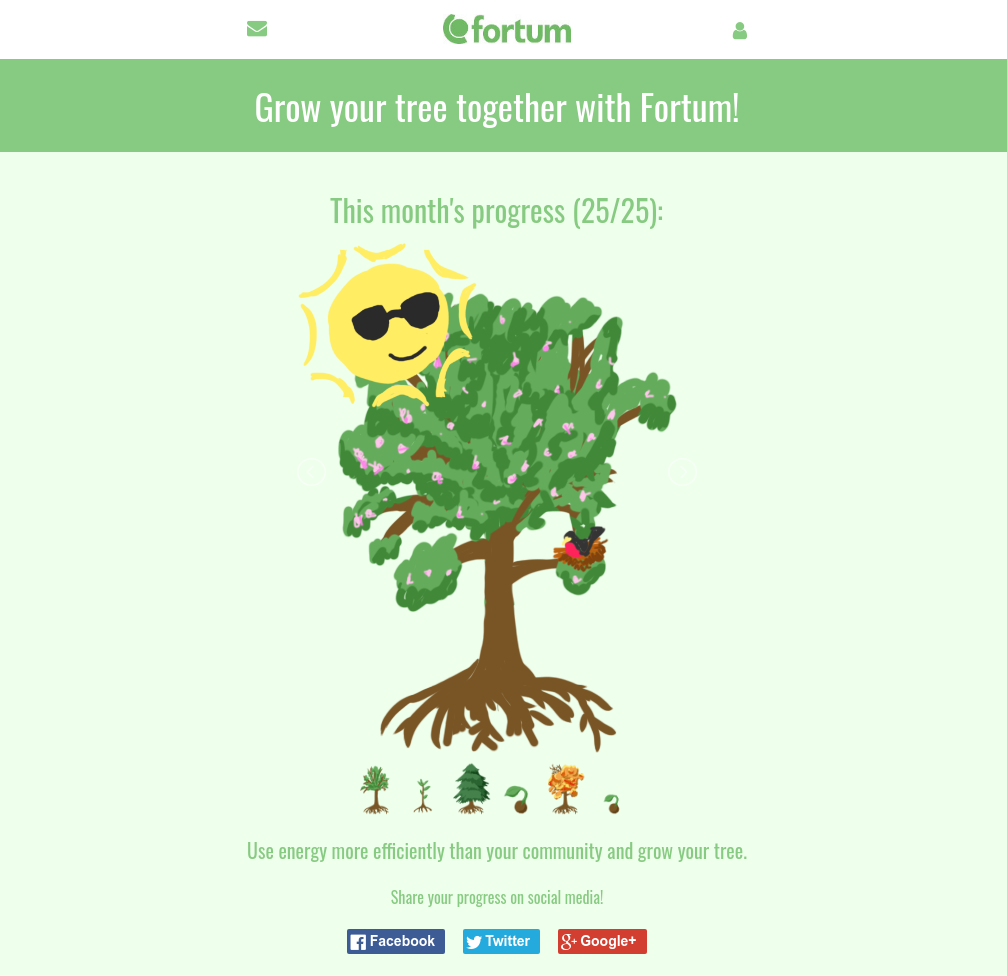
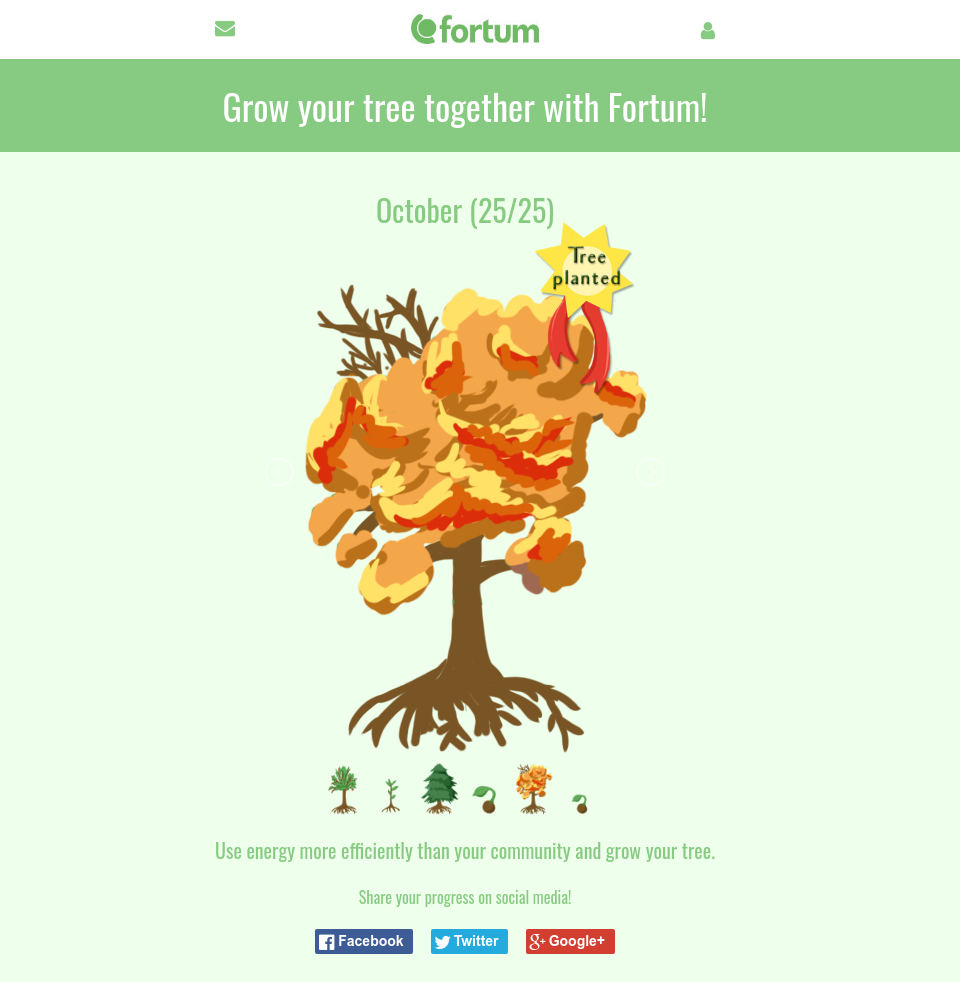
Real-time comparison to peers with the illustrated Sun
-
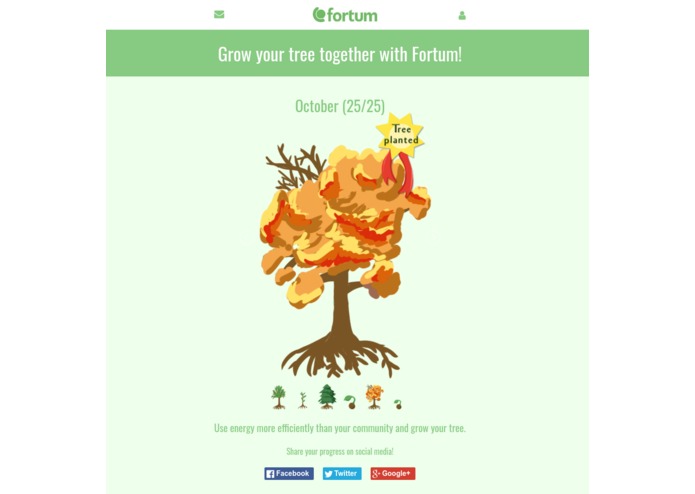
The full grown tree allows donation to plant actual trees
-
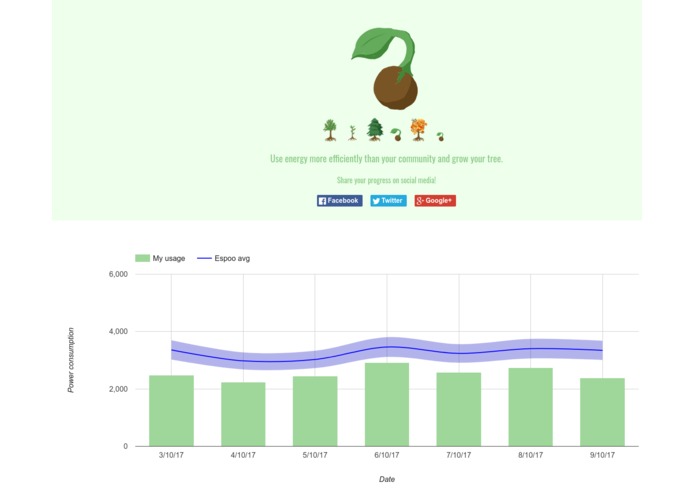
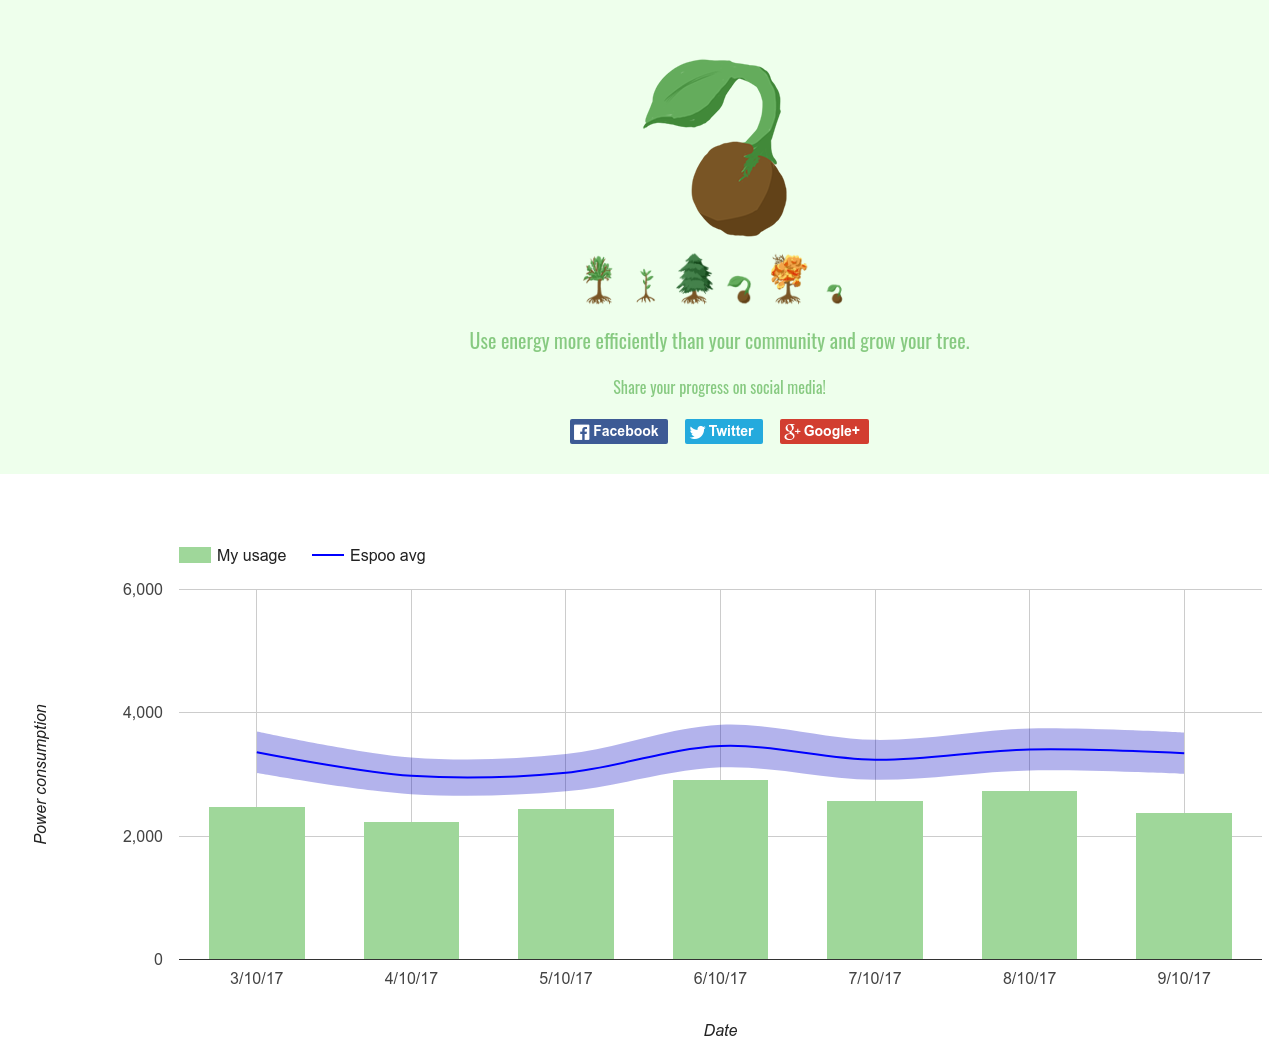
Clicking tree opens the numerical history data

Inspiration
Houses are getting smarter with better sensors and remote controls, however, are we as customers adapting to our smarter homes? The data might be there in view for us, but maybe we need something more engaging to keep us motivated about our consumption. Our team tackled this challenge with smart combination of data visualization and cheerful graphics to provide engaging service for monitor energy consumption. Not to mention, why not contribute by planting trees while we are on it?
What it does
Electree focuses on providing consumers fair comparison to their electricity consumption with others. This comparison is exquisitely visualized by growing trees. Each month there is a new tree to grow with unique visuals to that month for you collector enthusiasts. The current month's tree grows if the customer fares better than consumption average of their local area / similar households on that day. The app displays the Sun shining or hidden behind the cloud coverage to help customers get an instant grasp on whether they are progressing towards their goal. The real-time progress gets the user engaged to follow their consumption every day.
At the end of each month, the current progress on the tree is saved to the consumer's gallery among the accomplishments of the previous months. Each fully grown tree can be shared with in the social media and you can compete with your neighbors. Honoring Fortum's mission "For a cleaner world", each virtual tree can be used to donate to plant trees into our environment. A simple way to go green!
How we built it
Using BottlePy web framework, we combined Python back-end with JavaScript front-end to deliver interactive web app.
We wanted to make the site simple to use and understand by focusing on displaying the data through different tree stages. The site is designed so that it could easily be part of Fortum's mobile app: Oma Fortum.
Challenges we ran into
Narrowing down how to engage our customers to follow their consumption toward green values took a lot of iteration. After all, there is many ways to display the data, but what in it can the consumers get excited about?


Log in or sign up for Devpost to join the conversation.