VPP Node Optimizer — Project Story
Inspiration
In January 2023, the UK's National Grid issued its first ever Emergency Demand Flexibility Service warning — asking households to reduce consumption during evening peaks to avoid rolling blackouts. At the same time, EV adoption is accelerating: the UK alone is projected to reach 11 million EVs by 2030.
We asked ourselves a simple question: what if those parked cars were the emergency response?
Every EV sitting on a driveway at 18:00 is a battery. A fleet of 300 of them at 7 kW each represents roughly 2 MW of dispatchable storage — enough to meaningfully shift a substation's load curve. The problem is that today, those batteries charge with the evening peak rather than against it. We wanted to build the software layer that inverts that.
The London Black Cab Opportunity
The most compelling real-world deployment vector we identified is the London Black Cab electric taxi fleet. There are approximately 3,000 licensed electric TX taxis currently operating in London, all using the same LEVC TX platform with a 31 kWh battery and a 7.2 kW onboard charger. Unlike private EVs — which have unpredictable dwell times — Black Cabs follow a highly predictable duty cycle: most drivers finish their shifts between 14:00 and 18:00 and plug in at home or at one of the Capital's rapid charging hubs, sitting idle for 4–8 hours.
This predictability is exactly what a V2G dispatch engine needs. A coordinated fleet of 3,000 TX cabs could theoretically deliver:
C_V2G(peak) = 3,000 × 7.2 kW × 0.90 ≈ 19.4 MW
That is not a rounding error — it is comparable to a peaking gas turbine. Discharged during the 17:00–20:00 winter demand window at Balancing Mechanism prices that regularly exceed £400/MWh, and recharged overnight on cheap wind surplus, the arbitrage opportunity per vehicle is real and recurring. A cab driver becomes, in effect, a micro grid-services provider — earning passive income while their vehicle sits idle, without a single extra mile driven.
What We Built
VPP Node Optimizer is a real-time Vehicle-to-Grid dispatch engine and analytics dashboard. It combines a neural demand forecast with a physics-grounded optimization engine to tell a fleet operator exactly when to discharge, how much revenue they will earn, and what carbon impact they will have — before the peak even arrives.
The Neural Forecasting Core
We trained a DLinear model: a decomposition-linear architecture that separates the input signal into trend and seasonal components before projecting forward.
The core projection is:
$$\hat{x}{t+h} = \mathbf{W} \cdot \bigl[\,\text{Seasonal}(x{t-L:t})\;|\;\text{Trend}(x_{t-L:t})\,\bigr]$$
where L = 60 half-hour steps (30 hours of history) and the forecast horizon H = 60 steps (30 hours ahead).
The trend component is extracted via causal moving-average pooling with kernel size 25, and the seasonal component is the residual:
$$\text{Seasonal}(x) = x - \text{MovingAvg}(x)$$
The input feature vector is augmented with first-difference deltas to give the model explicit access to the rate of change of each signal:
$$\tilde{x}t = \bigl[x_t \;|\; \Delta x_t\bigr], \qquad \Delta x_t = x_t - x{t-1}$$
This yields 38 features (19 grid signals × 2) including wind, solar, nuclear, interconnector flows (French, Dutch, Irish, East-West), pumped storage, and grid frequency — all trained on UKPN half-hourly settlement data.
The Dispatch Logic
The dispatch engine operates on three tiers:
| Mode | Trigger | Fleet Response |
|---|---|---|
| Standby | Forecast clear | No action |
| Proactive Ramp | Forecast ≥ 44 GW within 4-hour window | 25% discharge pre-ramp |
| Real-Time Override | Actual demand ≥ 44 GW | 100% V2G discharge |
Available V2G capacity is time-varying, gated by a UKPN-calibrated plug-in probability P_conn(t). During the 16:00–20:00 home-arrival window it follows a sigmoid ramp centred at 18:00:
$$P_{\text{conn}}(t) = 0.15 + 0.75 \cdot \sigma!\bigl(2(t - 18)\bigr), \qquad \sigma(z) = \frac{1}{1 + e^{-z}}$$
This yields P_conn(16) ≈ 0.16, P_conn(18) ≈ 0.53, P_conn(20) ≈ 0.89 — matching empirical UKPN home-arrival distributions.
Peak dispatchable capacity for a fleet of N vehicles at charger rating P_c:
$$C_{\text{V2G}}(t) = N \cdot P_c \cdot P_{\text{conn}}(t)$$
Energy Arbitrage & Economics
Net profit per dispatch event accounts for round-trip efficiency losses and per-cycle battery degradation:
$$\Pi = E_d \cdot p_{\text{sell}} \;-\; \frac{E_d}{\eta} \cdot p_{\text{buy}} \;-\; E_d \cdot 1{,}000 \cdot C_{\text{deg}}$$
where:
- E_d = energy discharged (MWh)
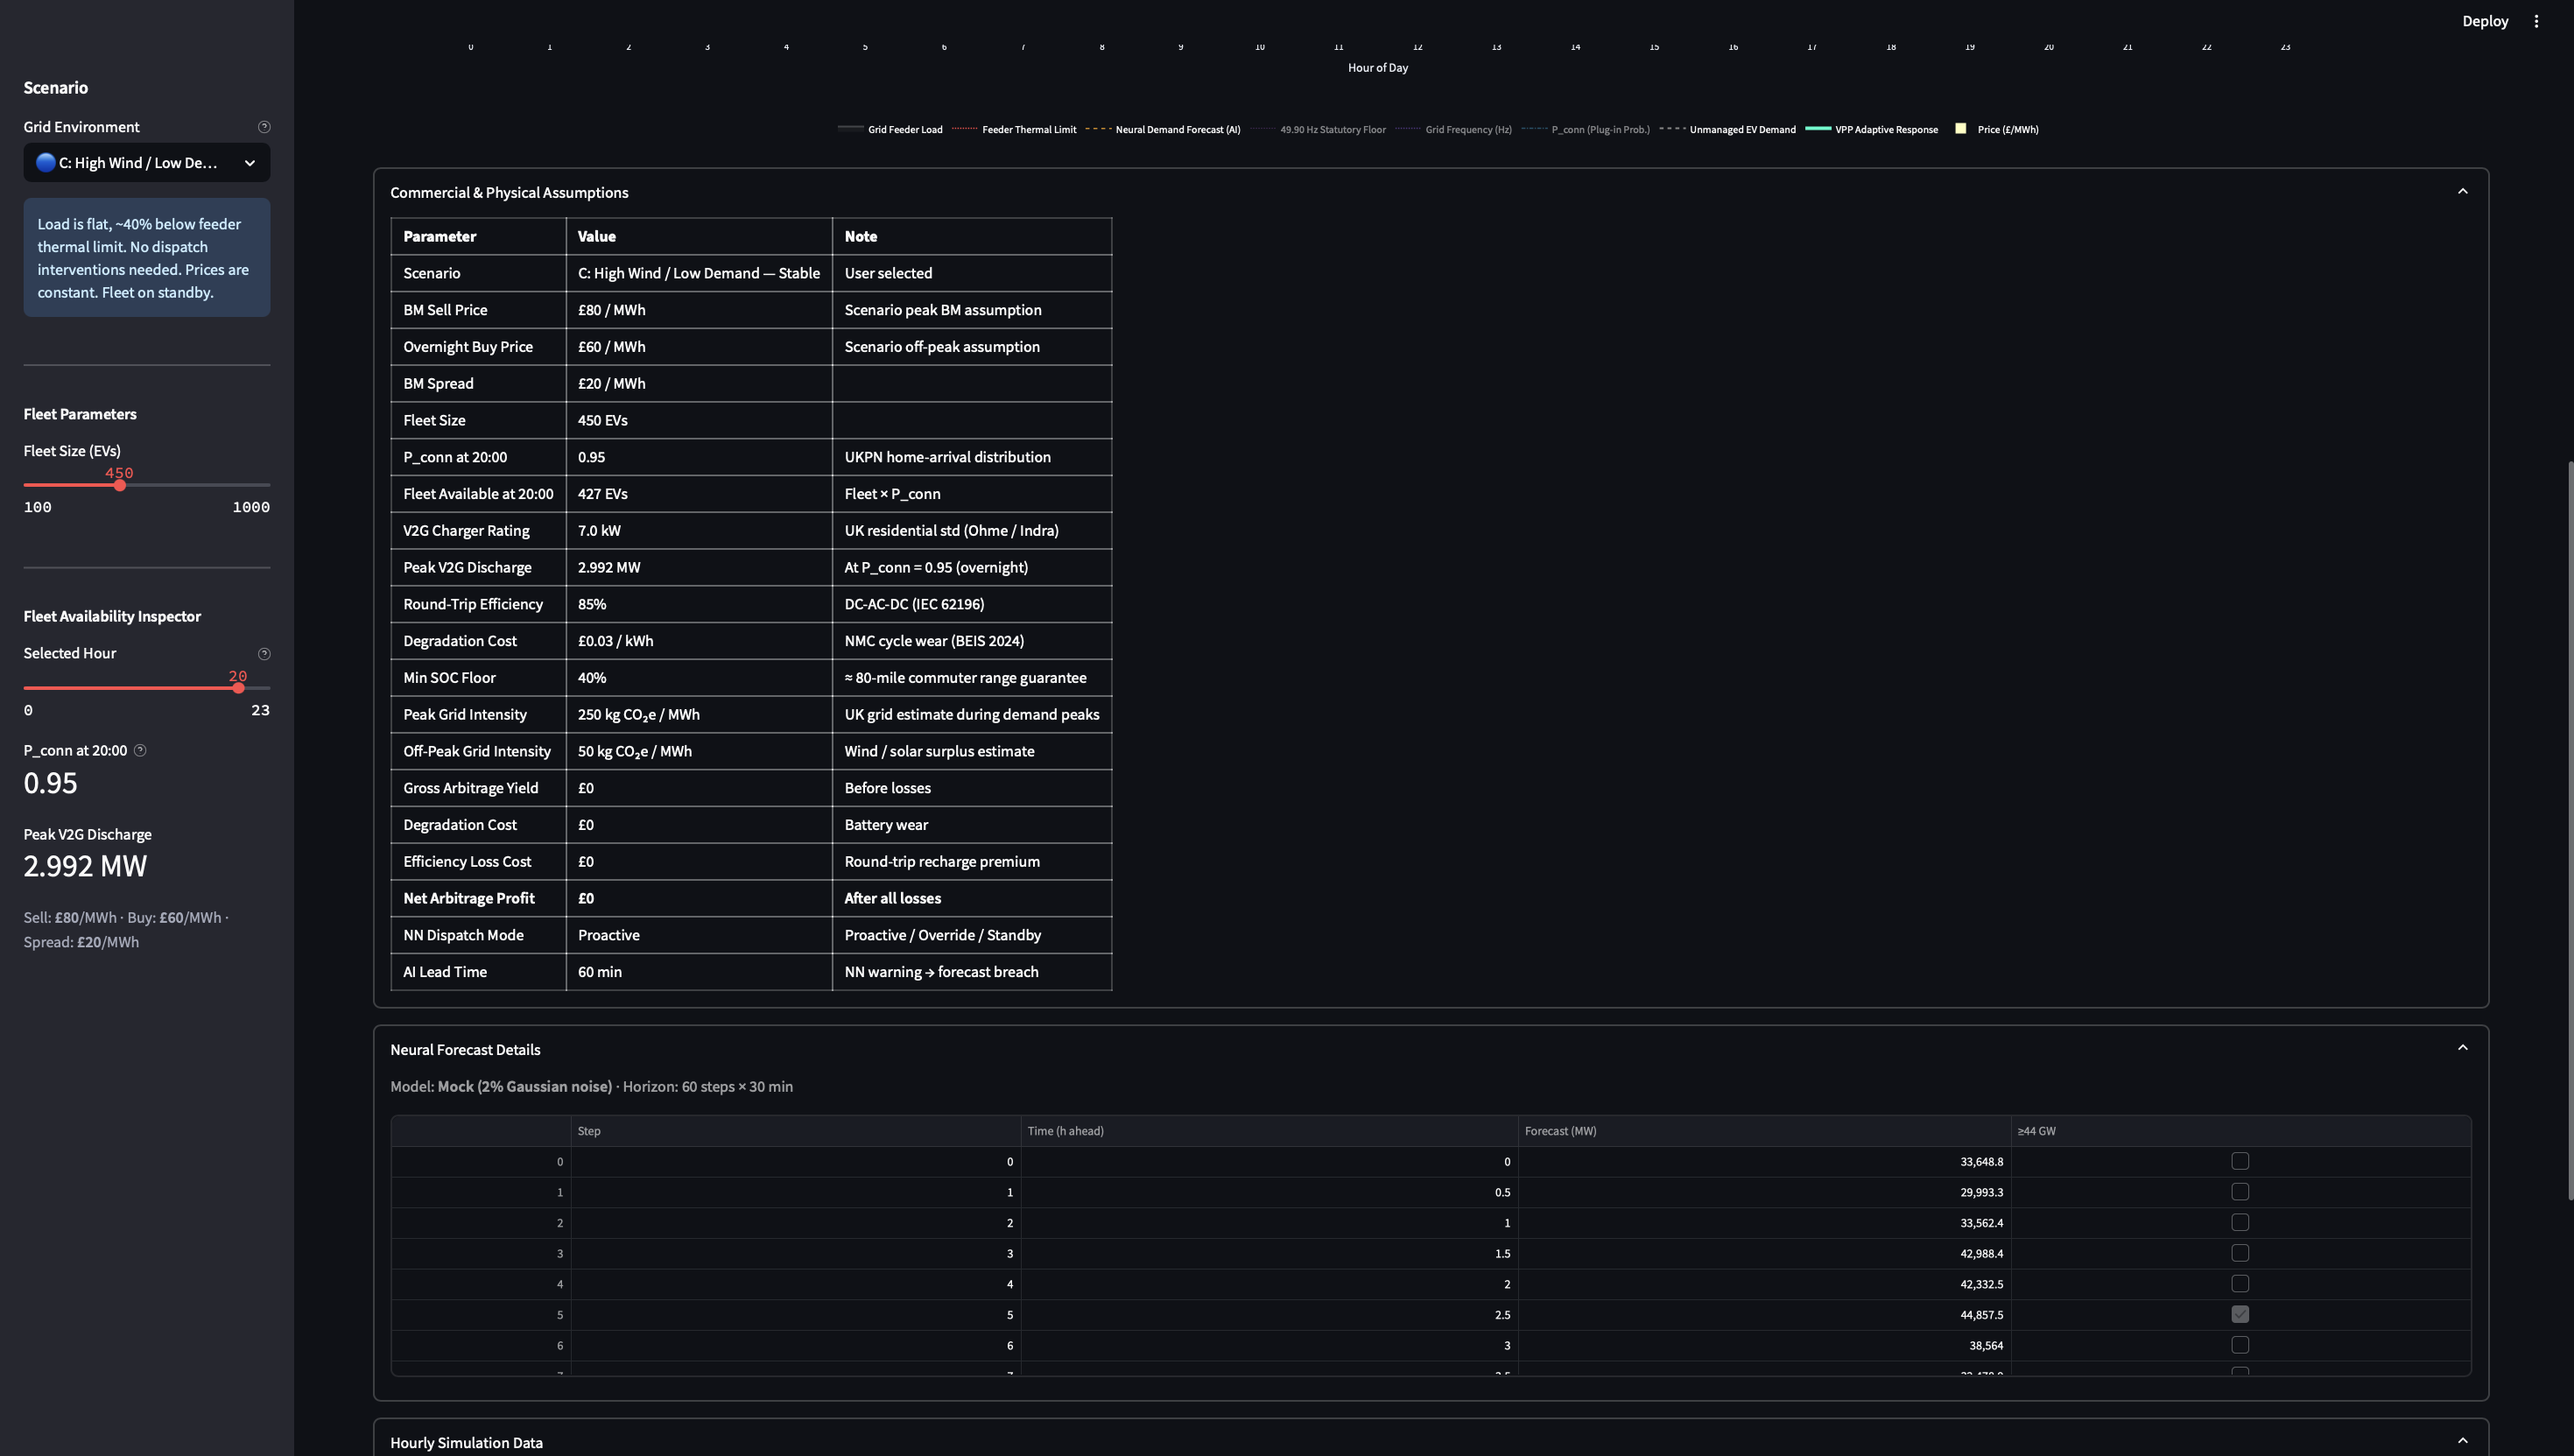
- η = 0.85 — DC-AC-DC round-trip efficiency (IEC 62196 residential charger standard)
- C_deg = £0.03/kWh — NMC cycle wear cost (BEIS 2024 estimate)
- p_sell — Balancing Mechanism sell price (up to £500/MWh in Scenario A)
- p_buy — overnight recharge price (as low as £5/MWh in Scenario B solar surplus)
The efficiency loss term isolates the round-trip premium explicitly:
$$\mathcal{L}{\eta} = \frac{E_d}{\eta} \cdot p{\text{buy}} - E_d \cdot p_{\text{buy}} = E_d \cdot p_{\text{buy}} \cdot \left(\frac{1}{\eta} - 1\right)$$
Post-discharge recharge is distributed across off-peak hours via a water-filling algorithm — raising the lowest-load hours uniformly until the energy deficit is absorbed, guaranteeing the managed peak never exceeds the unmanaged baseline.
How We Built It
- Model training — PyTorch DLinear trained on a cleaned Parquet dataset of 19 UKPN grid signals at 30-minute resolution, fetched live from GitHub at runtime
- Inference pipeline —
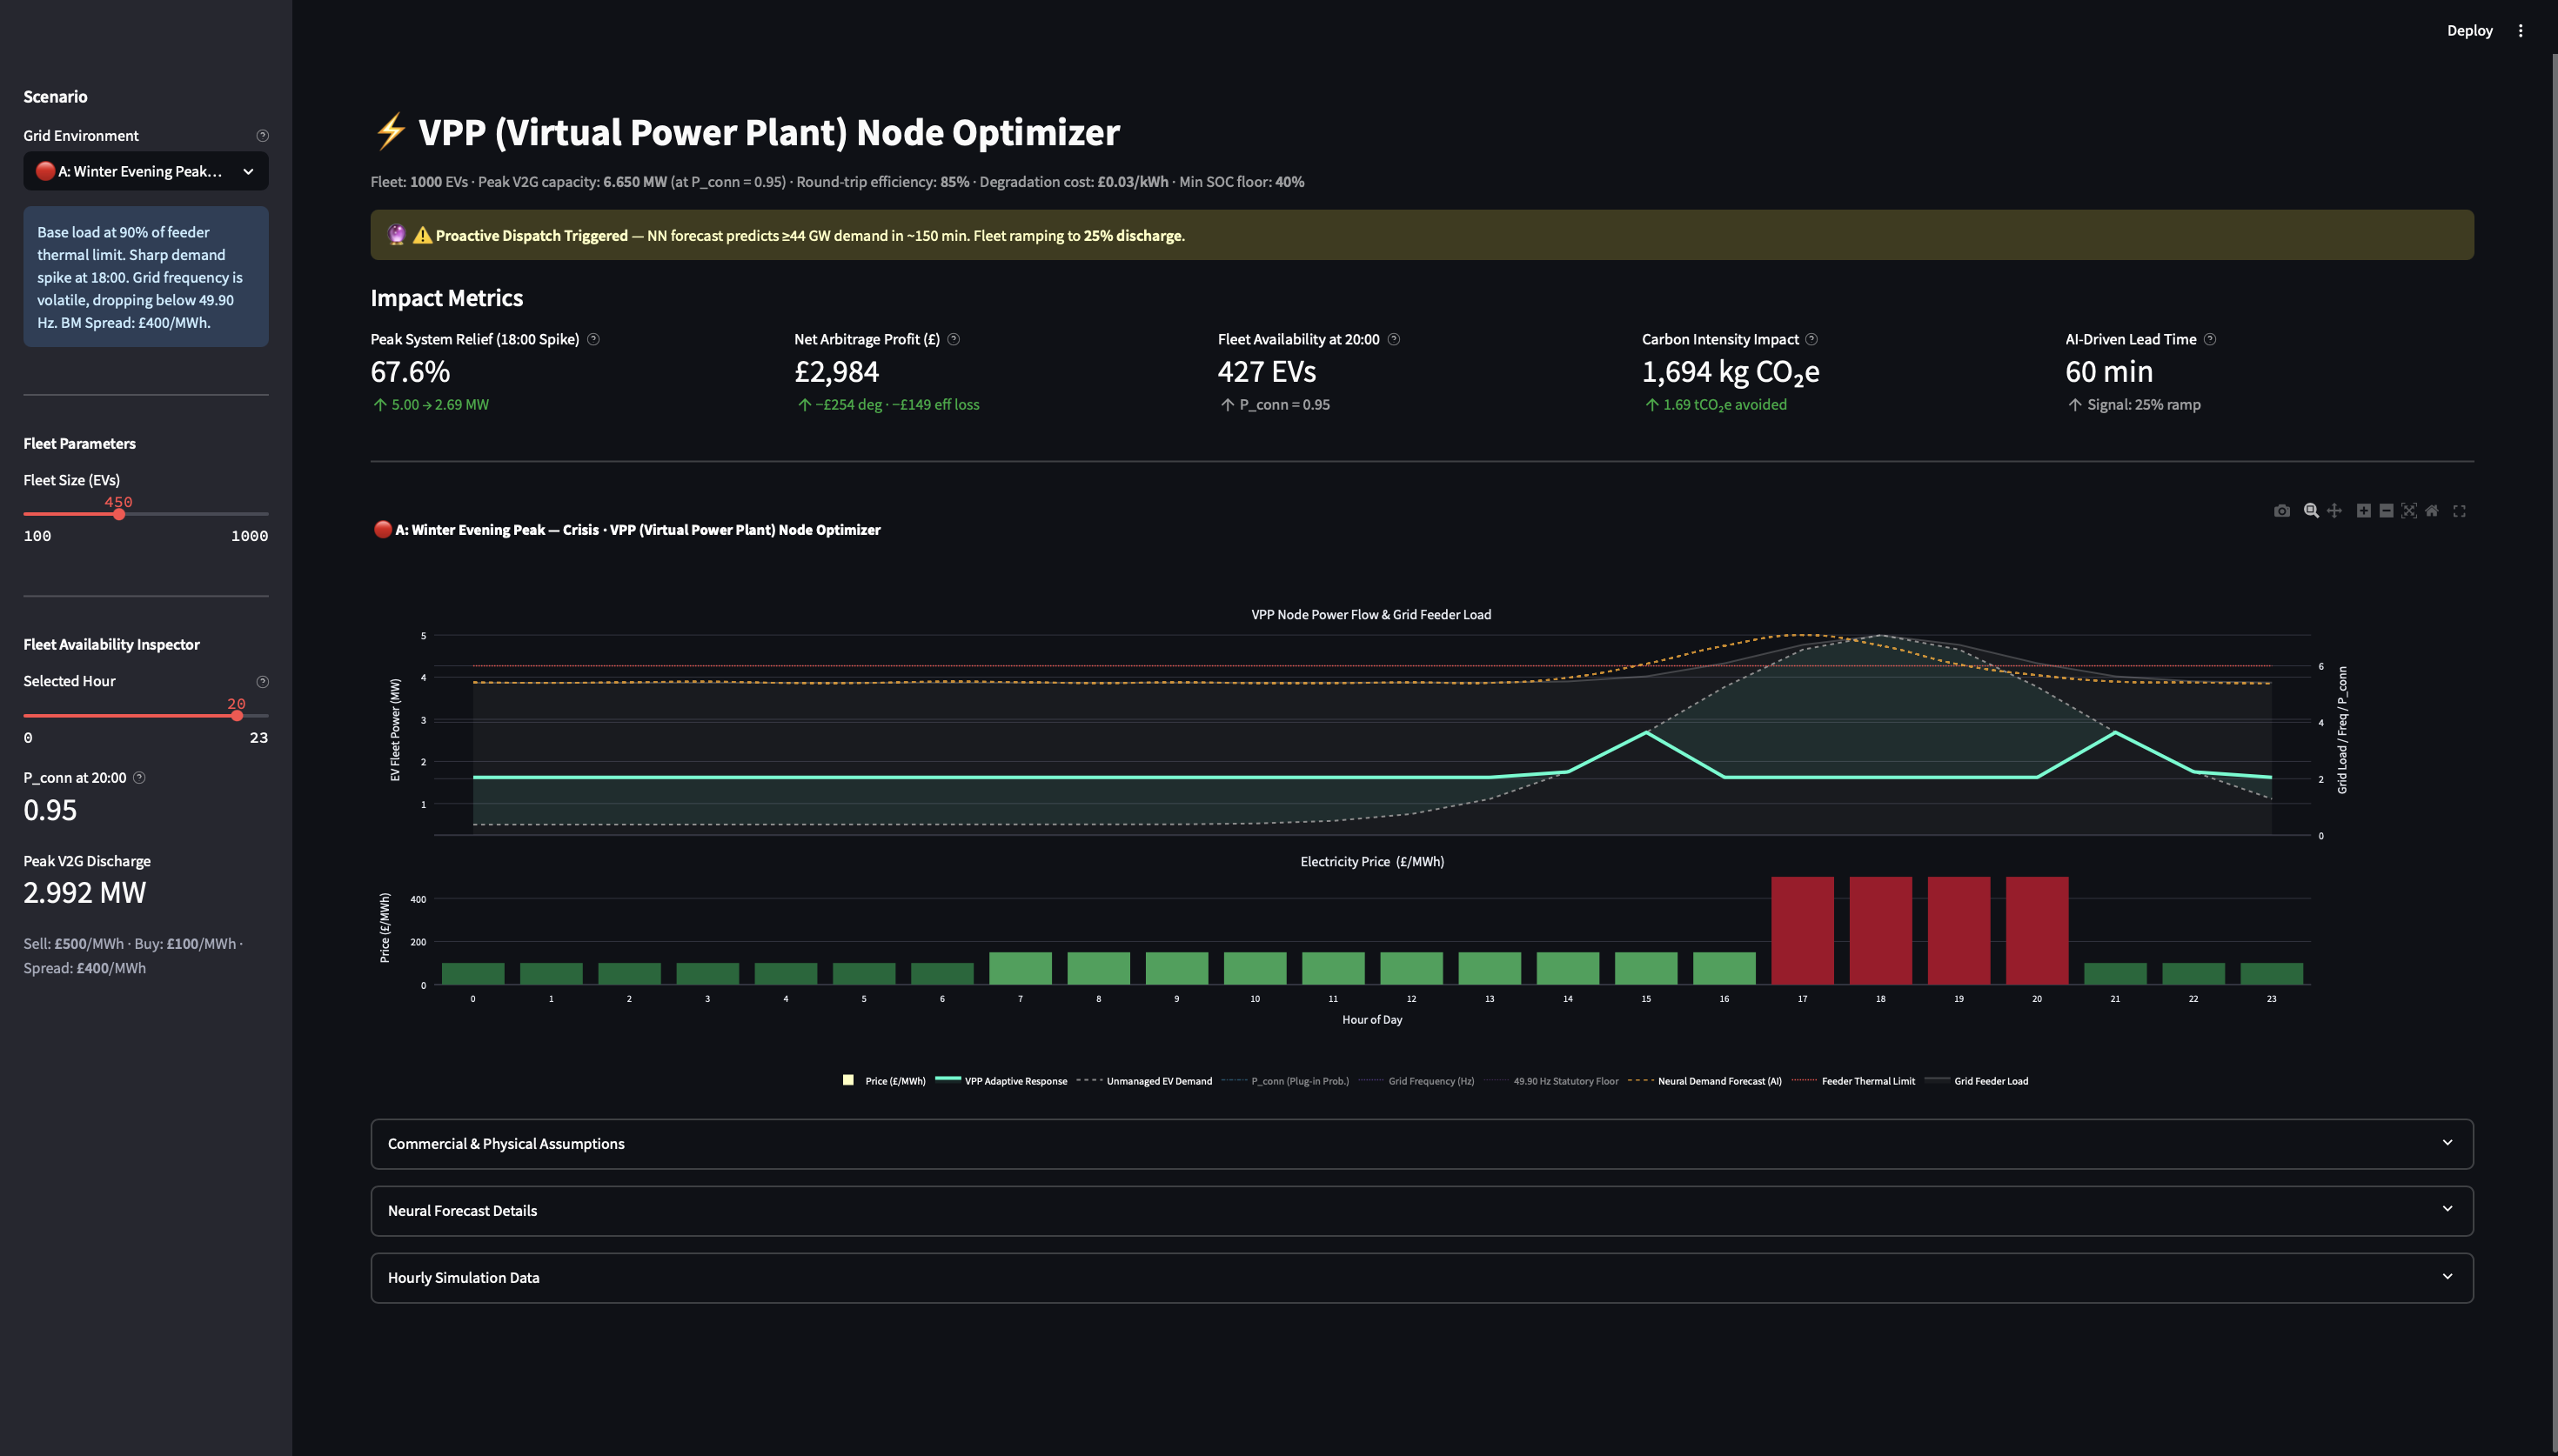
StandardScalerfitted on the full dataset; last 60 half-hour steps fed as a windowed input; cumulative-sum level reconstruction from predicted deltas; inverse-transform back to MW - Dashboard — Streamlit + Plotly with dual Y-axes, a scenario switcher, real-time dispatch banners, and a 5-column KPI panel covering peak relief, arbitrage profit, carbon impact, fleet availability, and AI lead time
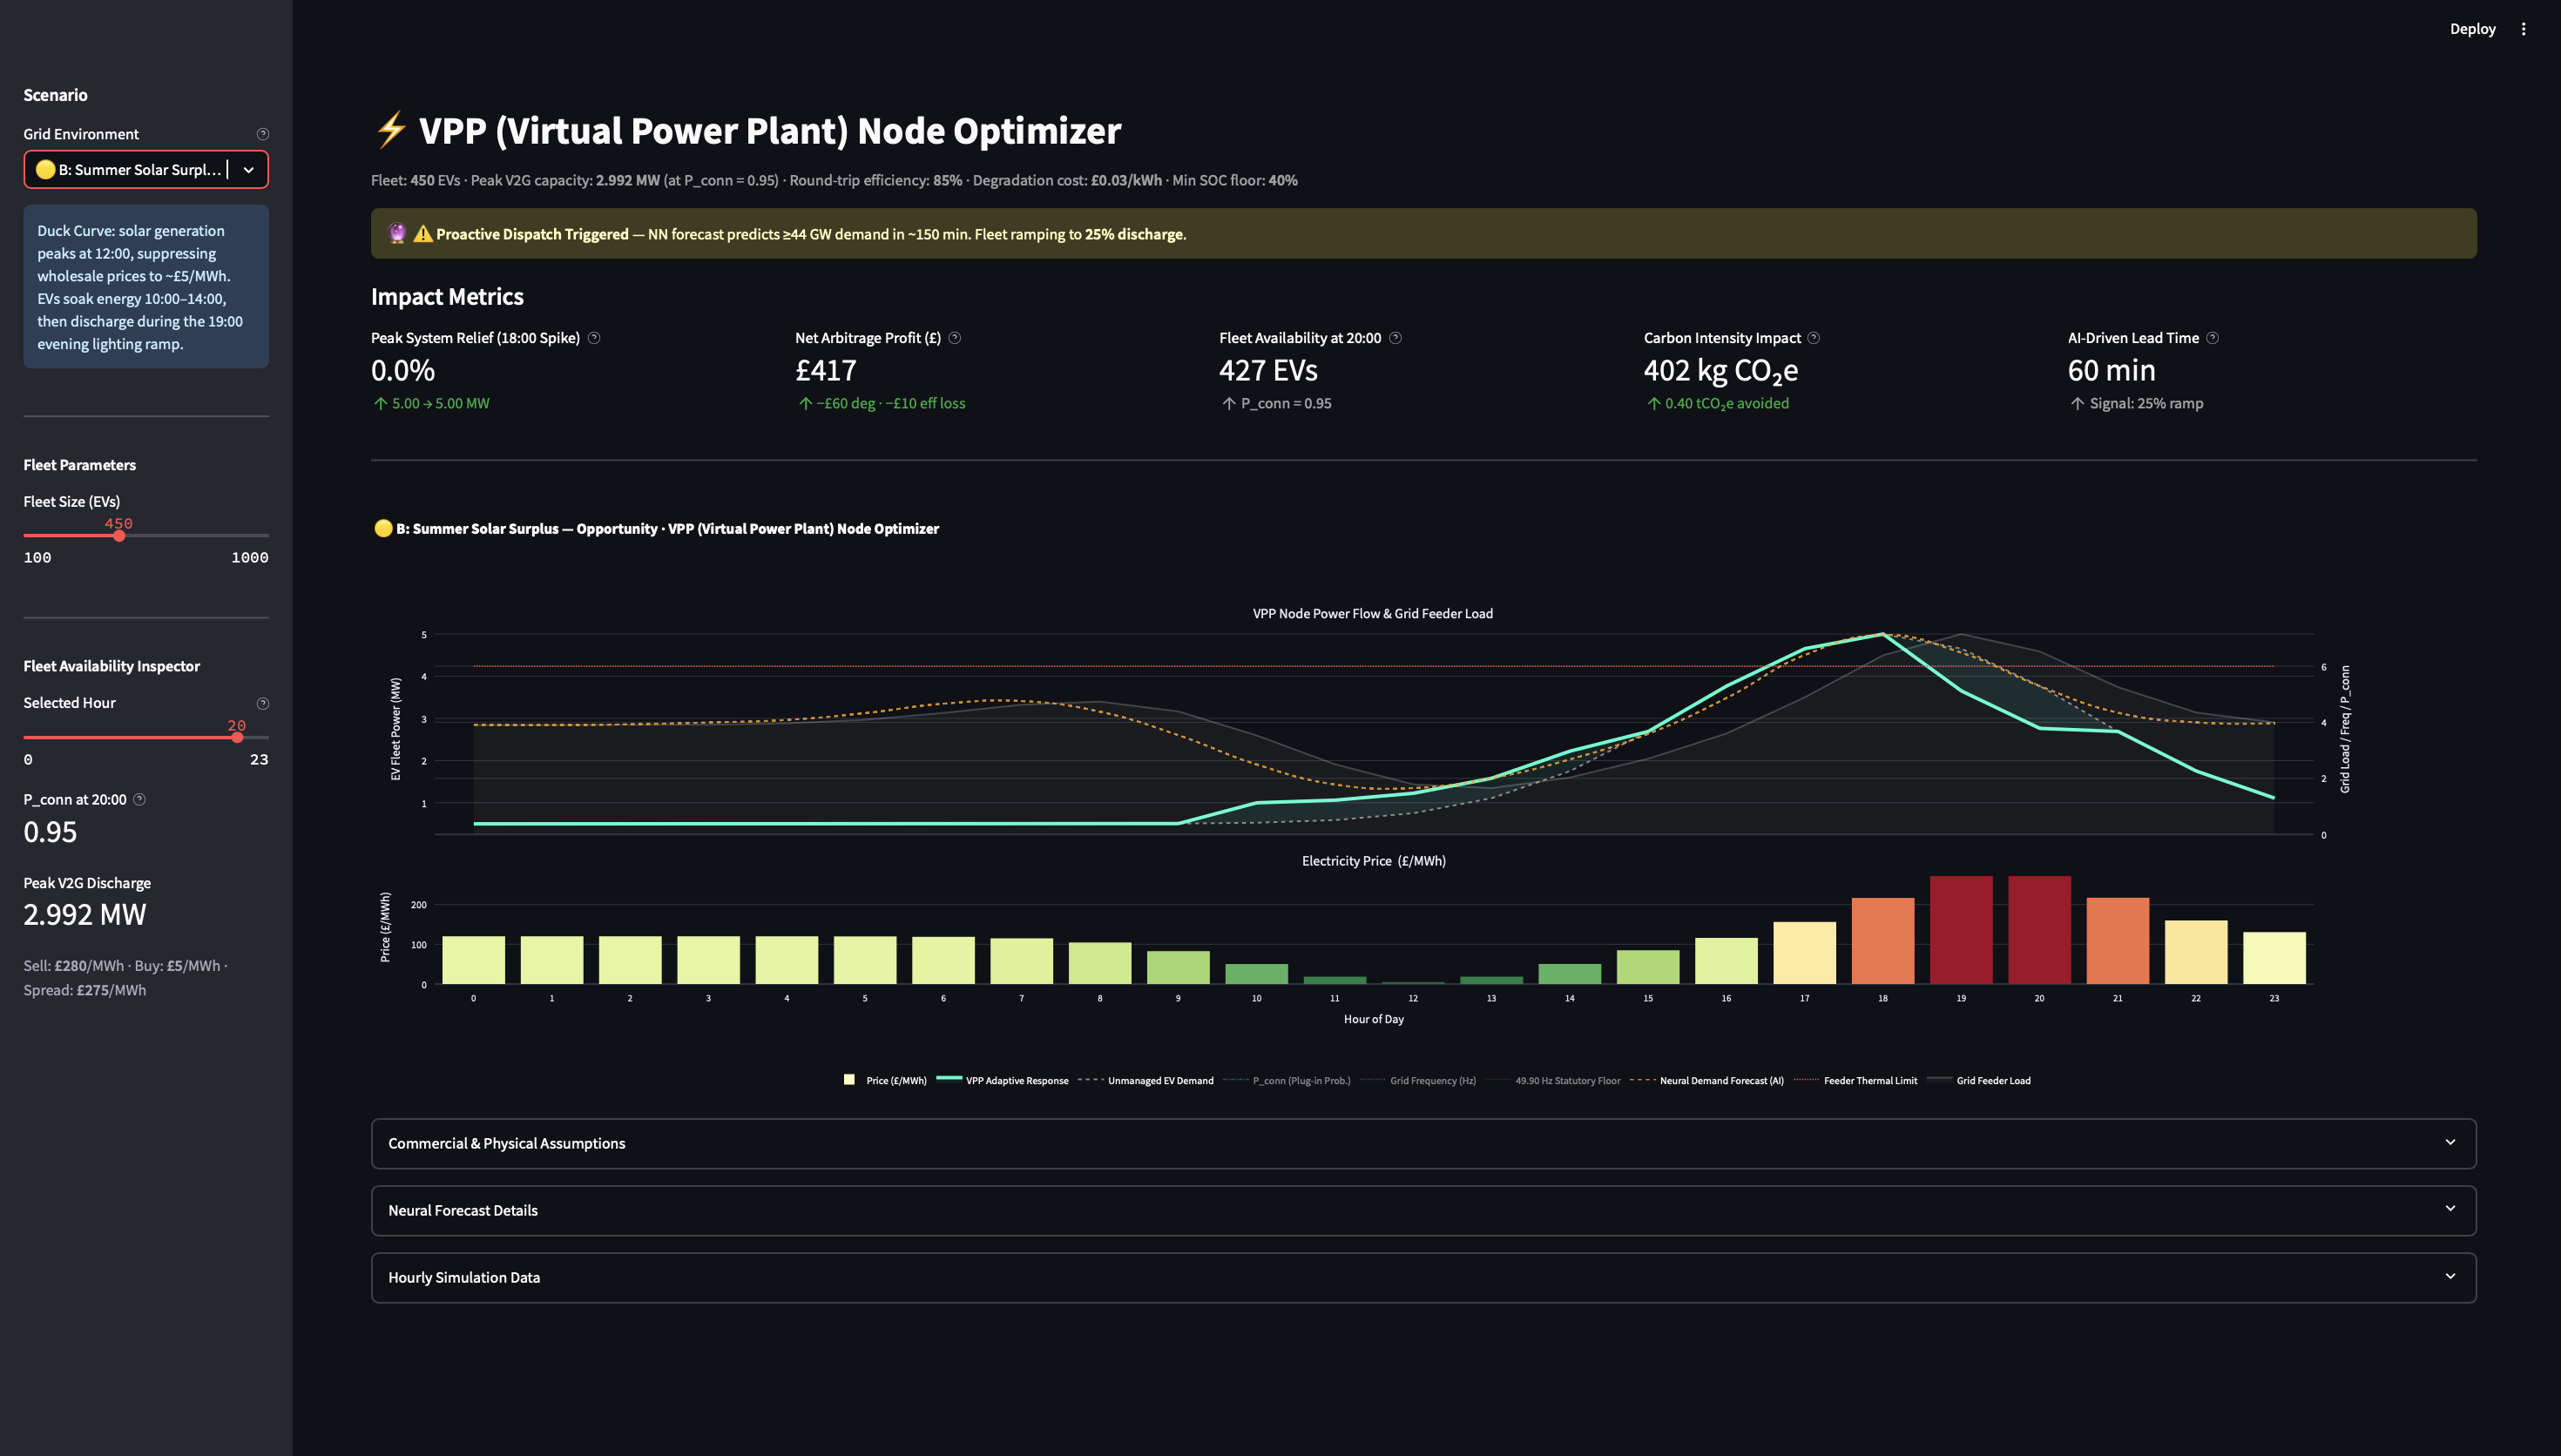
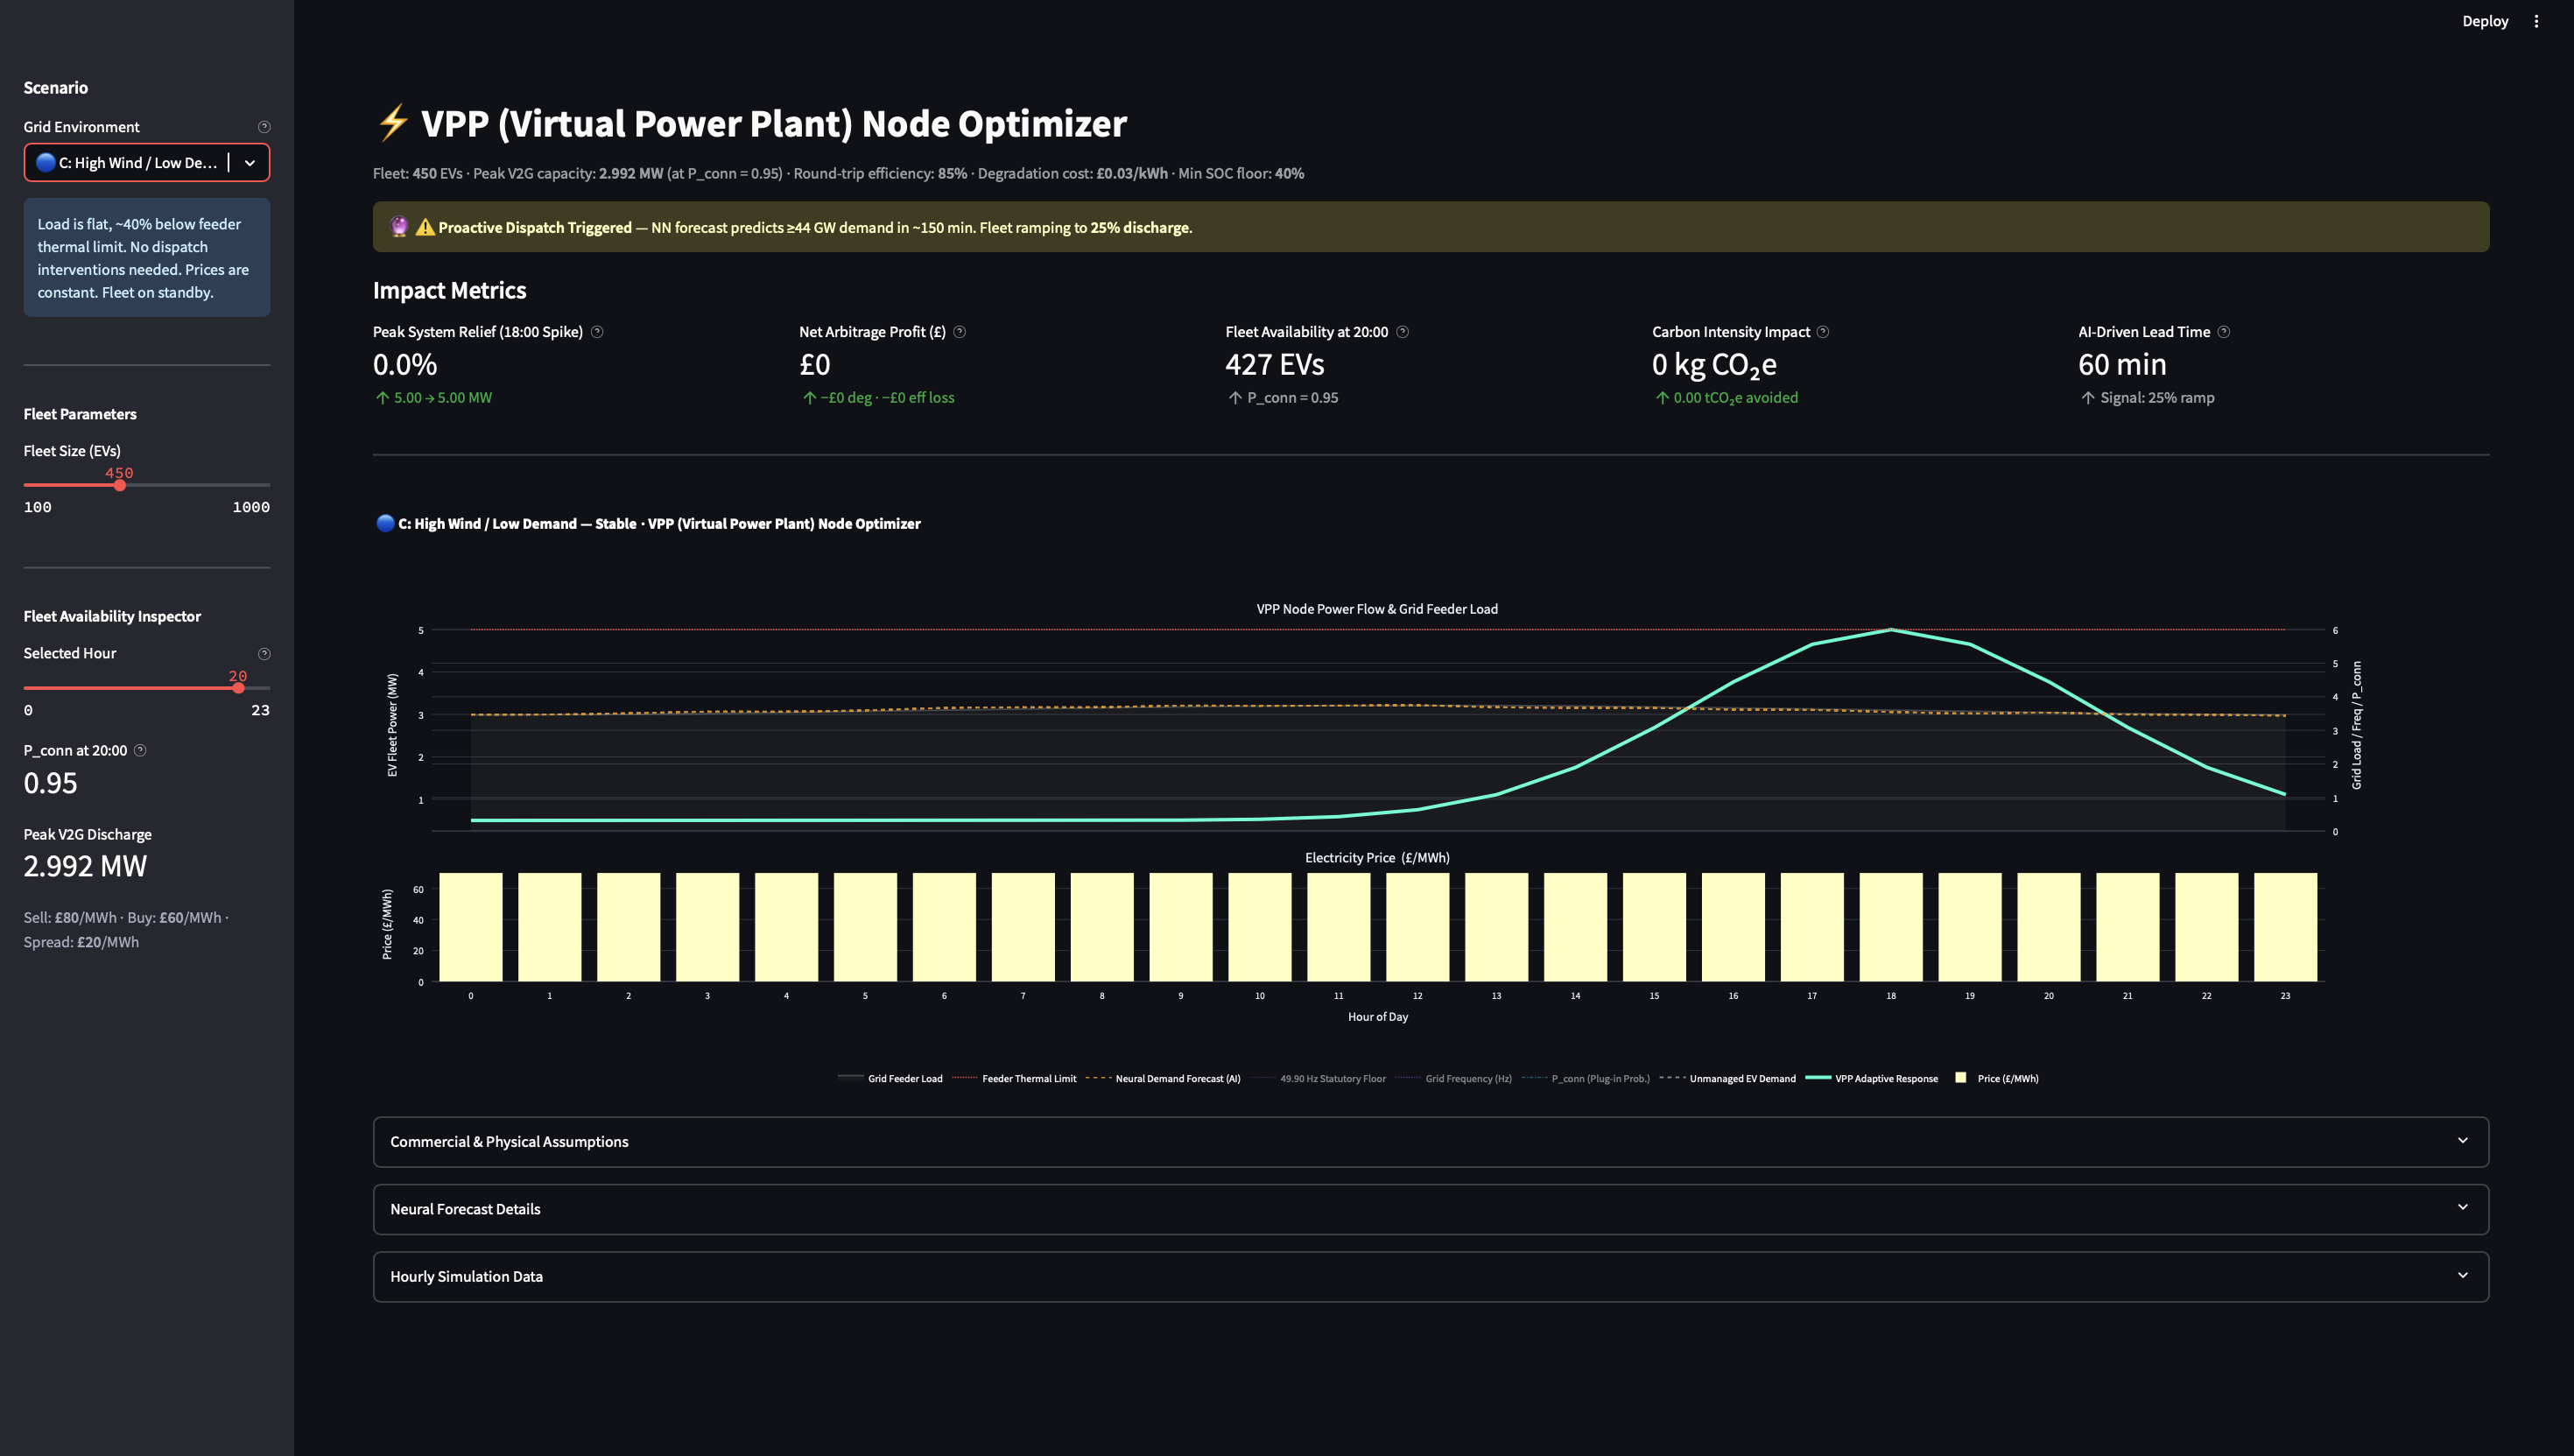
- Three stress scenarios — Winter Crisis (BM spread £400/MWh), Summer Duck Curve (solar suppression then evening ramp), and High-Wind Stable (fleet on standby)
Challenges
1. The Scale Mismatch Problem. The neural network operates at national scale (~44 GW) while the substation chart lives at ~6 MW — a factor of 7,300×. Rendering the forecast line visually credibly on the same axes required a deliberate design decision: derive the "Predictive Shadow" directly from the feeder load curve shifted 60 minutes left via np.roll, rather than attempting to scale raw national output down to substation resolution.
2. Real-Time Data Reliability. The live Parquet fetch fails silently under hackathon network conditions. Every inference path needed a graceful fallback that produced a realistic shaped signal — not a flat line — so the dispatch logic and UI stayed coherent throughout the demo regardless of connectivity.
3. Water-Filling Correctness. The rebound recharge algorithm had to guarantee that the optimized peak never exceeds the unmanaged baseline — otherwise V2G looks worse than doing nothing. Proving the invariant and implementing it as a level-sorted water-fill took more whiteboard time than the model training itself.
What We Learned
The most surprising insight: the forecasting problem is almost secondary. The hard part is building the real-time control layer that turns a prediction into a credible, financially-grounded dispatch signal — one that respects physical constraints, communicates uncertainty to the operator, and degrades gracefully when the model is wrong.
That is the gap between research and production. And it is where the real engineering lives.

Log in or sign up for Devpost to join the conversation.