-
-
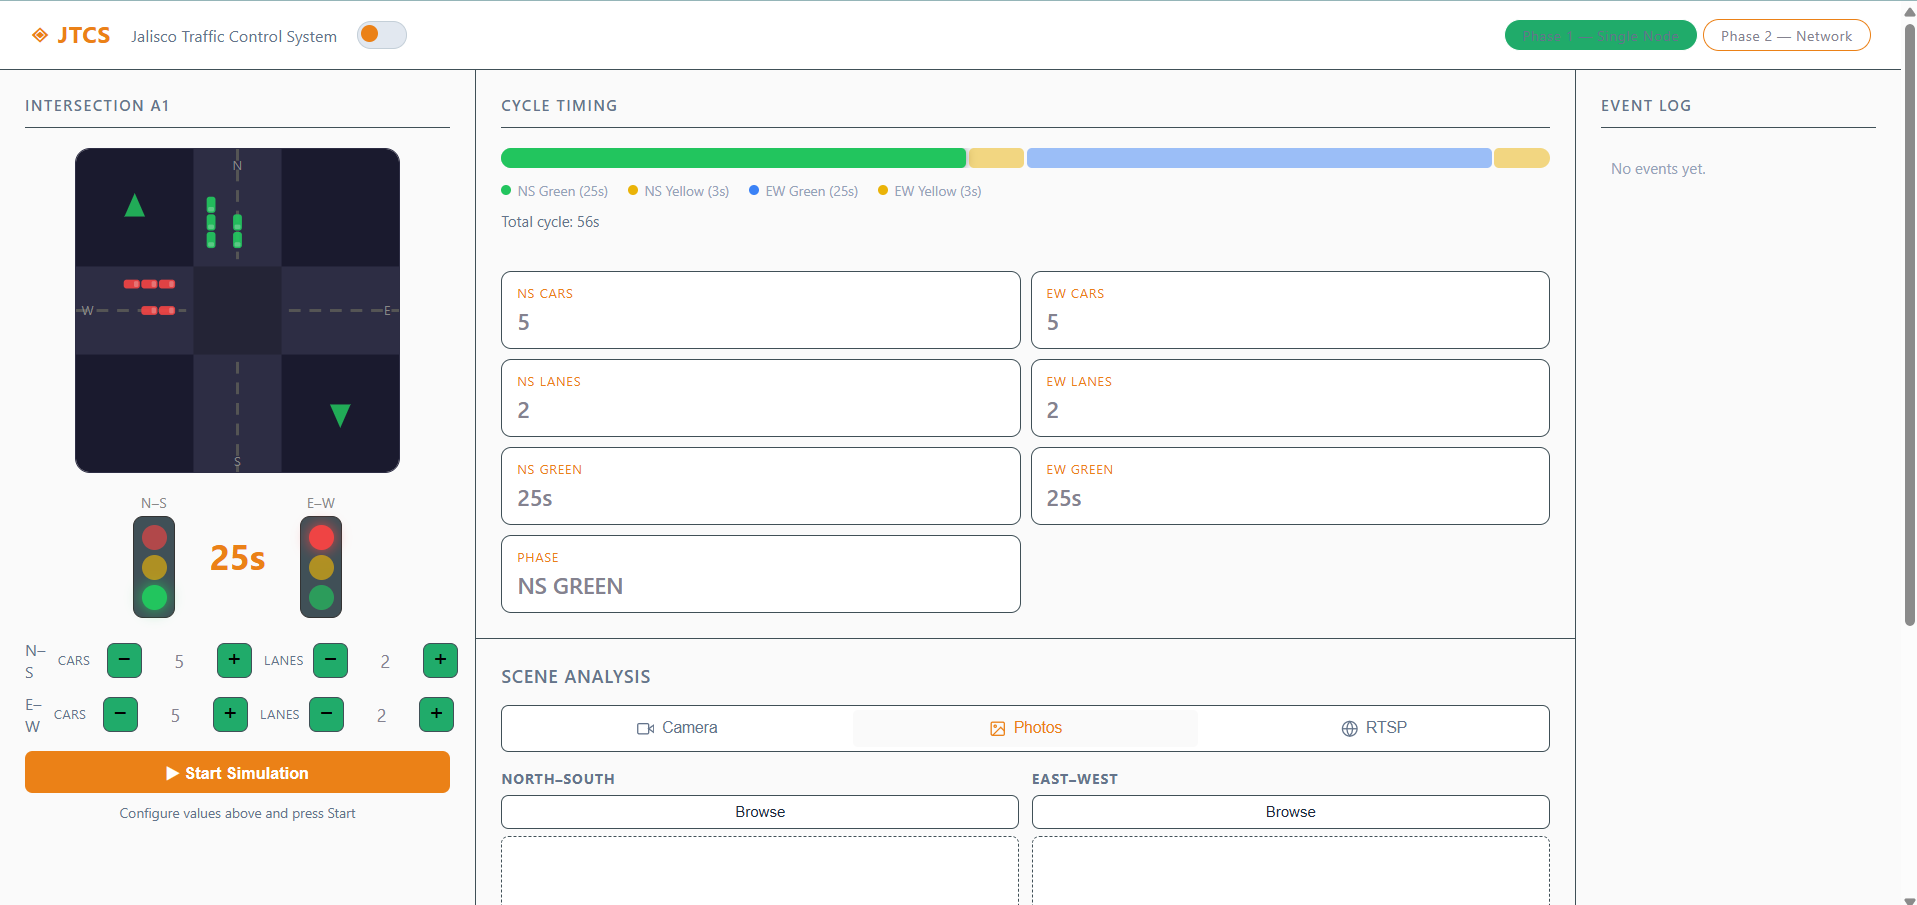
Phase One - Single Node
-

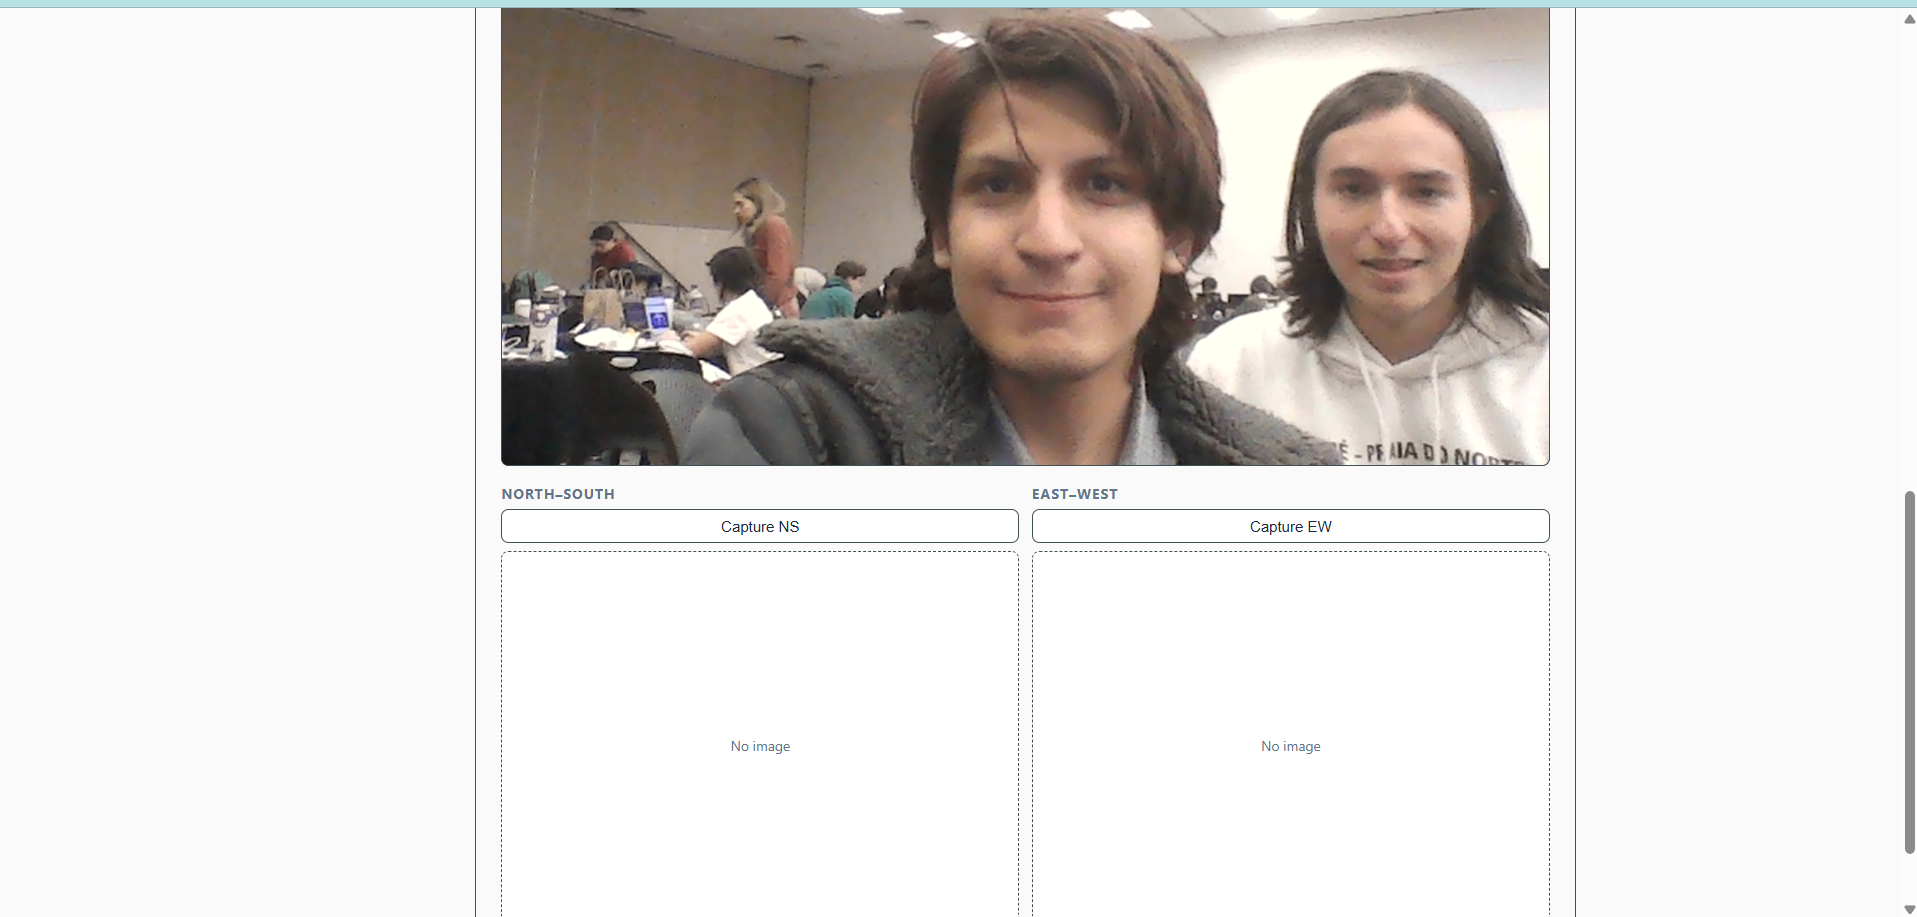
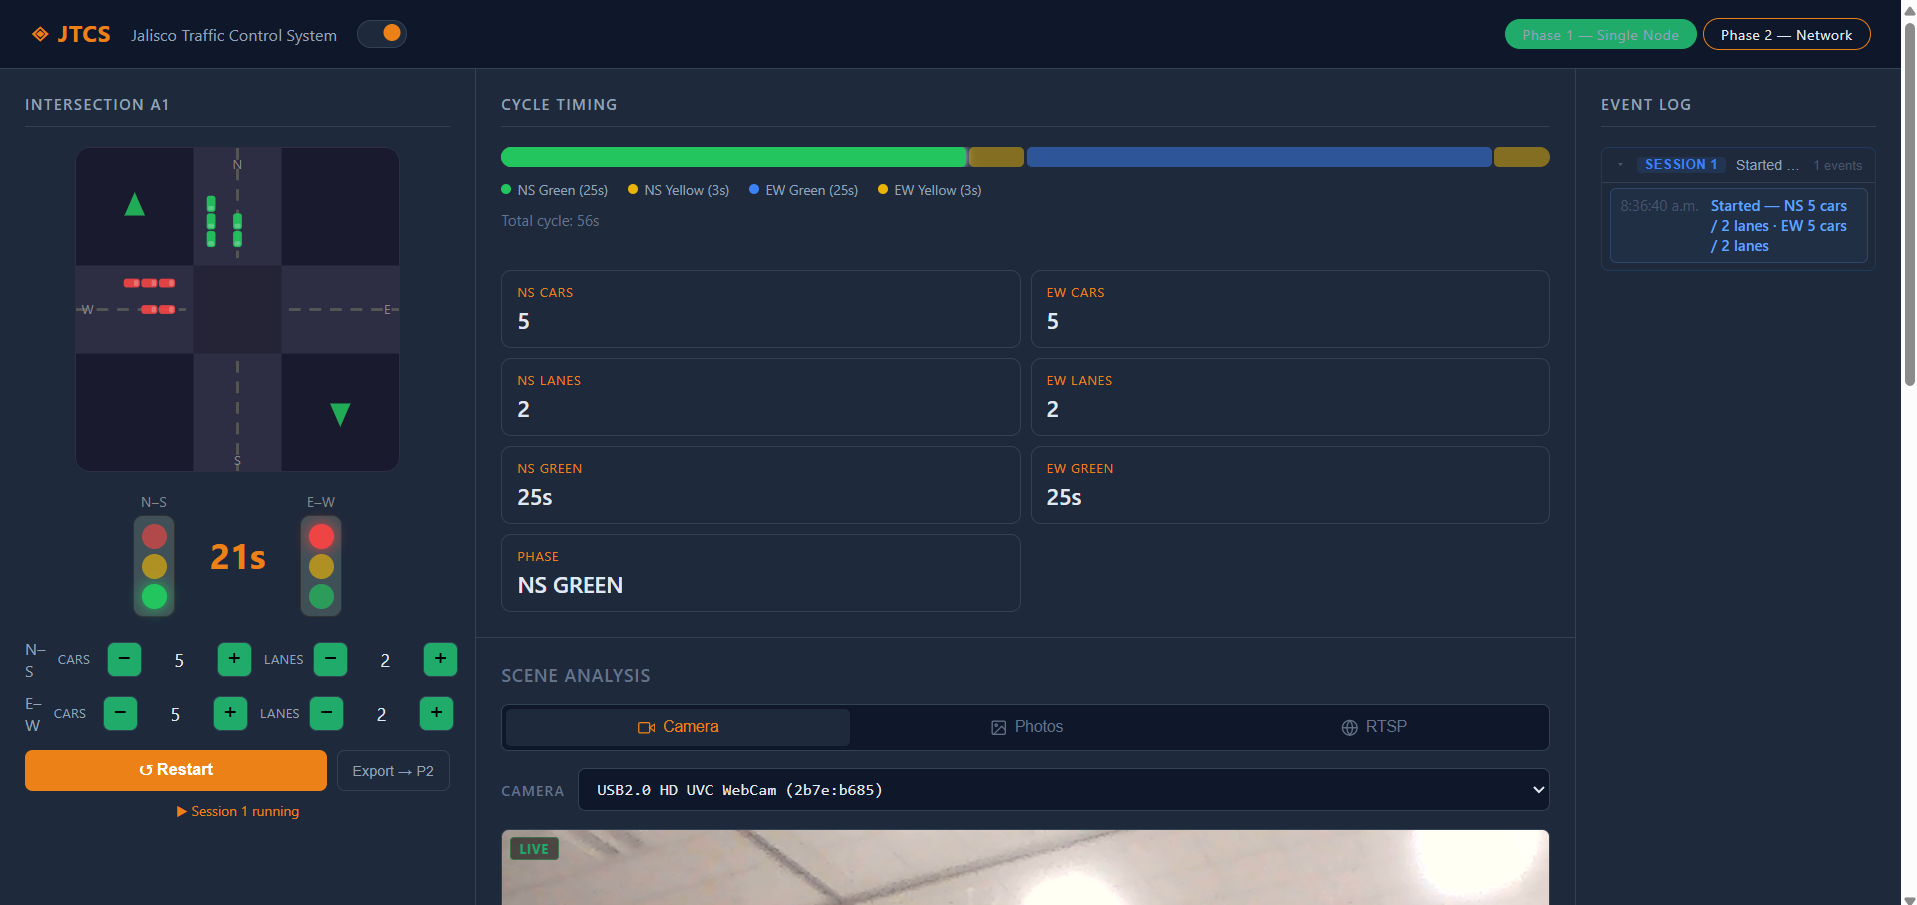
Single Node - Camera Showcase
-

Dark Mode Showcase
-
Phase Two - Network and Settings
-
Phase Two - AutoCity Showcase
-
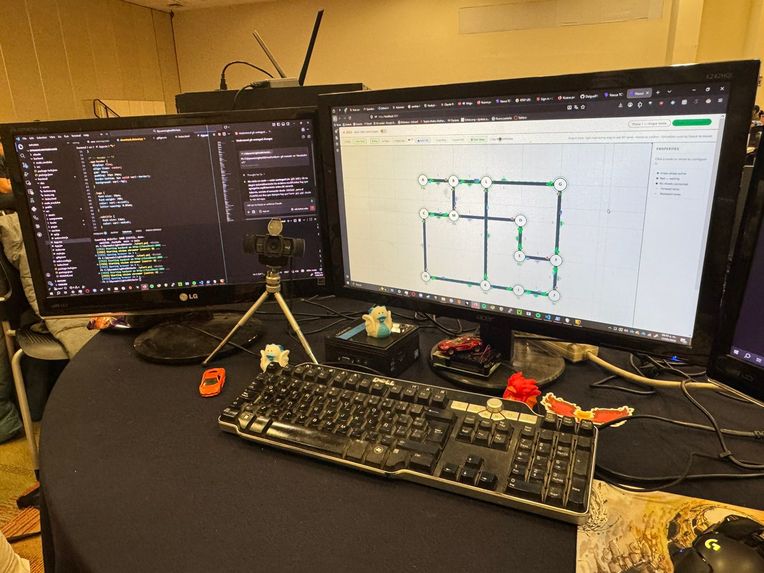
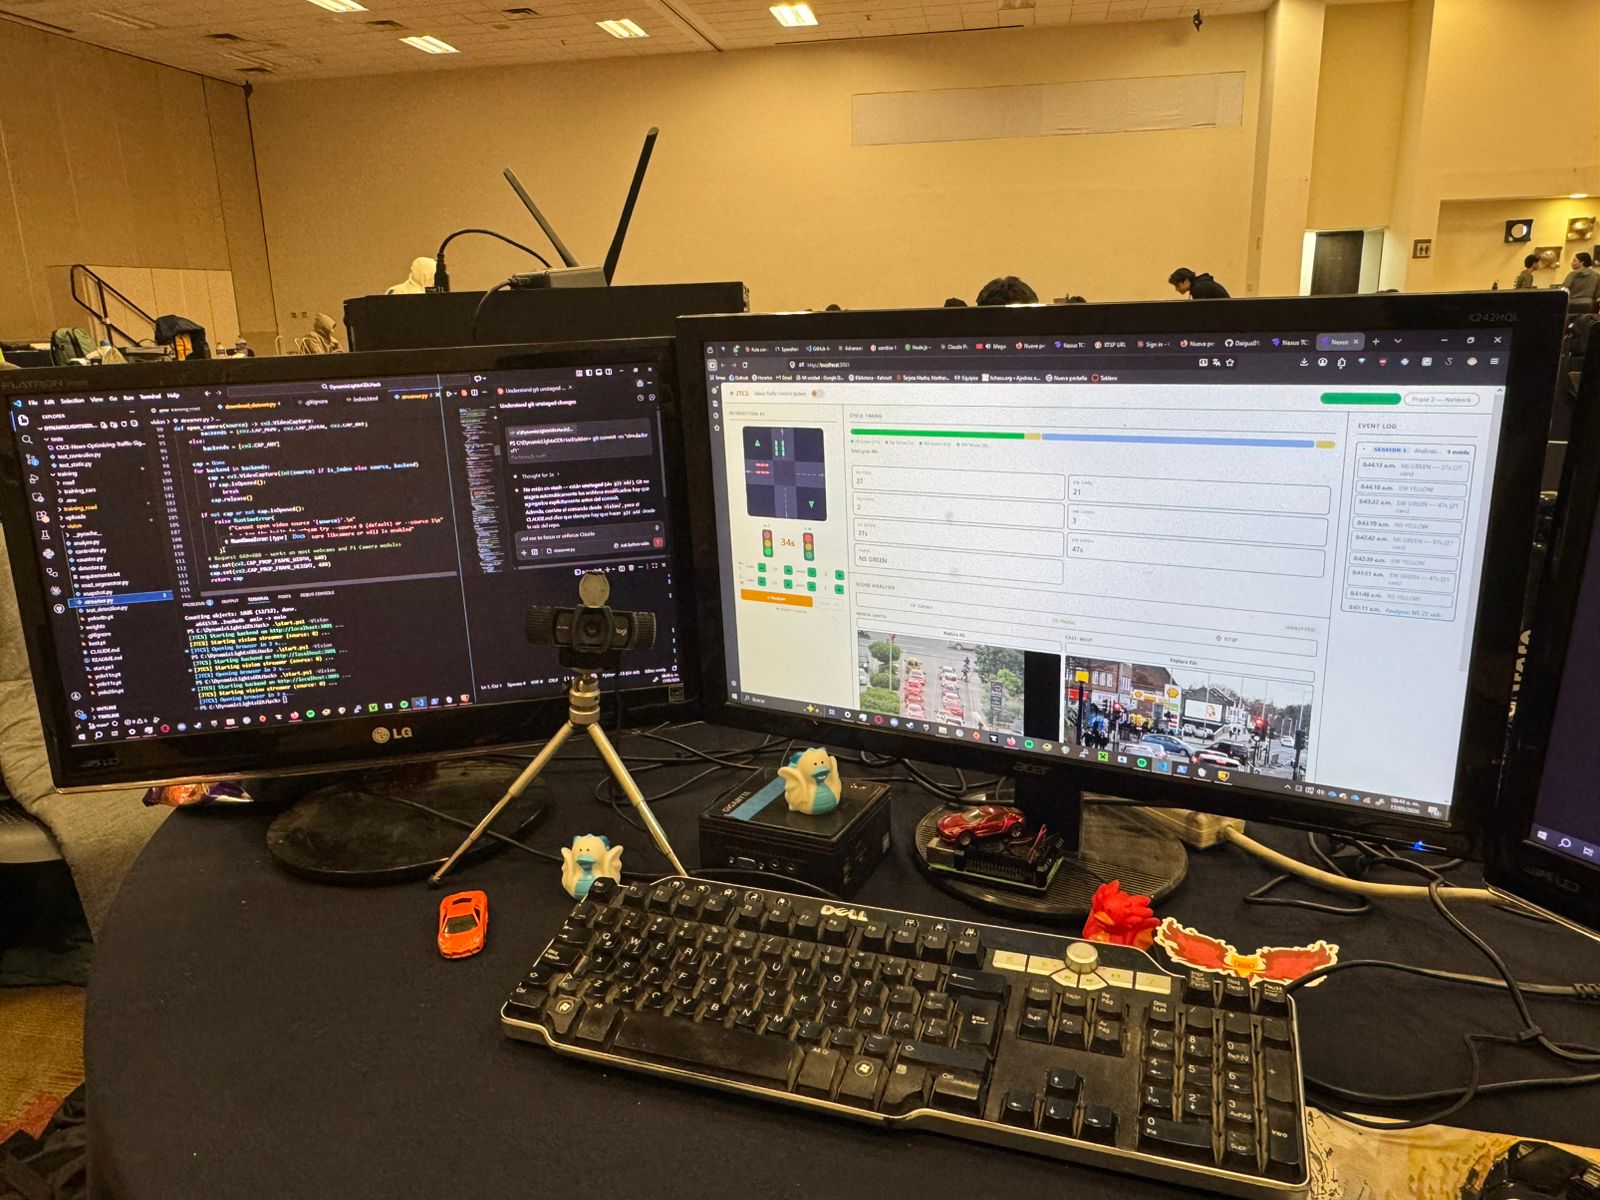
Live Showcase Phase One
-
Live Showcase Phase Two

Inspiration
We’ve all been there: sitting at a red light in Zapopan at 2:00 AM for two full minutes while absolutely zero cars cross the other way. Jalisco's urban gridlock is often exacerbated by "dumb," fixed-time traffic lights that force drivers to idle at empty intersections. This frustration inspired JTCS. For Guadalahacks 2026, we wanted to build a system that sees the road like a human does, curing artificial congestion by replacing rigid timers with an intelligent, demand-adaptive signal network.
What it does
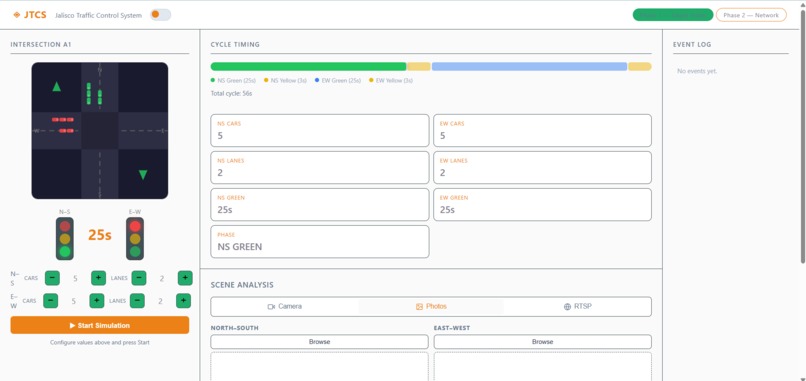
JTCS (Jalisco Traffic Control System) is an edge-AI traffic management platform that allocates green-light time proportionally to real-time vehicle demand. It operates in two core phases:
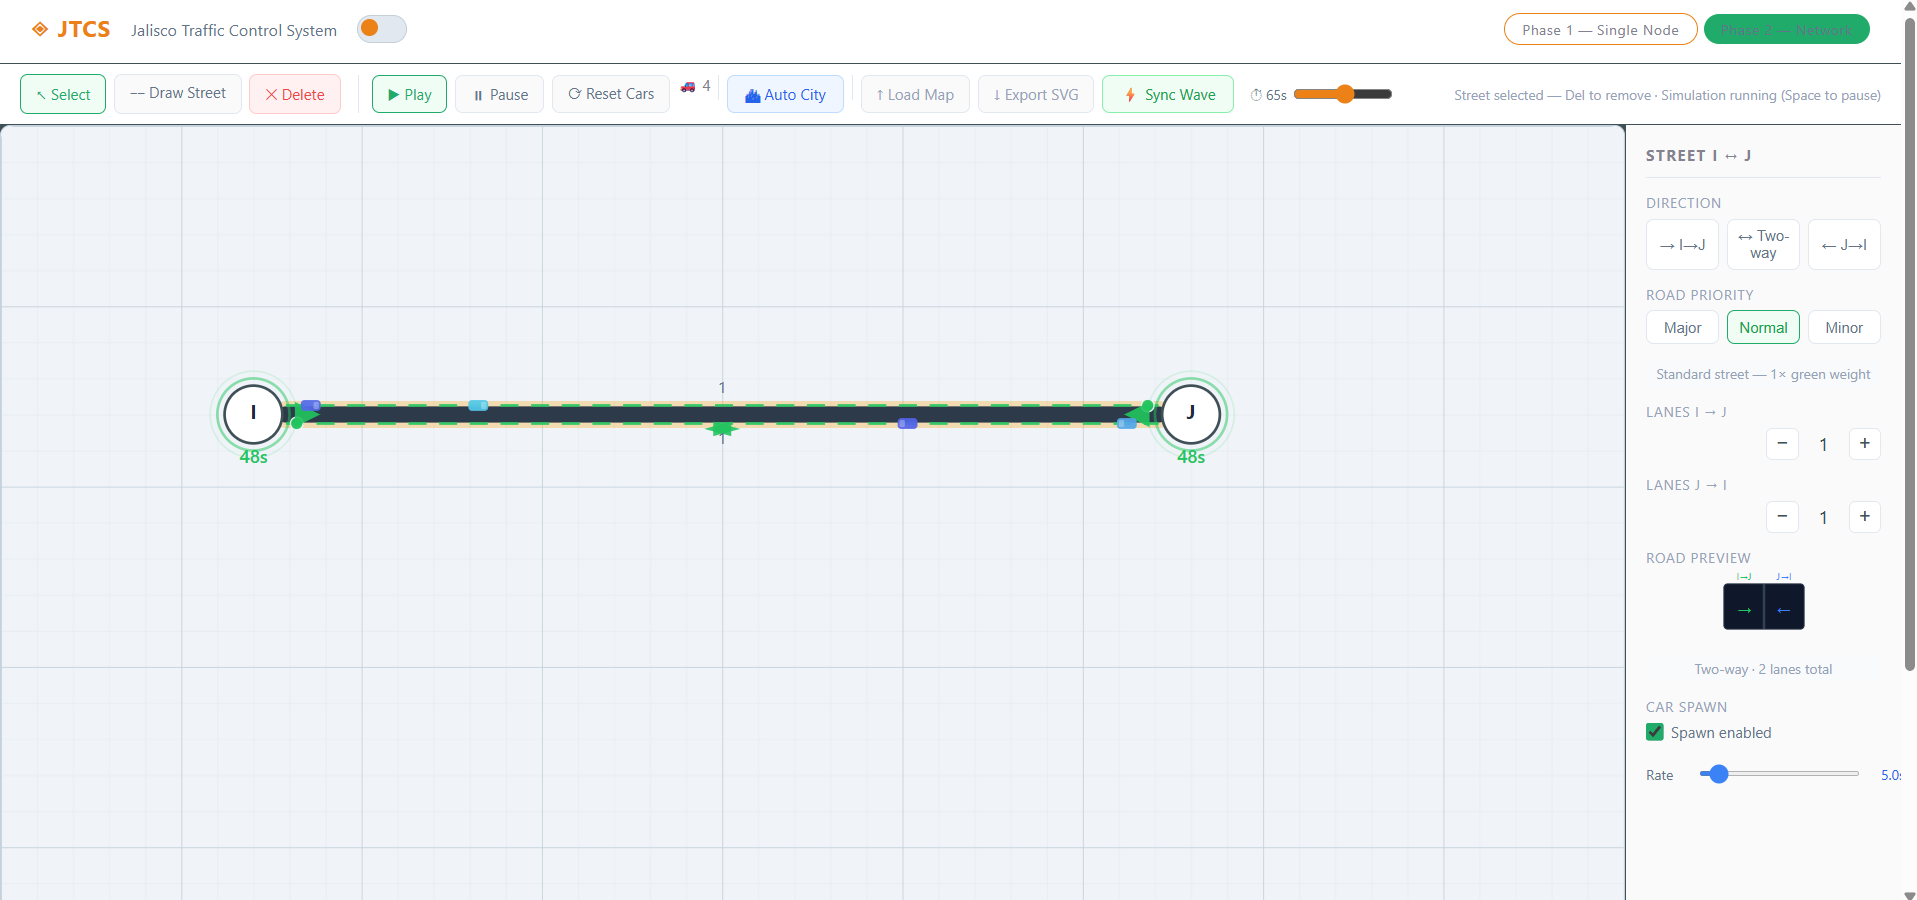
- Phase 1 (Single Intersection): A YOLOv11 computer vision pipeline monitors live camera feeds to count vehicles per lane using configurable polygon zones. These counts drive a dynamic timing algorithm. Operators can view a live React dashboard showing phase states, countdowns, and a top-down SVG intersection view.
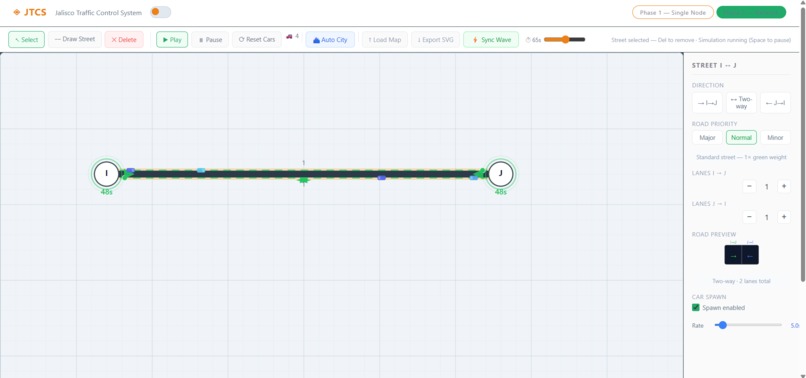
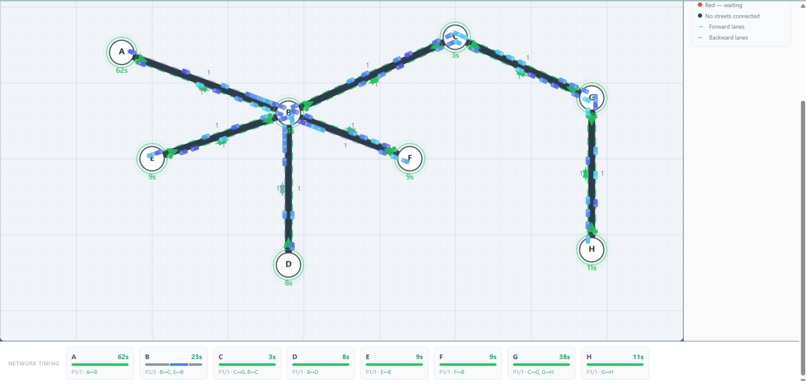
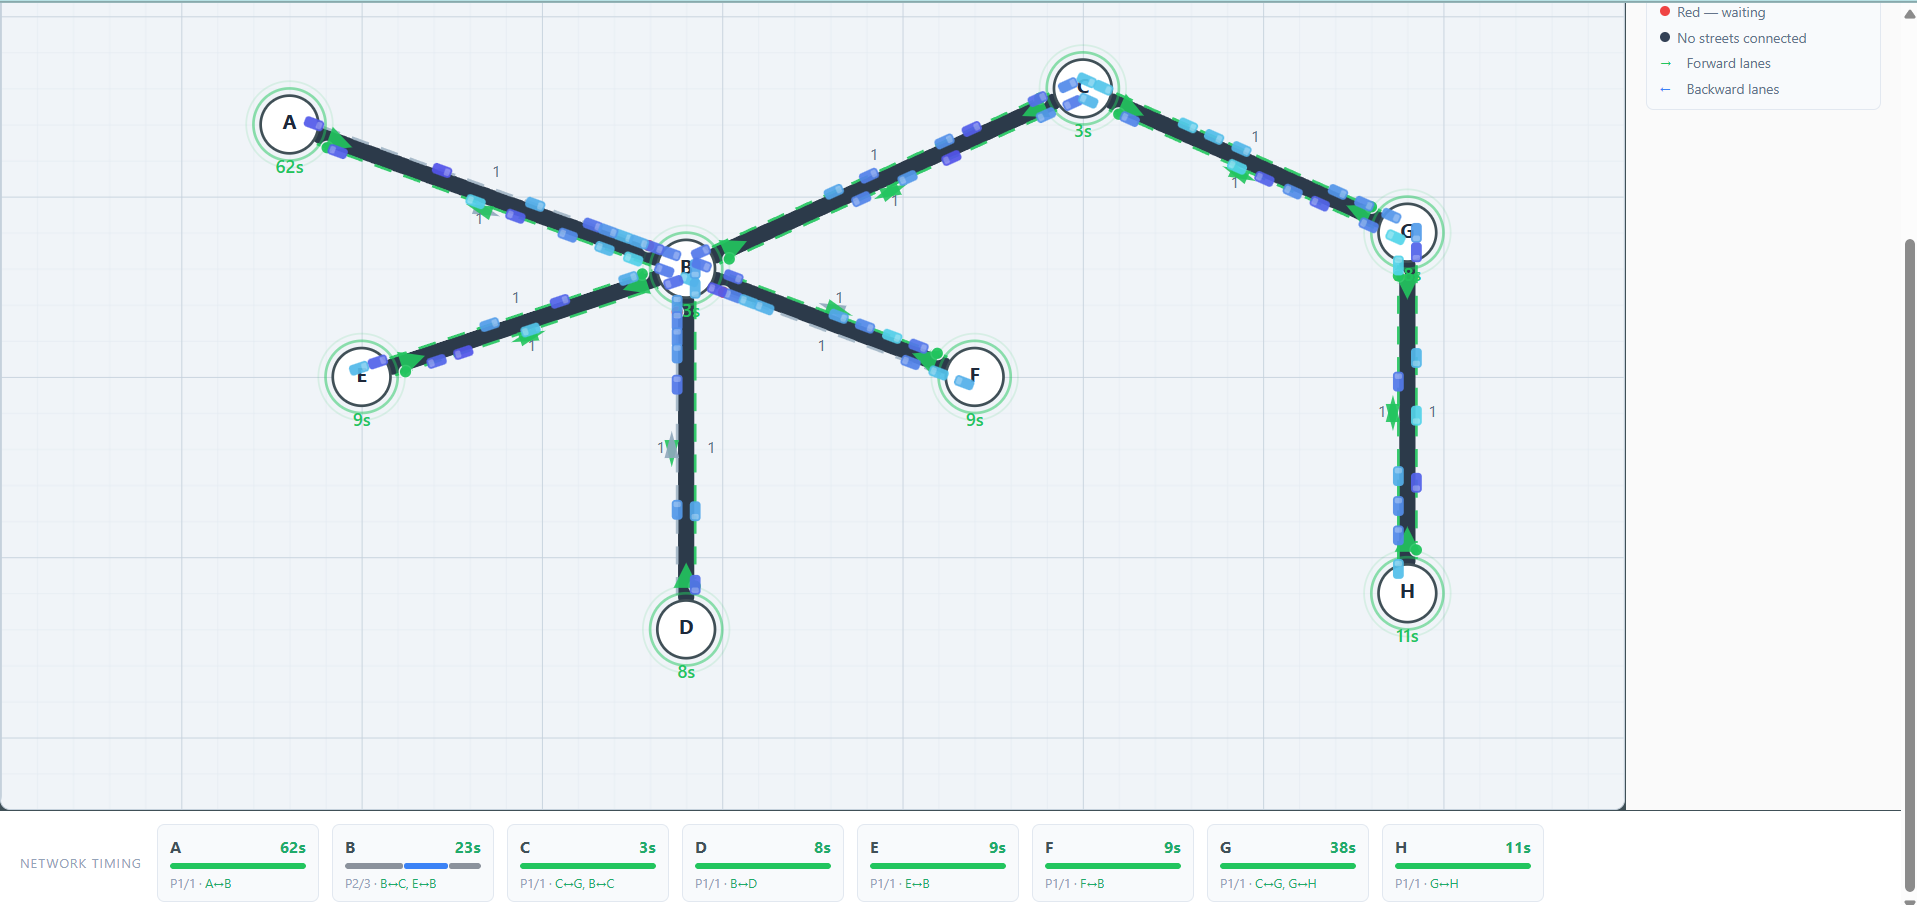
- Phase 2 (Road Network): A multi-intersection network editor that lets city planners draw custom road graphs. It features a microscopic car simulation engine and automatically computes "green wave" offset synchronization, ensuring cars traveling at the design speed hit consecutive green lights.
How we built it
We split the architecture into three decoupled layers:
- Vision Pipeline (Python): We fine-tuned two YOLOv11 models. The first (
yolo11n_traffic.pt) detects vehicles, and the second (yolo11n_road.pt) segments drivable road surfaces to automatically map lane polygon zones. - Backend (Node.js/Express): A 1-second tick state machine handles the Highway Capacity Manual (HCM) signal transitions, broadcasting updates to clients via WebSockets.
- Frontend (React 19/Vite): We built a highly interactive dashboard using inline SVGs for all charts, network maps, and microscopic simulations.
At the core of our backend is a demand-proportional timing model derived from Webster's optimal cycle formula:
$$C_{opt} = \frac{1.5 L + 5}{1 - Y}$$
where $L$ is the total lost time per cycle and $Y$ is the sum of critical volume/saturation-flow ratios. To apply this to real-time frames, we approximate it linearly based on the live vehicle count ($N$):
$$t_{\text{green}} = \max(15, \min(15 + 2N, 50))$$
Challenges we ran into
- Model Overfitting: Initially, we trained our vehicle detector on the KITTI dataset (289 images). Validation loss quickly diverged, and the model started memorizing the dataset—even flagging the camera mount as a vehicle. We solved this by switching to the CamVid dataset (469 images) and engineering a custom anti-overfit filter that drops any bounding box where $A_{\text{bbox}} > 0.45 \cdot A_{\text{frame}}$.
- Hardware Bottlenecks: We wanted this to run on a Raspberry Pi 4 at the edge. Standard YOLO models were too heavy, so we aggressively optimized our pipeline to utilize the YOLOv11
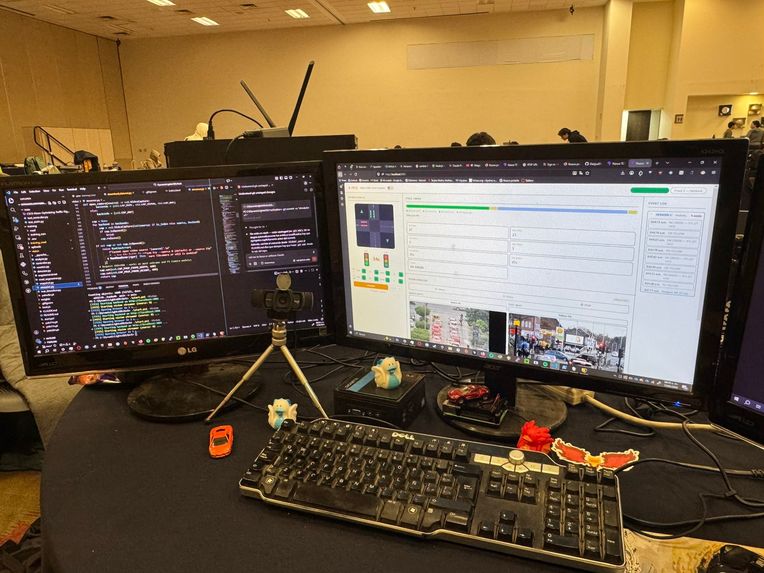
nanovariant, successfully achieving stable framerates without cooking the Pi. - Windows MSMF Conflicts: During desktop testing, we found that Windows MSMF holds exclusive camera access. This meant our Python backend and browser frontend couldn't share the webcam. We engineered around this by writing a custom fallback loop (
cv2.CAP_MSMF,cv2.CAP_DSHOW,cv2.CAP_ANY) and cleanly separating browser camera testing (getUserMedia) from the backend stream.
Accomplishments that we're proud of
- Grounding our code in actual traffic engineering physics. We implemented a 3:2 lane capacity adjustment and integrated the Gipps car-following model for our frontend simulation.
- In our Phase 2 network simulation, cars move using an edge-parametric position model:
$$P(t) = P_{\text{from}} + t \cdot (P_{\text{to}} - P_{\text{from}})$$
Building this microscopic, physics-based simulator entirely from scratch in React (handling braking, following distances, and random-walk routing) was a massive technical triumph for our team.
- Successfully implementing a one-click "Sync Wave" feature that propagates phase offsets across an entire custom-drawn SVG city grid based on a 30 km/h design speed.
What we learned
We gained a deep appreciation for civil and traffic engineering. We learned how to read MUTCD (Manual on Uniform Traffic Control Devices) standards and translate physical road guidelines—like a 3-second yellow light derived from perception-reaction times and braking physics ($v^2/2a$)—into programmatic state machines. We also vastly improved our skills in real-time WebSocket state management and edge-device AI optimization.
What's next for JTCS
Our immediate next step is wiring the Phase 2 React editor directly to the Node.js backend so that complex, multi-node city grids can be registered and controlled over WebSockets just like Phase 1. Beyond that, we plan to write a robust backend coordination engine to actively manage green-wave offsets, and ultimately, we want to field-test JTCS on a real Zapopan intersection using RTSP IP cameras.

Log in or sign up for Devpost to join the conversation.