-
-
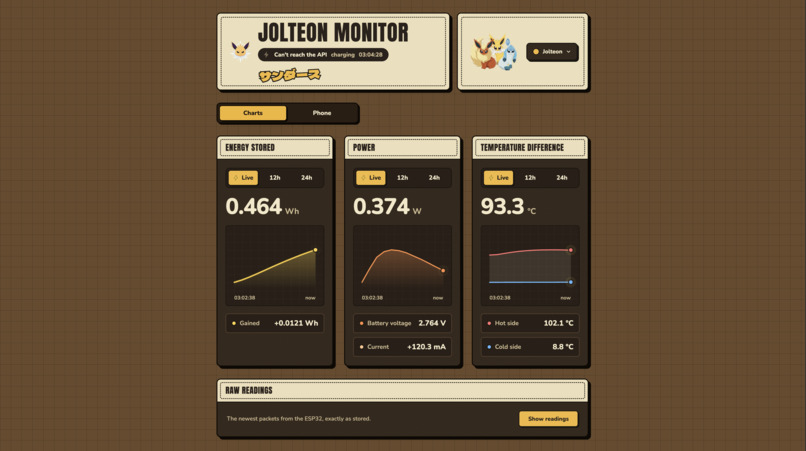
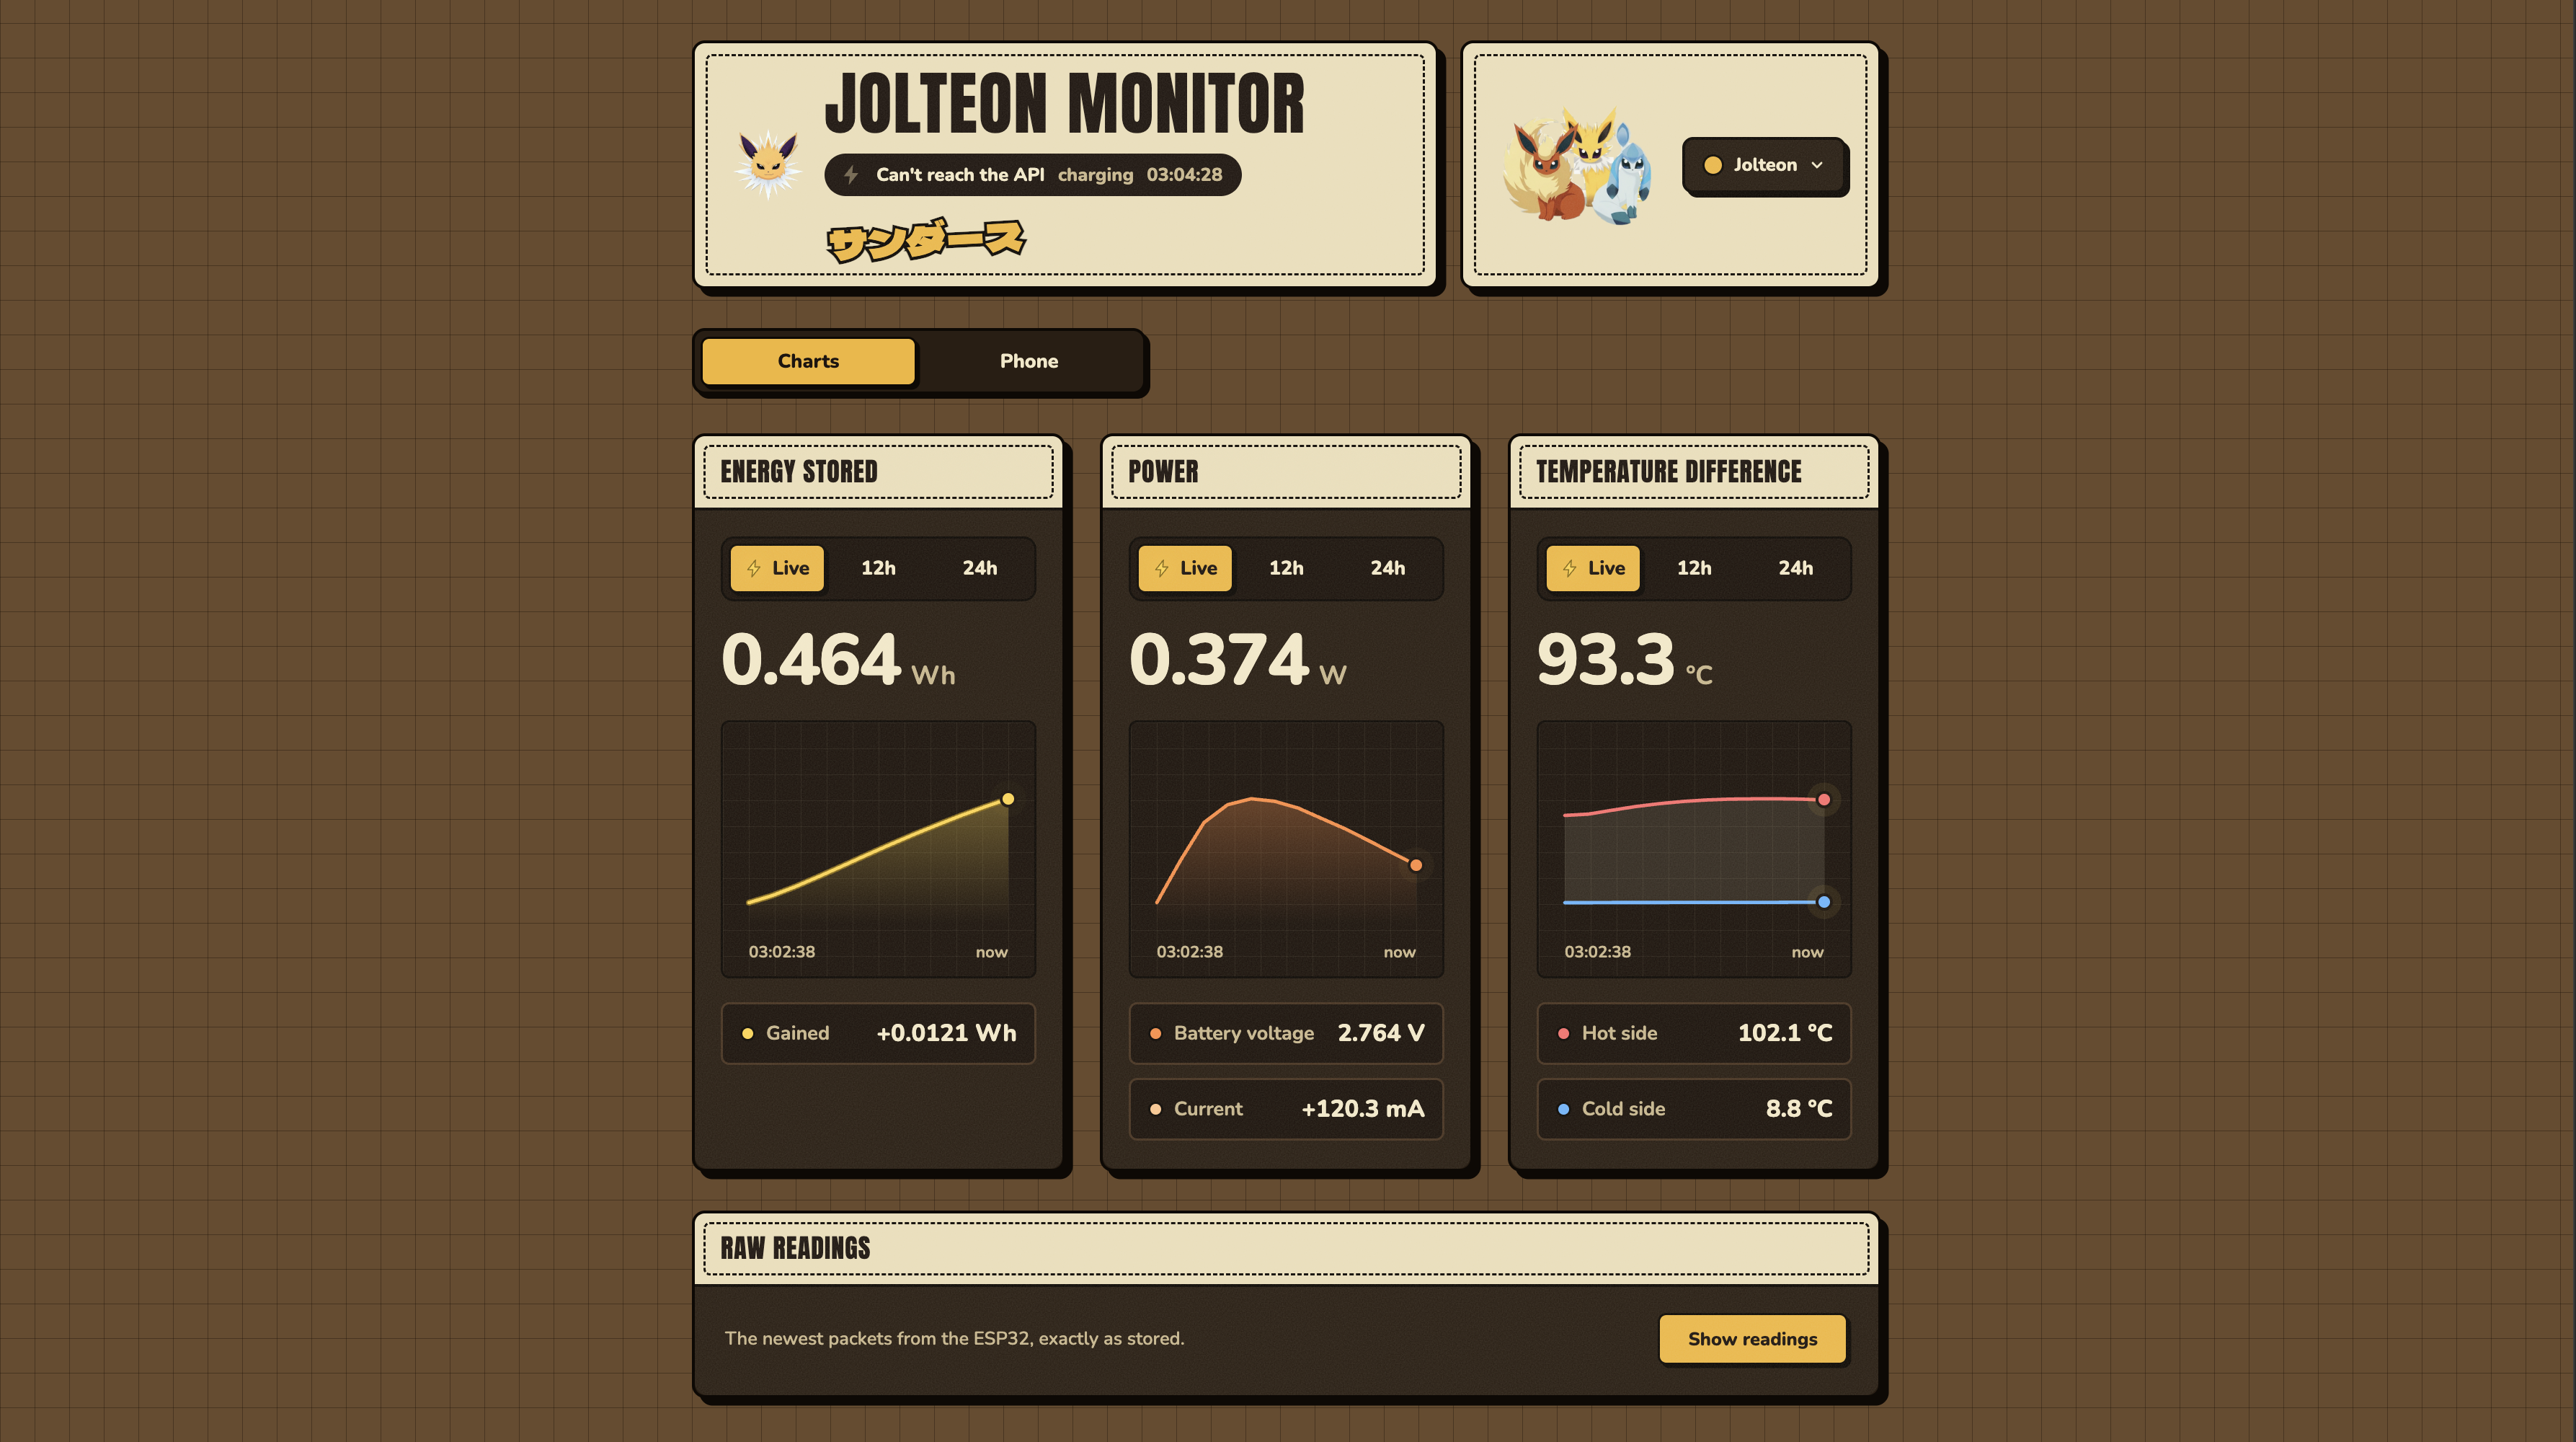
Basic dashboard
-
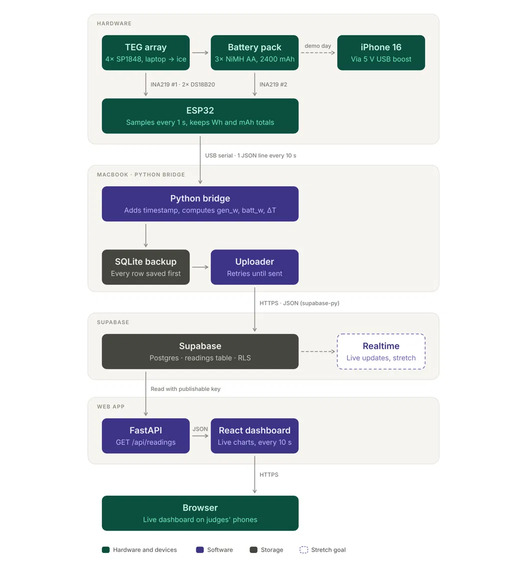
System Architecture
-
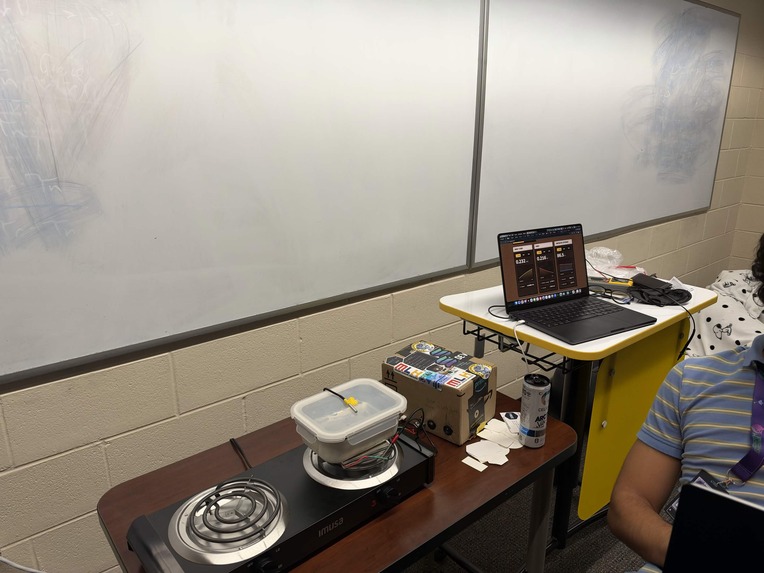
Jolteon end-to-end
-
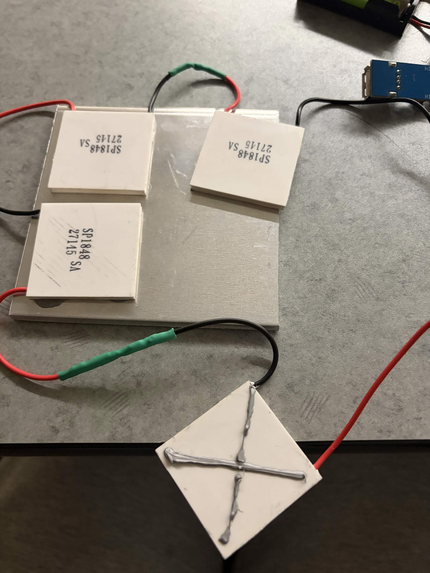
TEG's
-
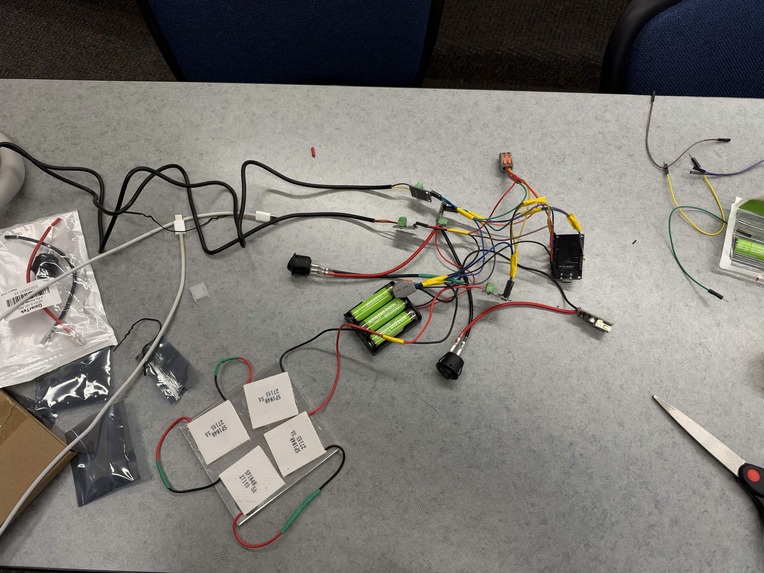
Jolteon Hardware
-
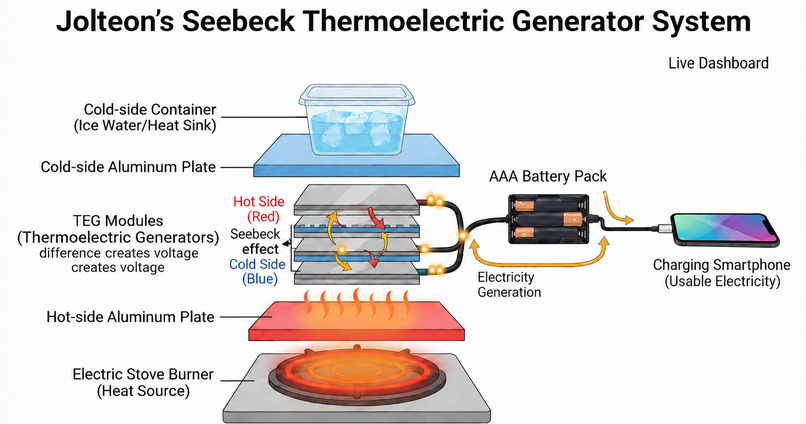
Seebeck Effect
-
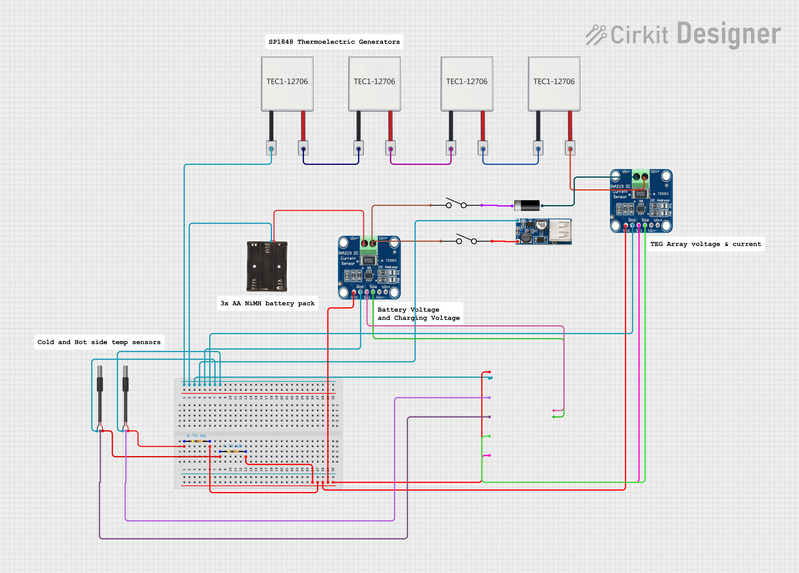
Circuit Design
Inspiration
This summer’s heat wave in New York showed us a problem we couldn’t ignore. During the hottest time in the year residents needed electricity most to stay cool, however data centers were placing significant strain on the city’s power grid. That strain feeds a vicious cycle: data centers consume huge amounts of energy, a large amount of the energy ends up as waste heat, and that heat makes the city even harder to live in.
This made us ask: why are we letting that heat go to waste? After all, heat is still energy. Instead of letting data centers push the grid and the people who depend on it to their limits, we wanted to capture that waste heat and put it to use. Our project does this with the Seebeck effect, which generates electricity from a temperature difference, turning a byproduct into a resource and reducing the burden on the city’s power supply.
What it does
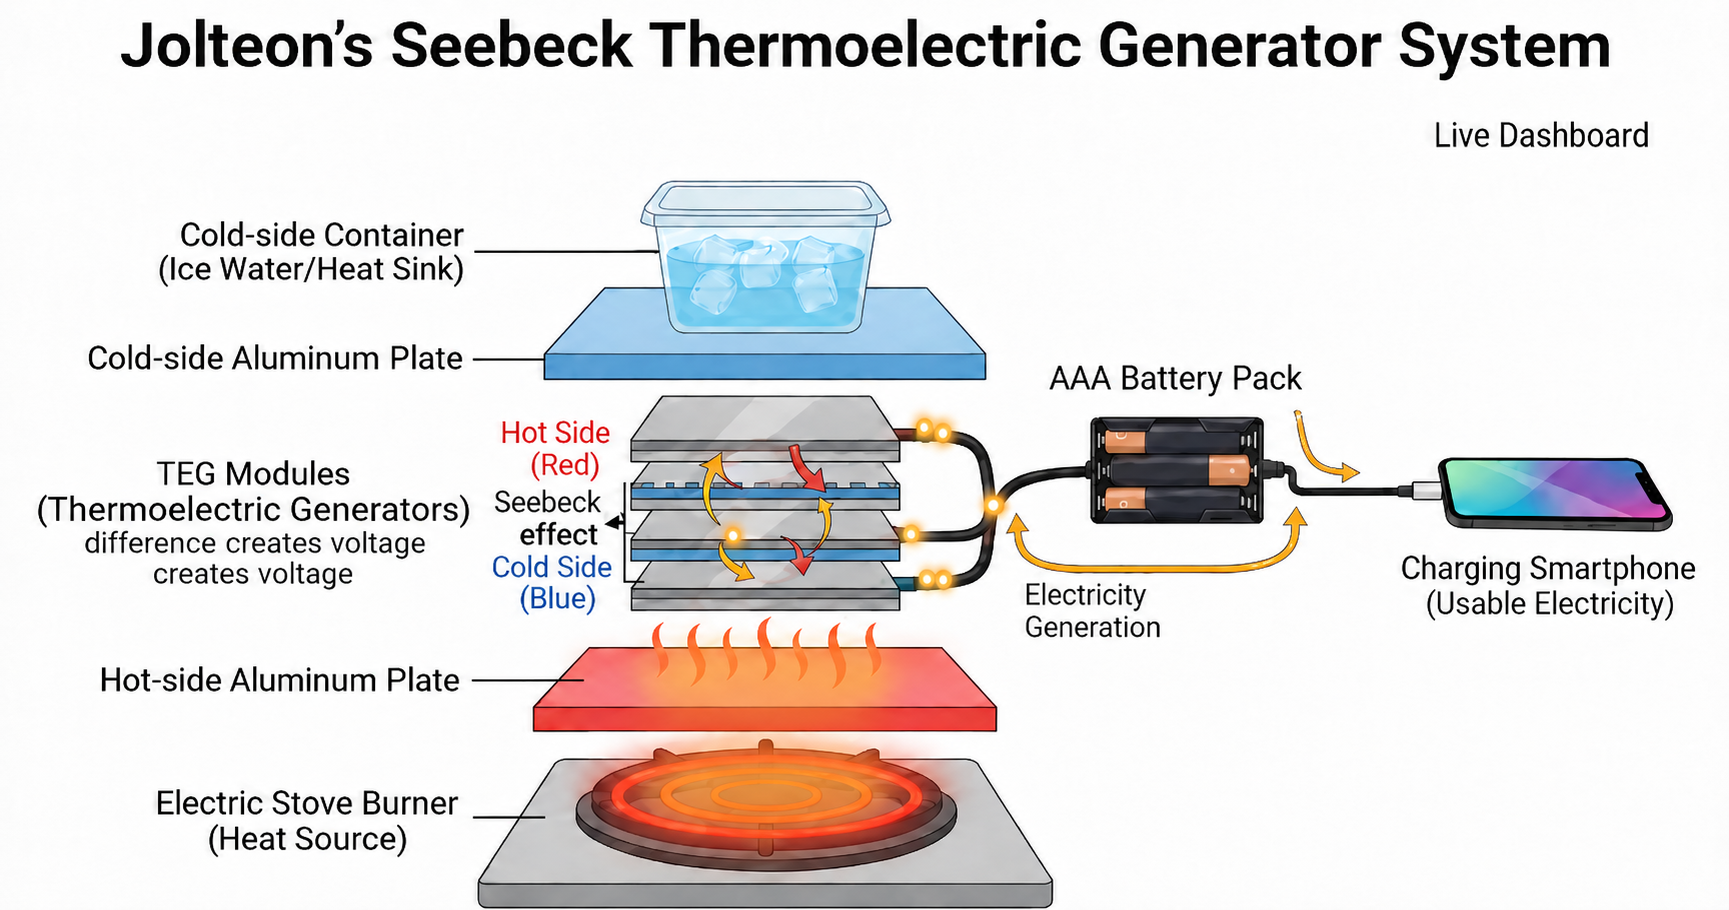
Jolteon captures waste heat, turns it into stored electricity, and shows you exactly how much it has collected, live.
| Step | What happens |
|---|---|
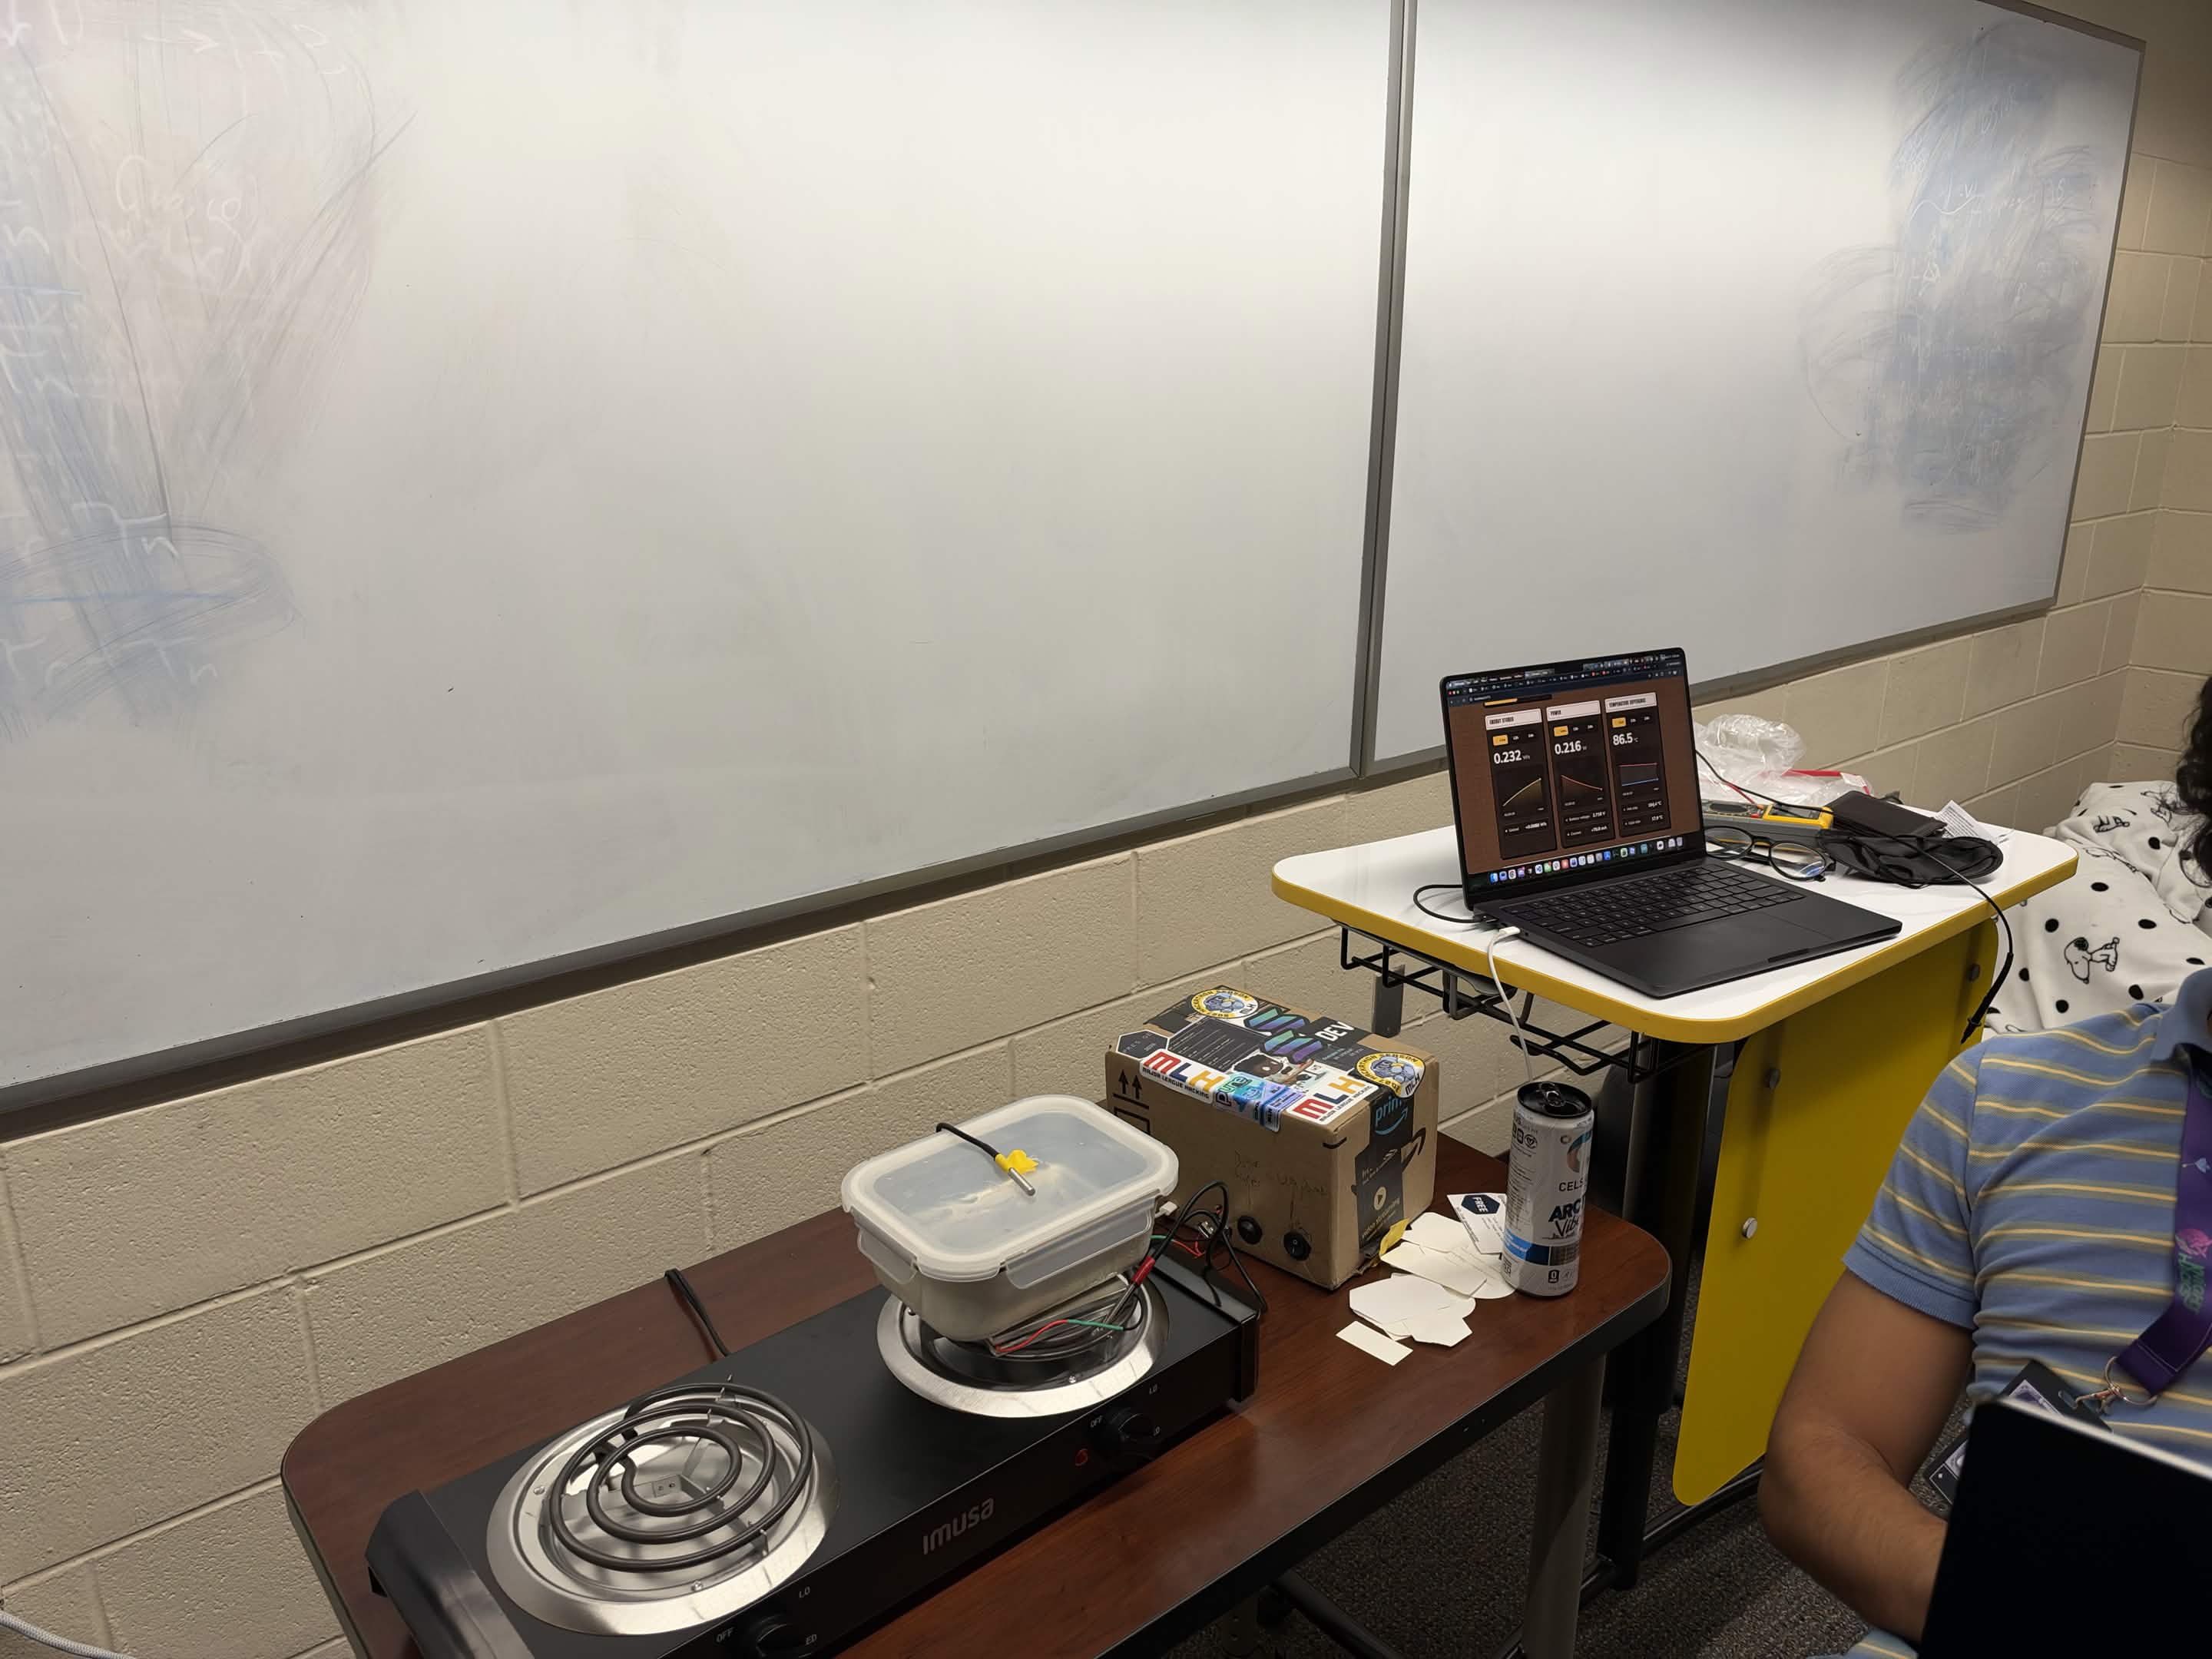
| 🔥 Heat | A hot plate stands in for a server and heats one side of the generators |
| ❄️ Cold | An ice bath keeps the other side cold |
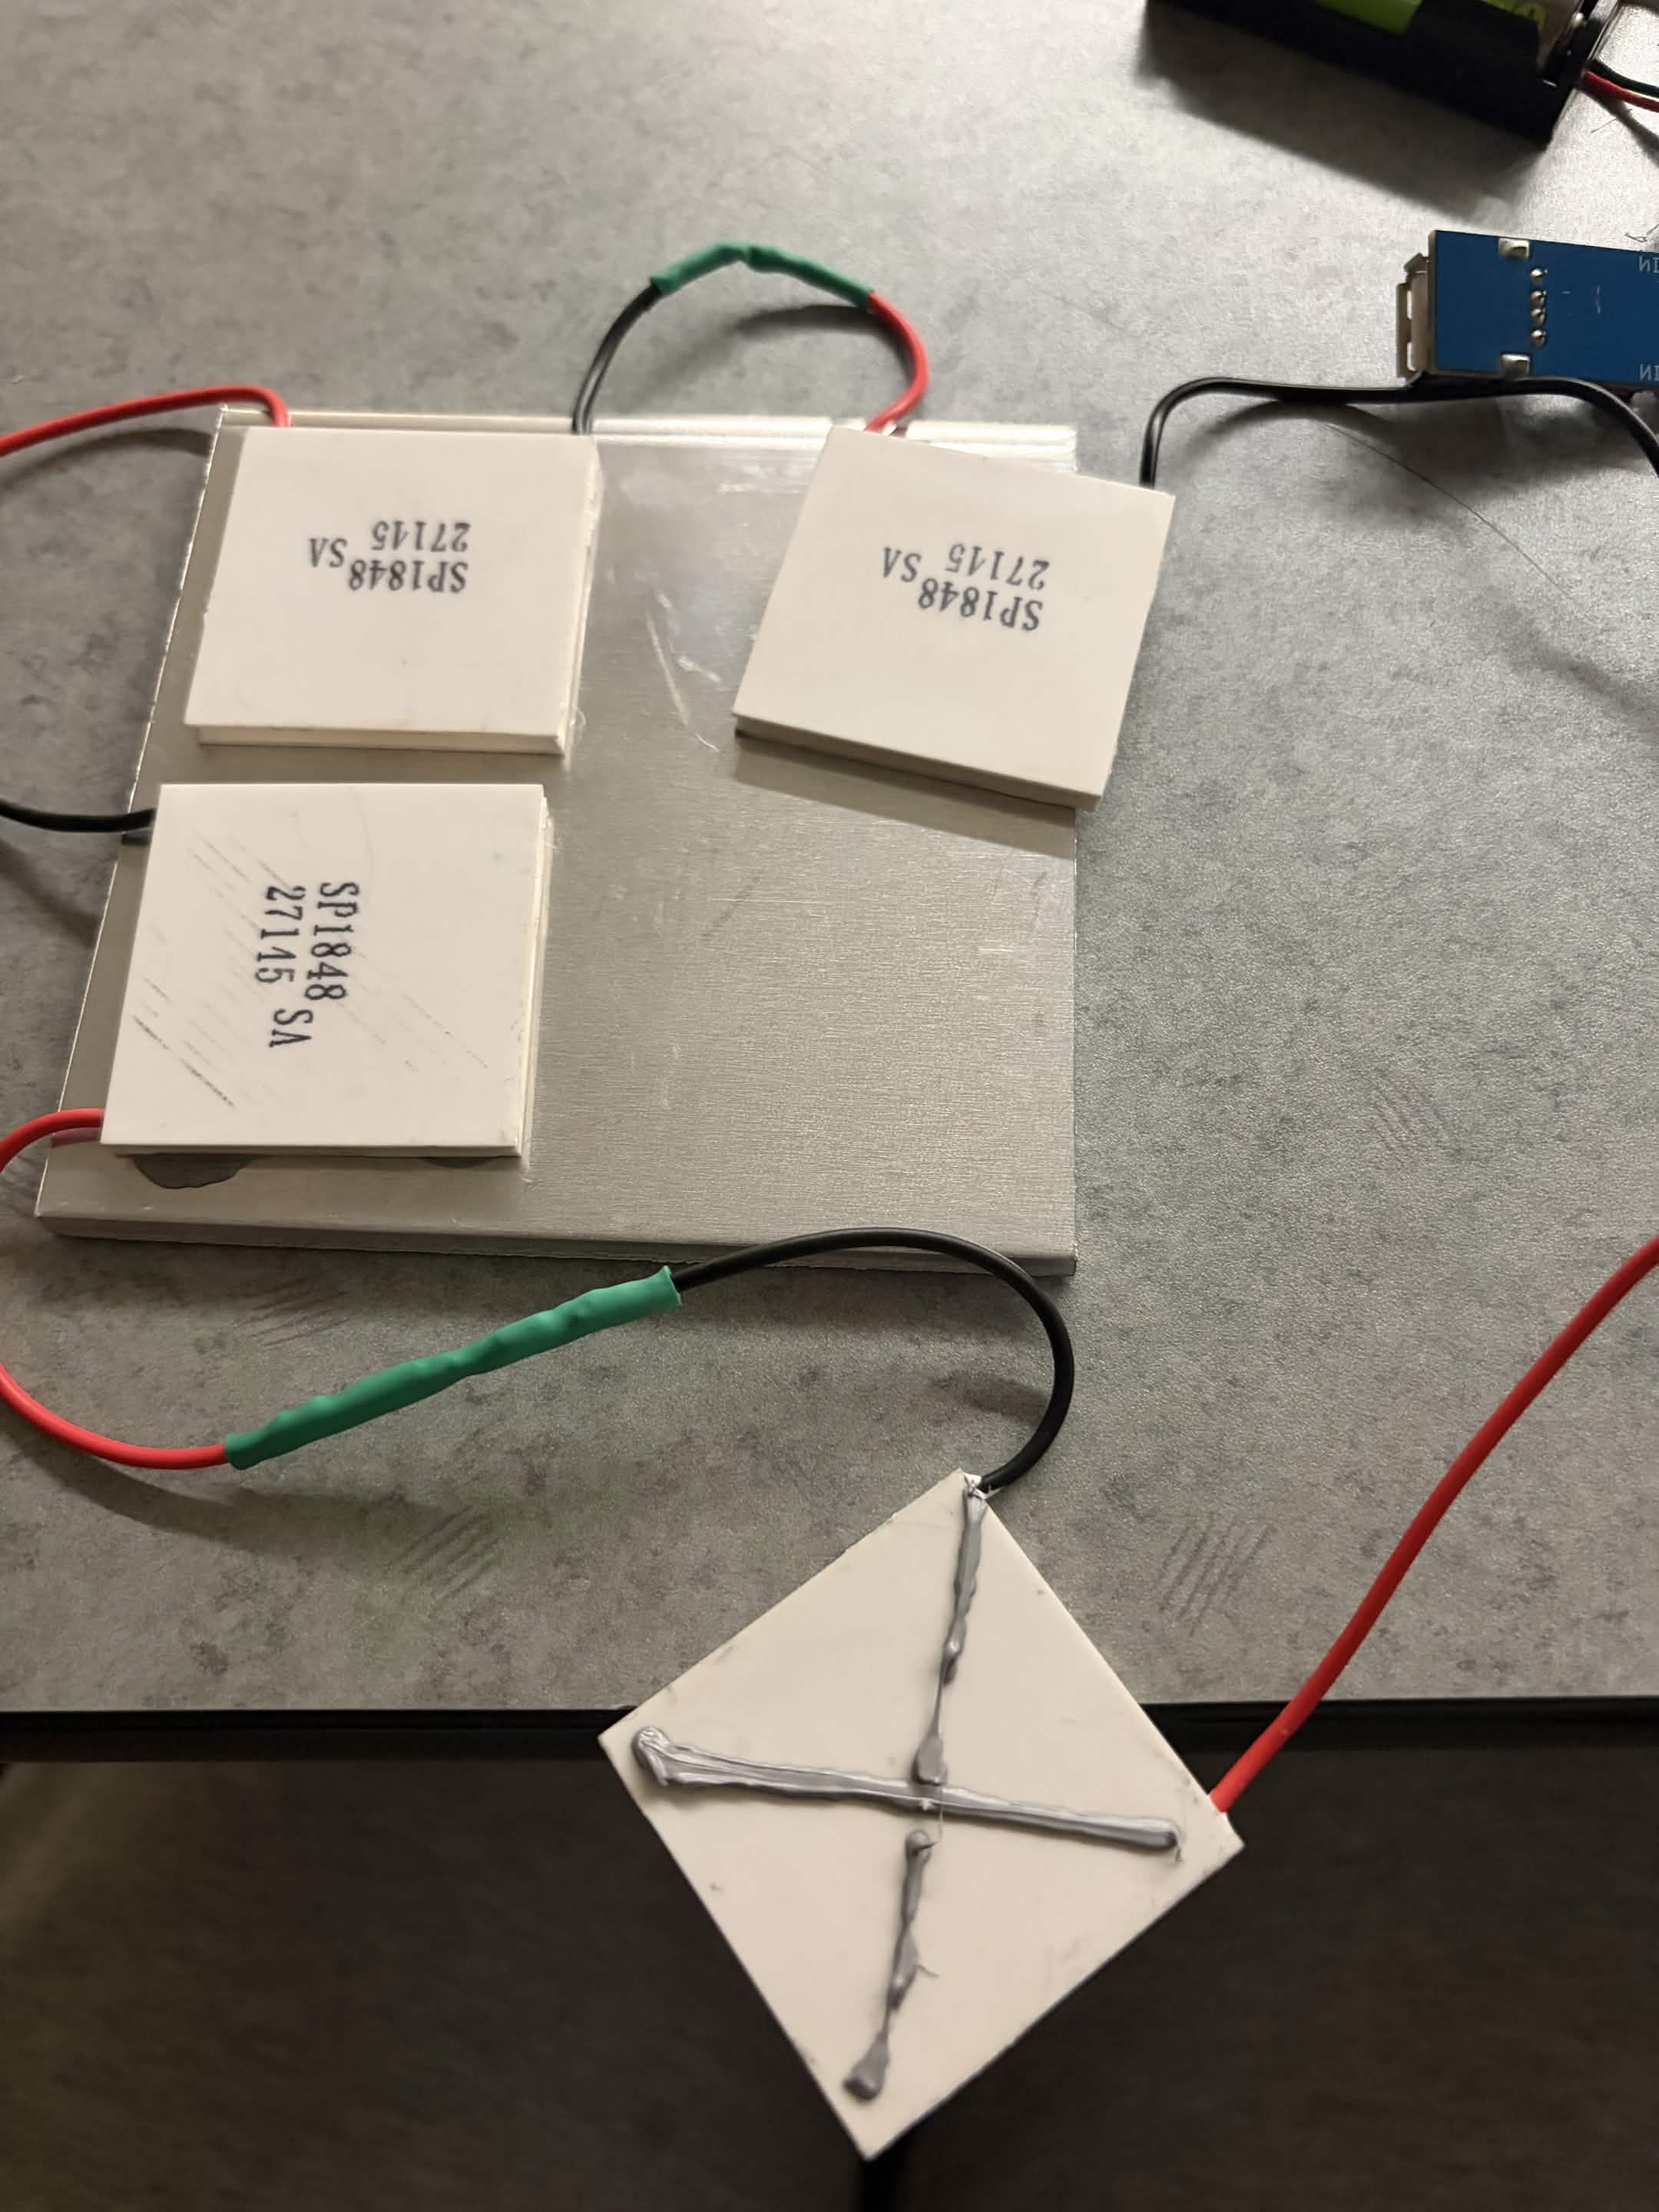
| ⚡ Generate | Four thermoelectric generators turn that temperature difference into electricity |
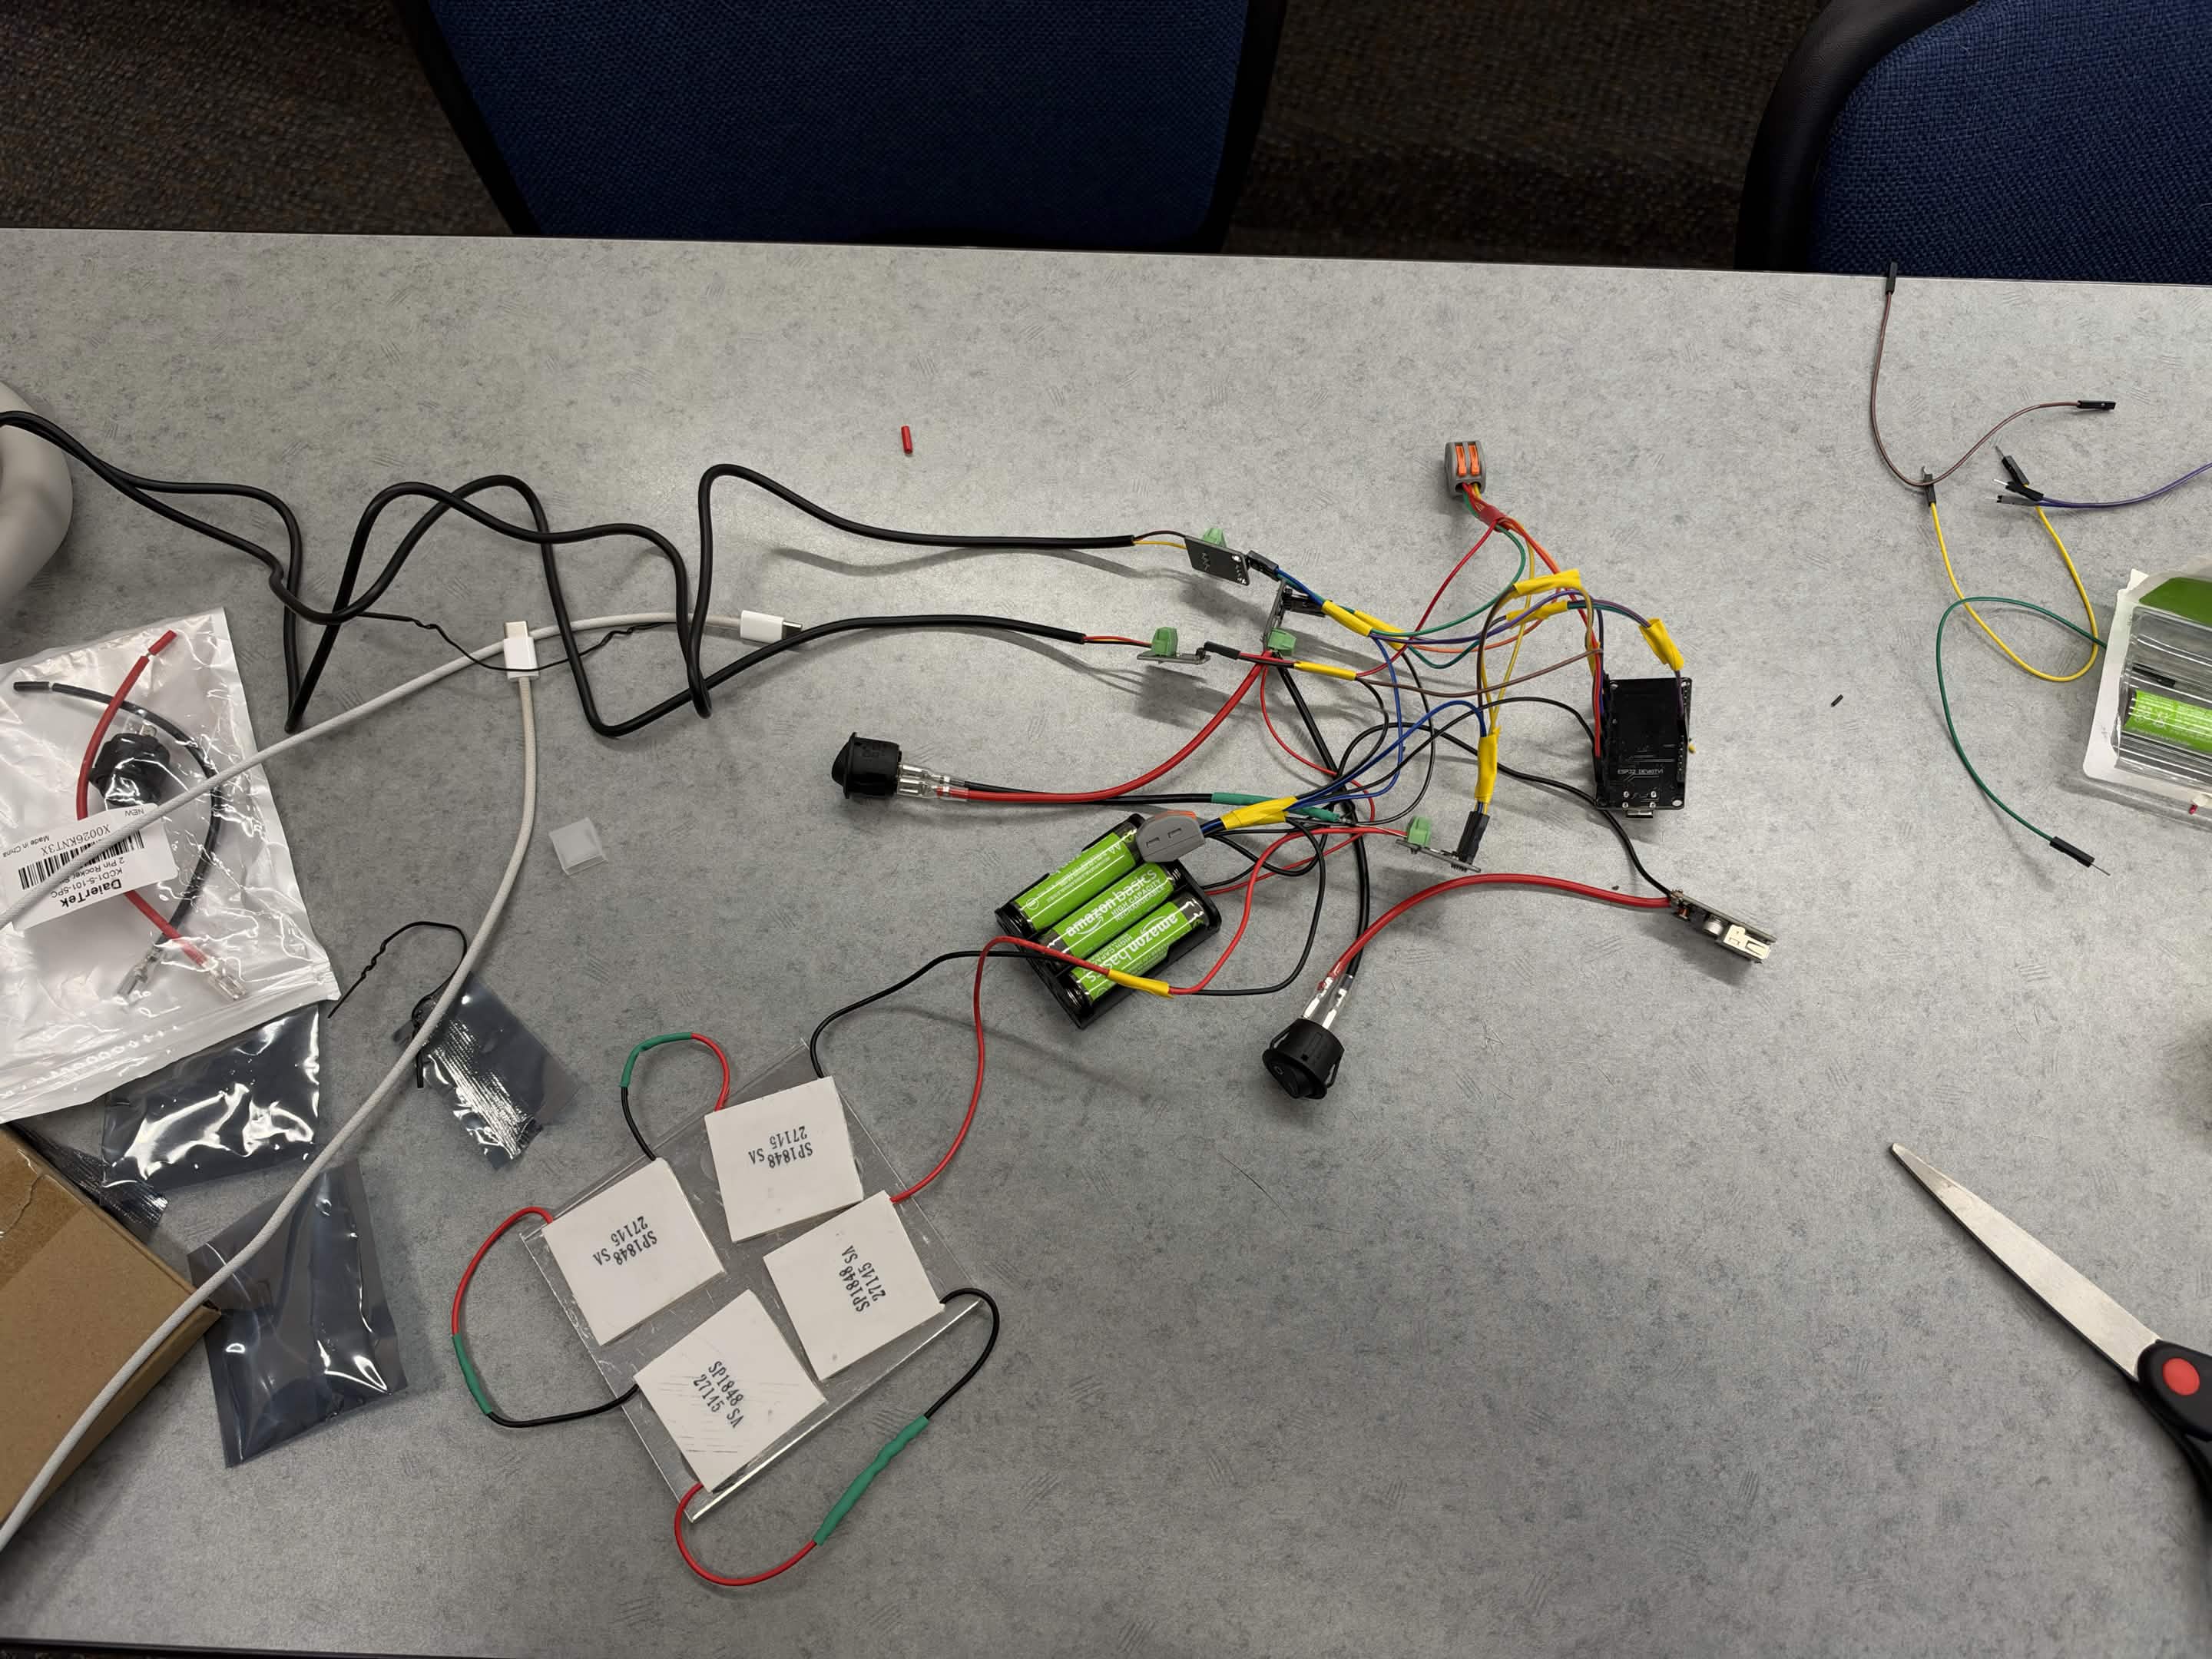
| 🔋 Store | The current flows straight into a battery pack, no charging chip needed |
| 📈 Track | Every reading streams to a public dashboard anyone can open on their phone |
We picked the battery so its own voltage keeps the generators near their most efficient point. The physics does the regulating for us, which keeps the circuit simple enough to explain in one sentence.
How we built it
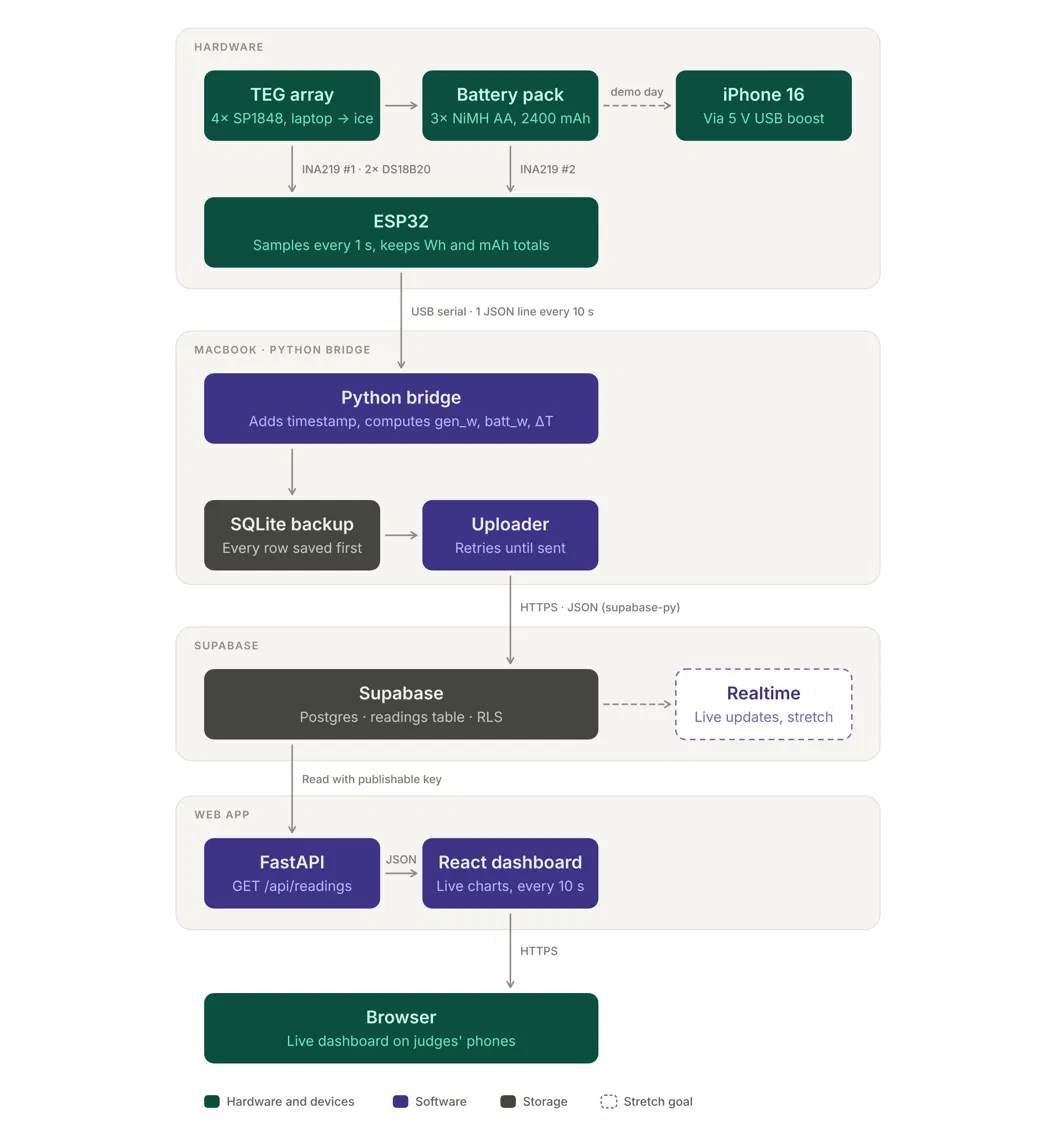
We agreed on one shared JSON format first, so the hardware, firmware, bridge and dashboard could all be built at the same time without stepping on each other.
 ┌──────────────── HARDWARE ────────────────┐
 │  Hot plate ─► [ 4 × TEG ] ─► Ice bath     │
 │         Schottky diode ─► NiMH battery    │
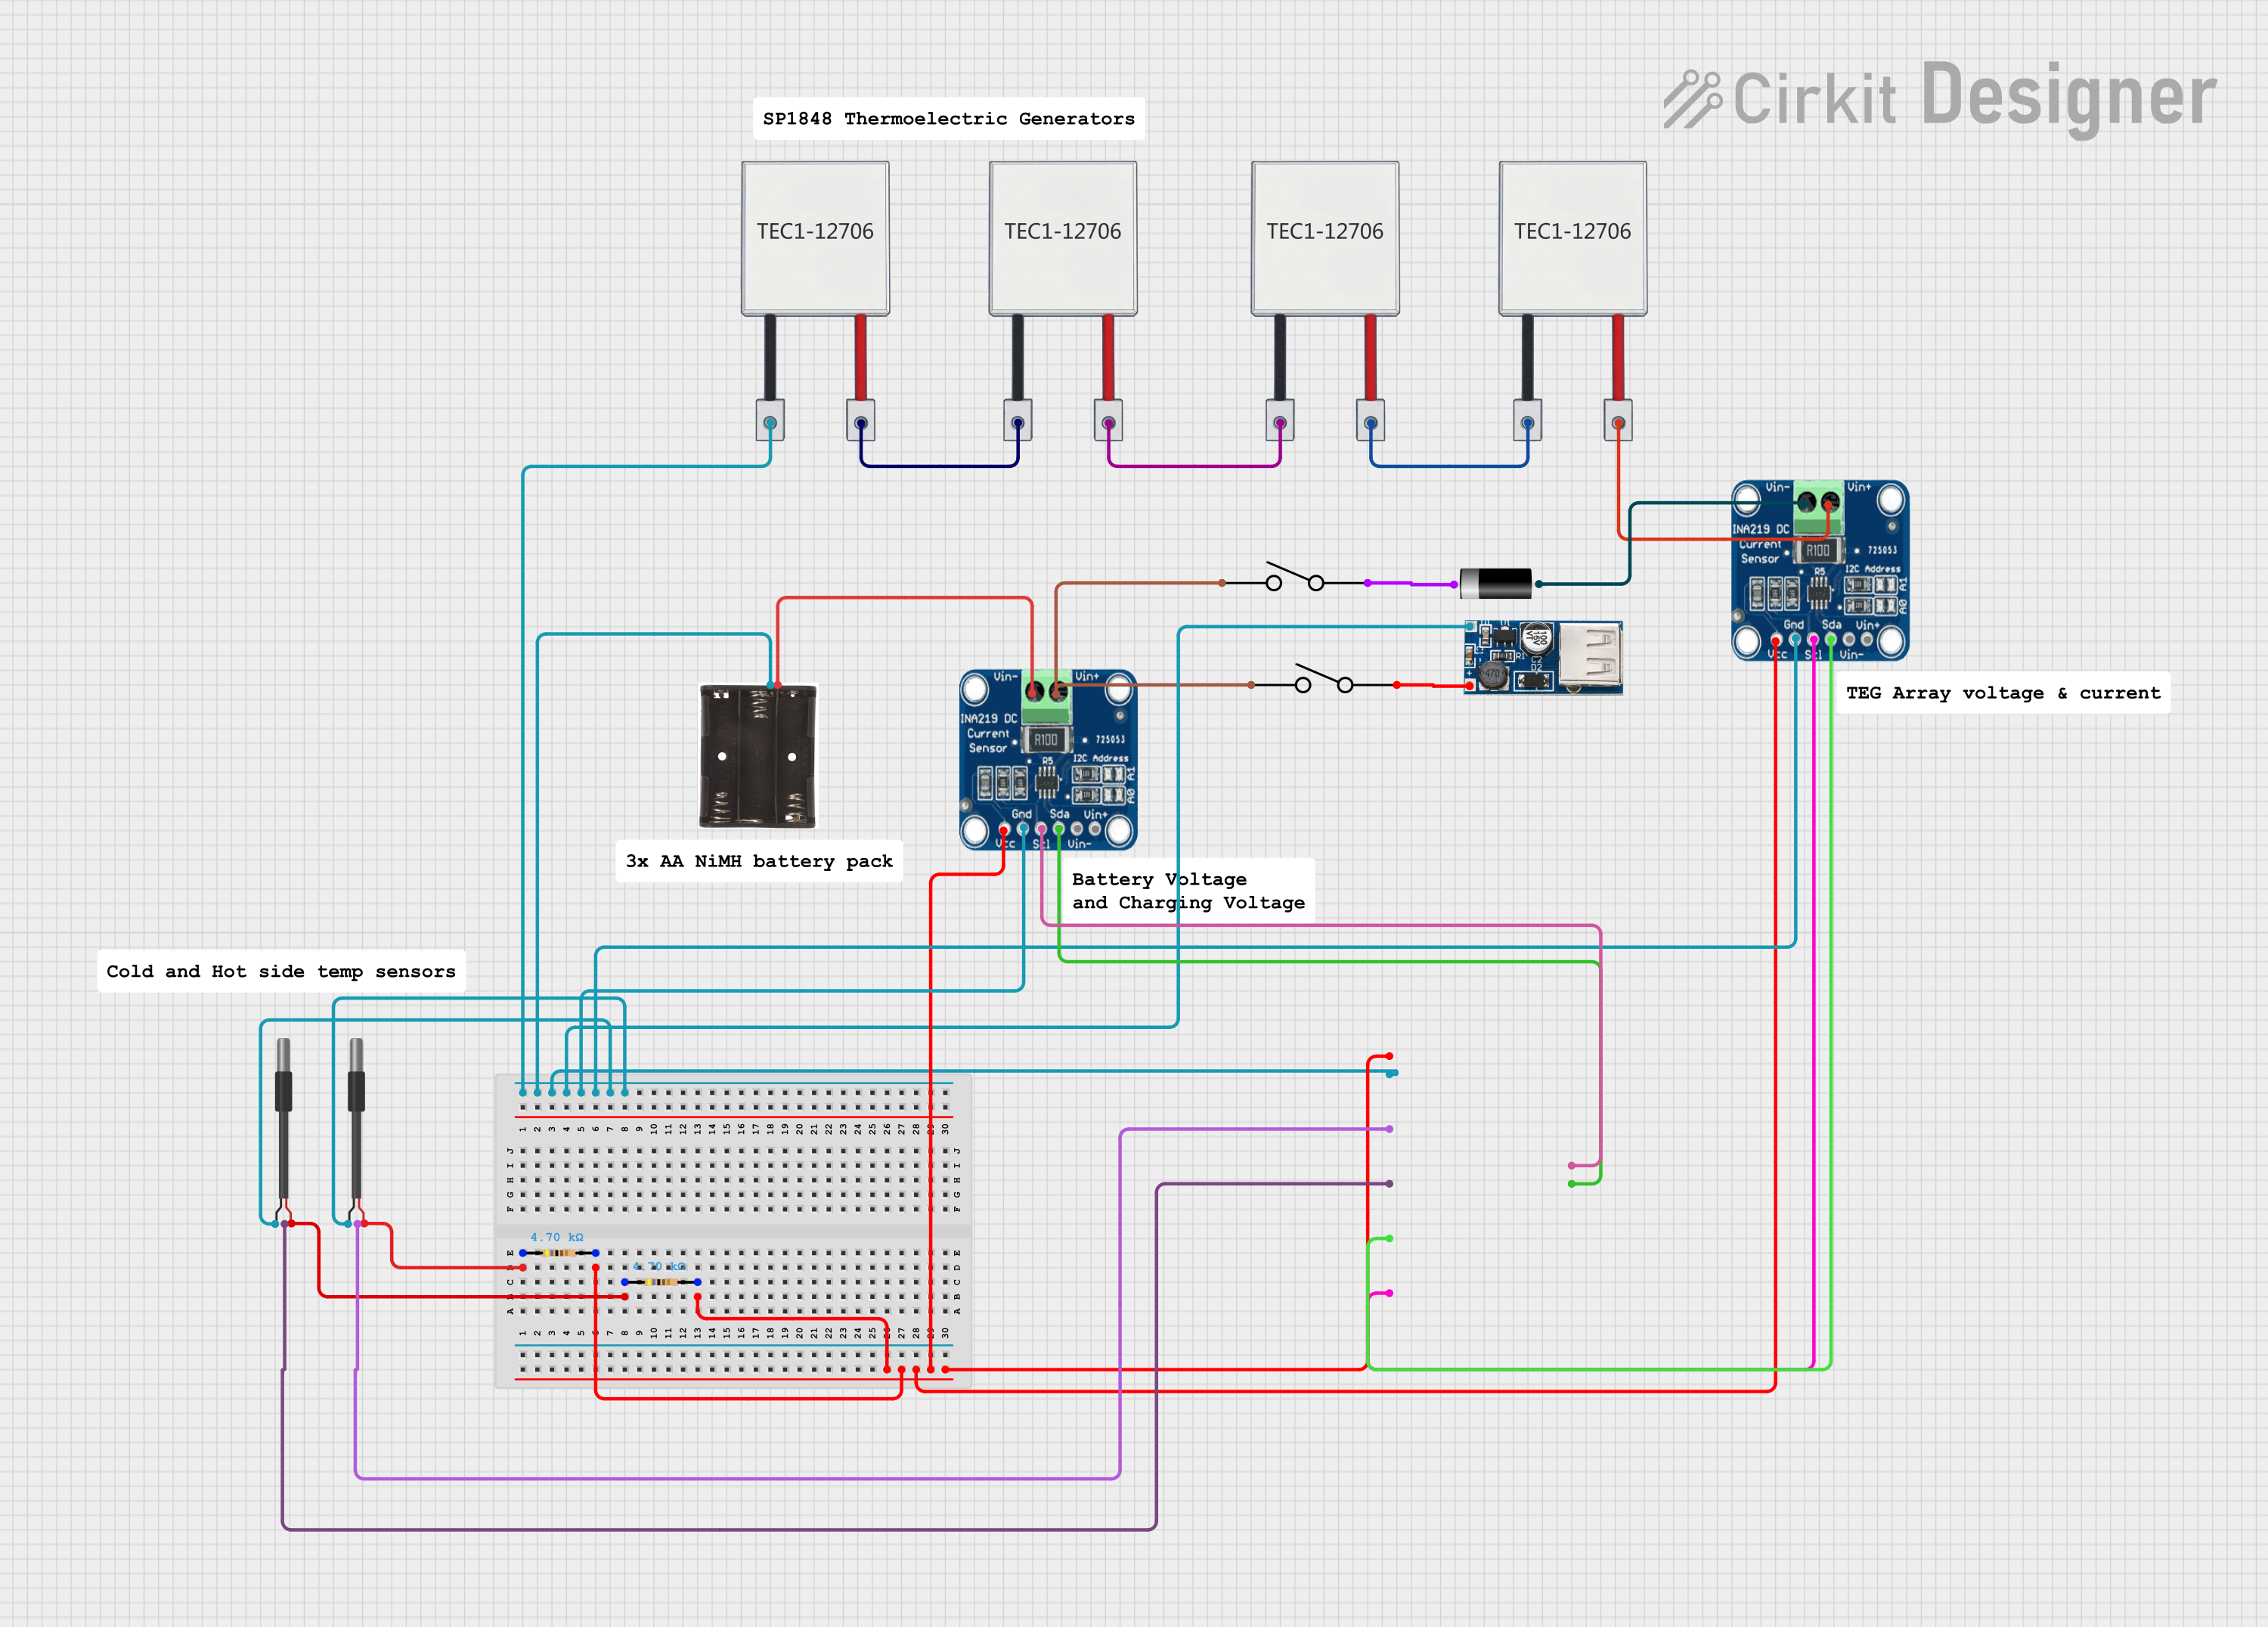
 │   INA219 × 2 · DS18B20 × 2 ─► ESP32       │
 └───────────────────┬──────────────────────┘
                     │  USB serial · 1 JSON line every 10 s
                     ▼
 ┌──────────── MACBOOK (PYTHON BRIDGE) ──────┐
 │  validate ─► timestamp ─► SQLite backup   │
 │                          ─► uploader      │
 └──────────────────────────────┬────────────┘
                                │  HTTPS · JSON
                                ▼
 ┌──────────────── SUPABASE ─────────────────┐
 │          Postgres · readings table        │
 └──────────────────────────────┬────────────┘
                                ▼
 ┌──────────────── VERCEL ───────────────────┐
 │   FastAPI  ─── JSON ───►  React dashboard │
 └──────────────────────────────┬────────────┘
                                ▼
                     Any phone or laptop
| Layer | What it does | Built with |
|---|---|---|
| 🔥 Hardware | Turns heat into current and stores it | 4 × SP1848-27145 TEGs, aluminum plates, Schottky diode, NiMH cells |
| 🔧 Firmware | Samples sensors every second, keeps running energy totals that survive resets | ESP32, Arduino, INA219, DS18B20 |
| 🐍 Bridge | Validates every reading, saves it locally first, then syncs to the cloud | Python, pyserial, SQLite, supabase-py |
| 🗄️ Database | Stores the full run | Supabase (Postgres) |
| 🌐 Web | Serves and charts the data live | FastAPI, React, Vite, Recharts, Tailwind, Vercel |
Saving every reading locally before uploading was the key decision. If the Wi-Fi drops, readings just wait their turn. If the USB cable gets bumped, the bridge finds the ESP32 again on its own.
Challenges we ran into
Our first database couldn't handle the venue Wi-Fi. We started on a different cloud database, but the connection kept failing on the hackathon's network, and a run that lasts all night can't depend on that. Around 5 a.m. we moved everything to Supabase, which talks over plain HTTPS and went through on the first try.
The ESP32 resets every time you open its port. Every time the bridge connected, the board rebooted, its packet counter started back at 1, and the database quietly threw away new readings as duplicates. Nothing crashed, the data just vanished. We fixed it by saving the counter to flash and jumping it ahead on every boot, so a number can never be reused.
The laptop wasn't hot enough. This was the big one. A laptop's underside is designed to stay cool, and after the heat passes through a thermal pad and two aluminum plates, our generators barely saw a temperature difference, not enough to push a single milliamp into the battery. [We switched to a hot water loop, which turned out to be closer to how modern liquid-cooled data centers actually carry heat away from servers.]
Accomplishments that we're proud of
We tried hard to break our own pipeline, and it held up:
| Test | Result |
|---|---|
| Simulated network outages | 0 readings lost, 0 duplicates |
| Bridge killed 20 times mid-stream | 0 missing, 0 duplicates |
| 1,000 corrupted lines | All rejected, 0 crashes |
| Sensor reading to visible in the API | ~200 ms |
| Chart data with downsampling | 83% smaller |
Over 3 hours, Jolteon collected 1.2 Wh from heat that would have been thrown away. Every one of those watt-hours is a real measurement, and anyone can scan our QR code and watch the number tick up on their own phone.
What we learned
Heat is easy to make and hard to move. We assumed "hot laptop" meant "lots of usable heat." It doesn't. Thermal contact, a few degrees here and there, and even which side of a module faces up mattered far more than we expected.
Plan for things to break. Saving locally first felt like overkill at the start. Then the Wi-Fi died, the ESP32 kept rebooting, and the cable got bumped, and not one of those cost us a reading thanks to our safety-net data base.
Agree on the data before writing code. Settling the JSON format on day one let four parts get built in parallel, and when something changed, there was exactly one place to change it first.
What's next for Jolteon
The biggest step is moving onto real heat. Server racks and liquid-cooling loops run hotter and steadier than anything we could set up in a weekend, and that's where these generators start to make sense. After that: a proper energy-harvesting chip that works at smaller temperature differences, an estimate of what a full rack or data center could recover, and cost and carbon numbers on the dashboard so the energy we capture means something to the people who would pay for it.
Built With
- c++
- esp32
- fastapi
- ina219
- javascript
- pyserial
- python
- react
- recharts
- sql
- supabase
- thermoelectric-generator
- vercel
- vite


Log in or sign up for Devpost to join the conversation.