-
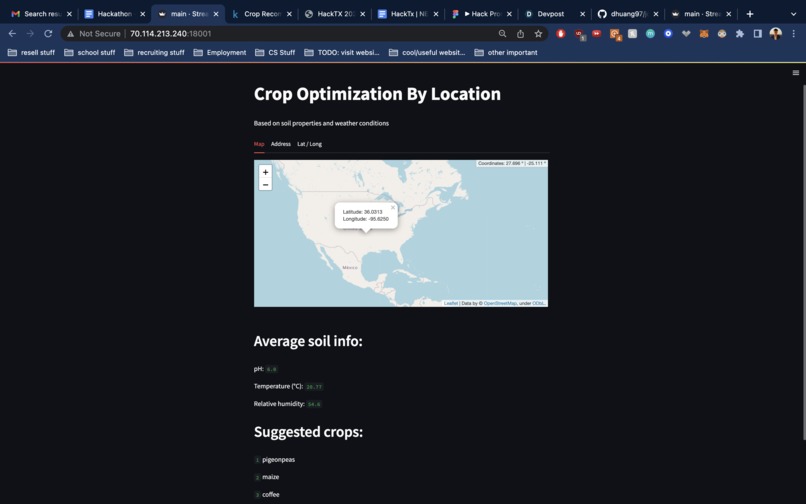
interactive map view
-
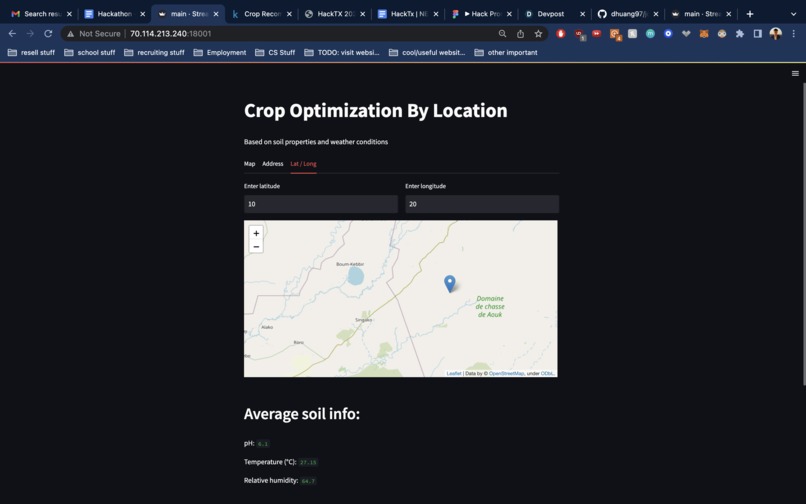
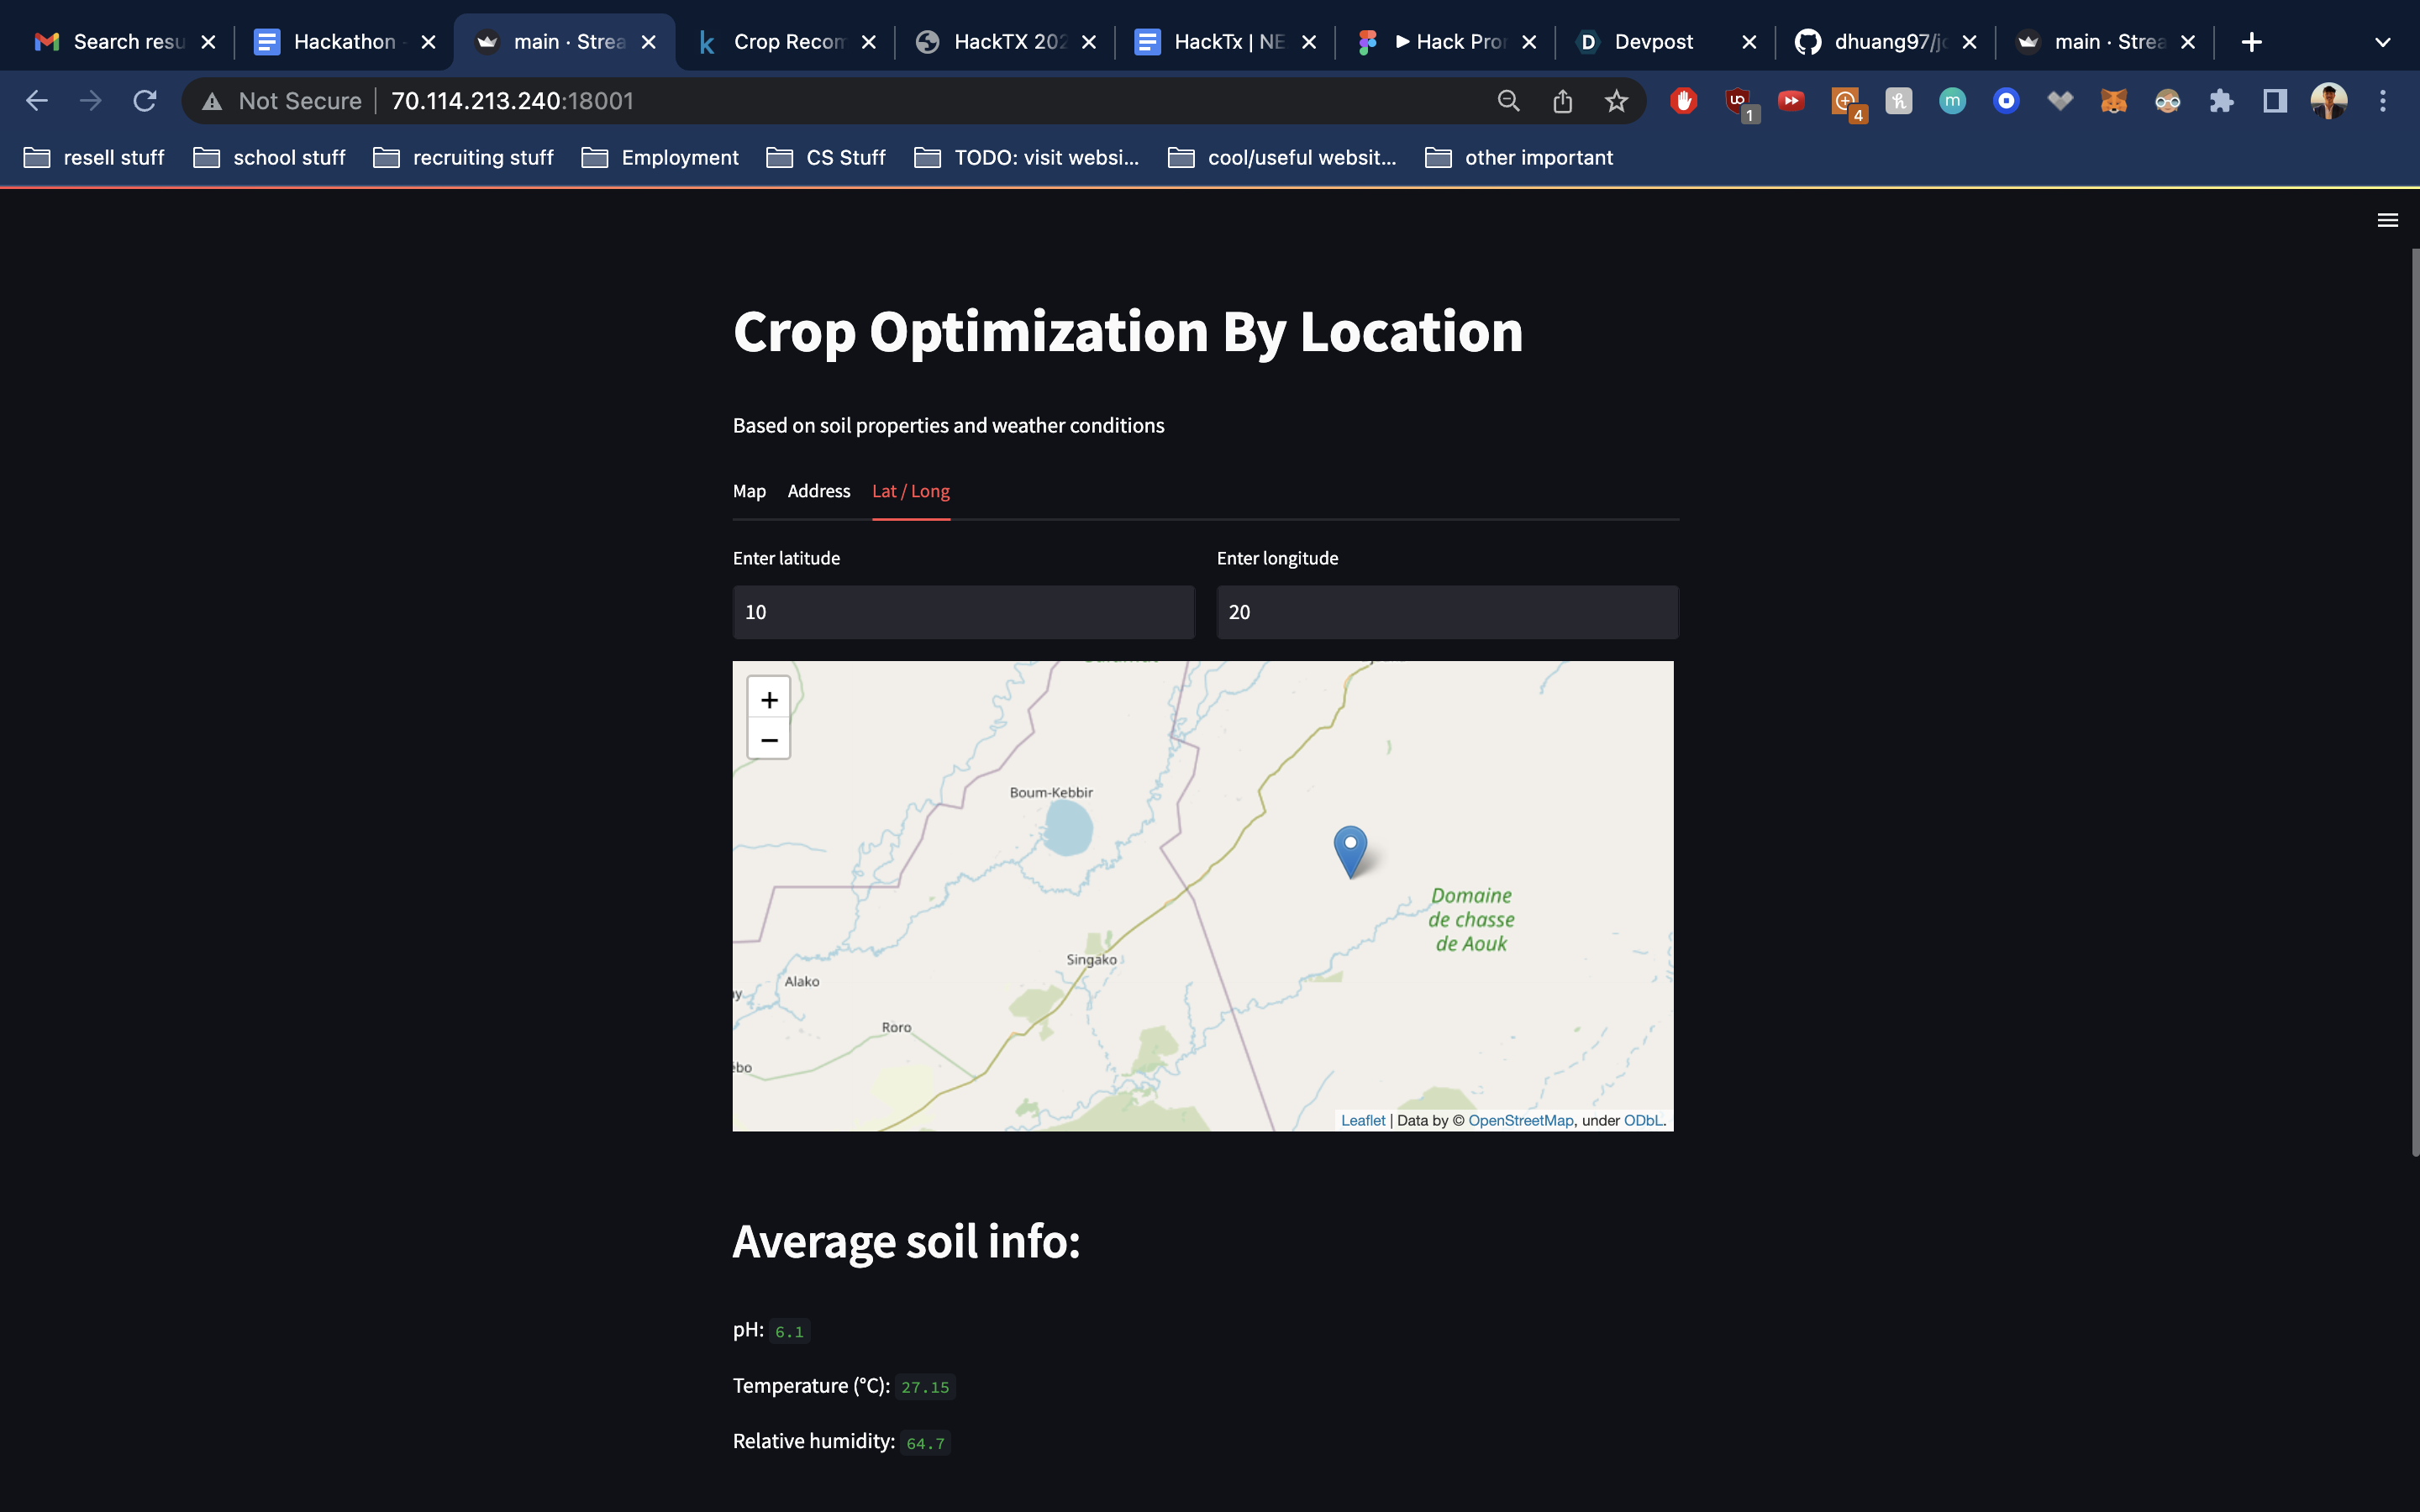
enter lat/lon view
-
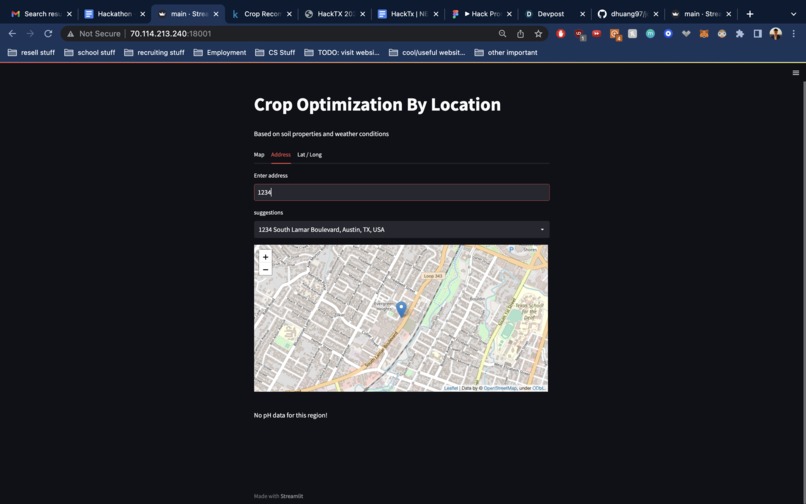
enter address view

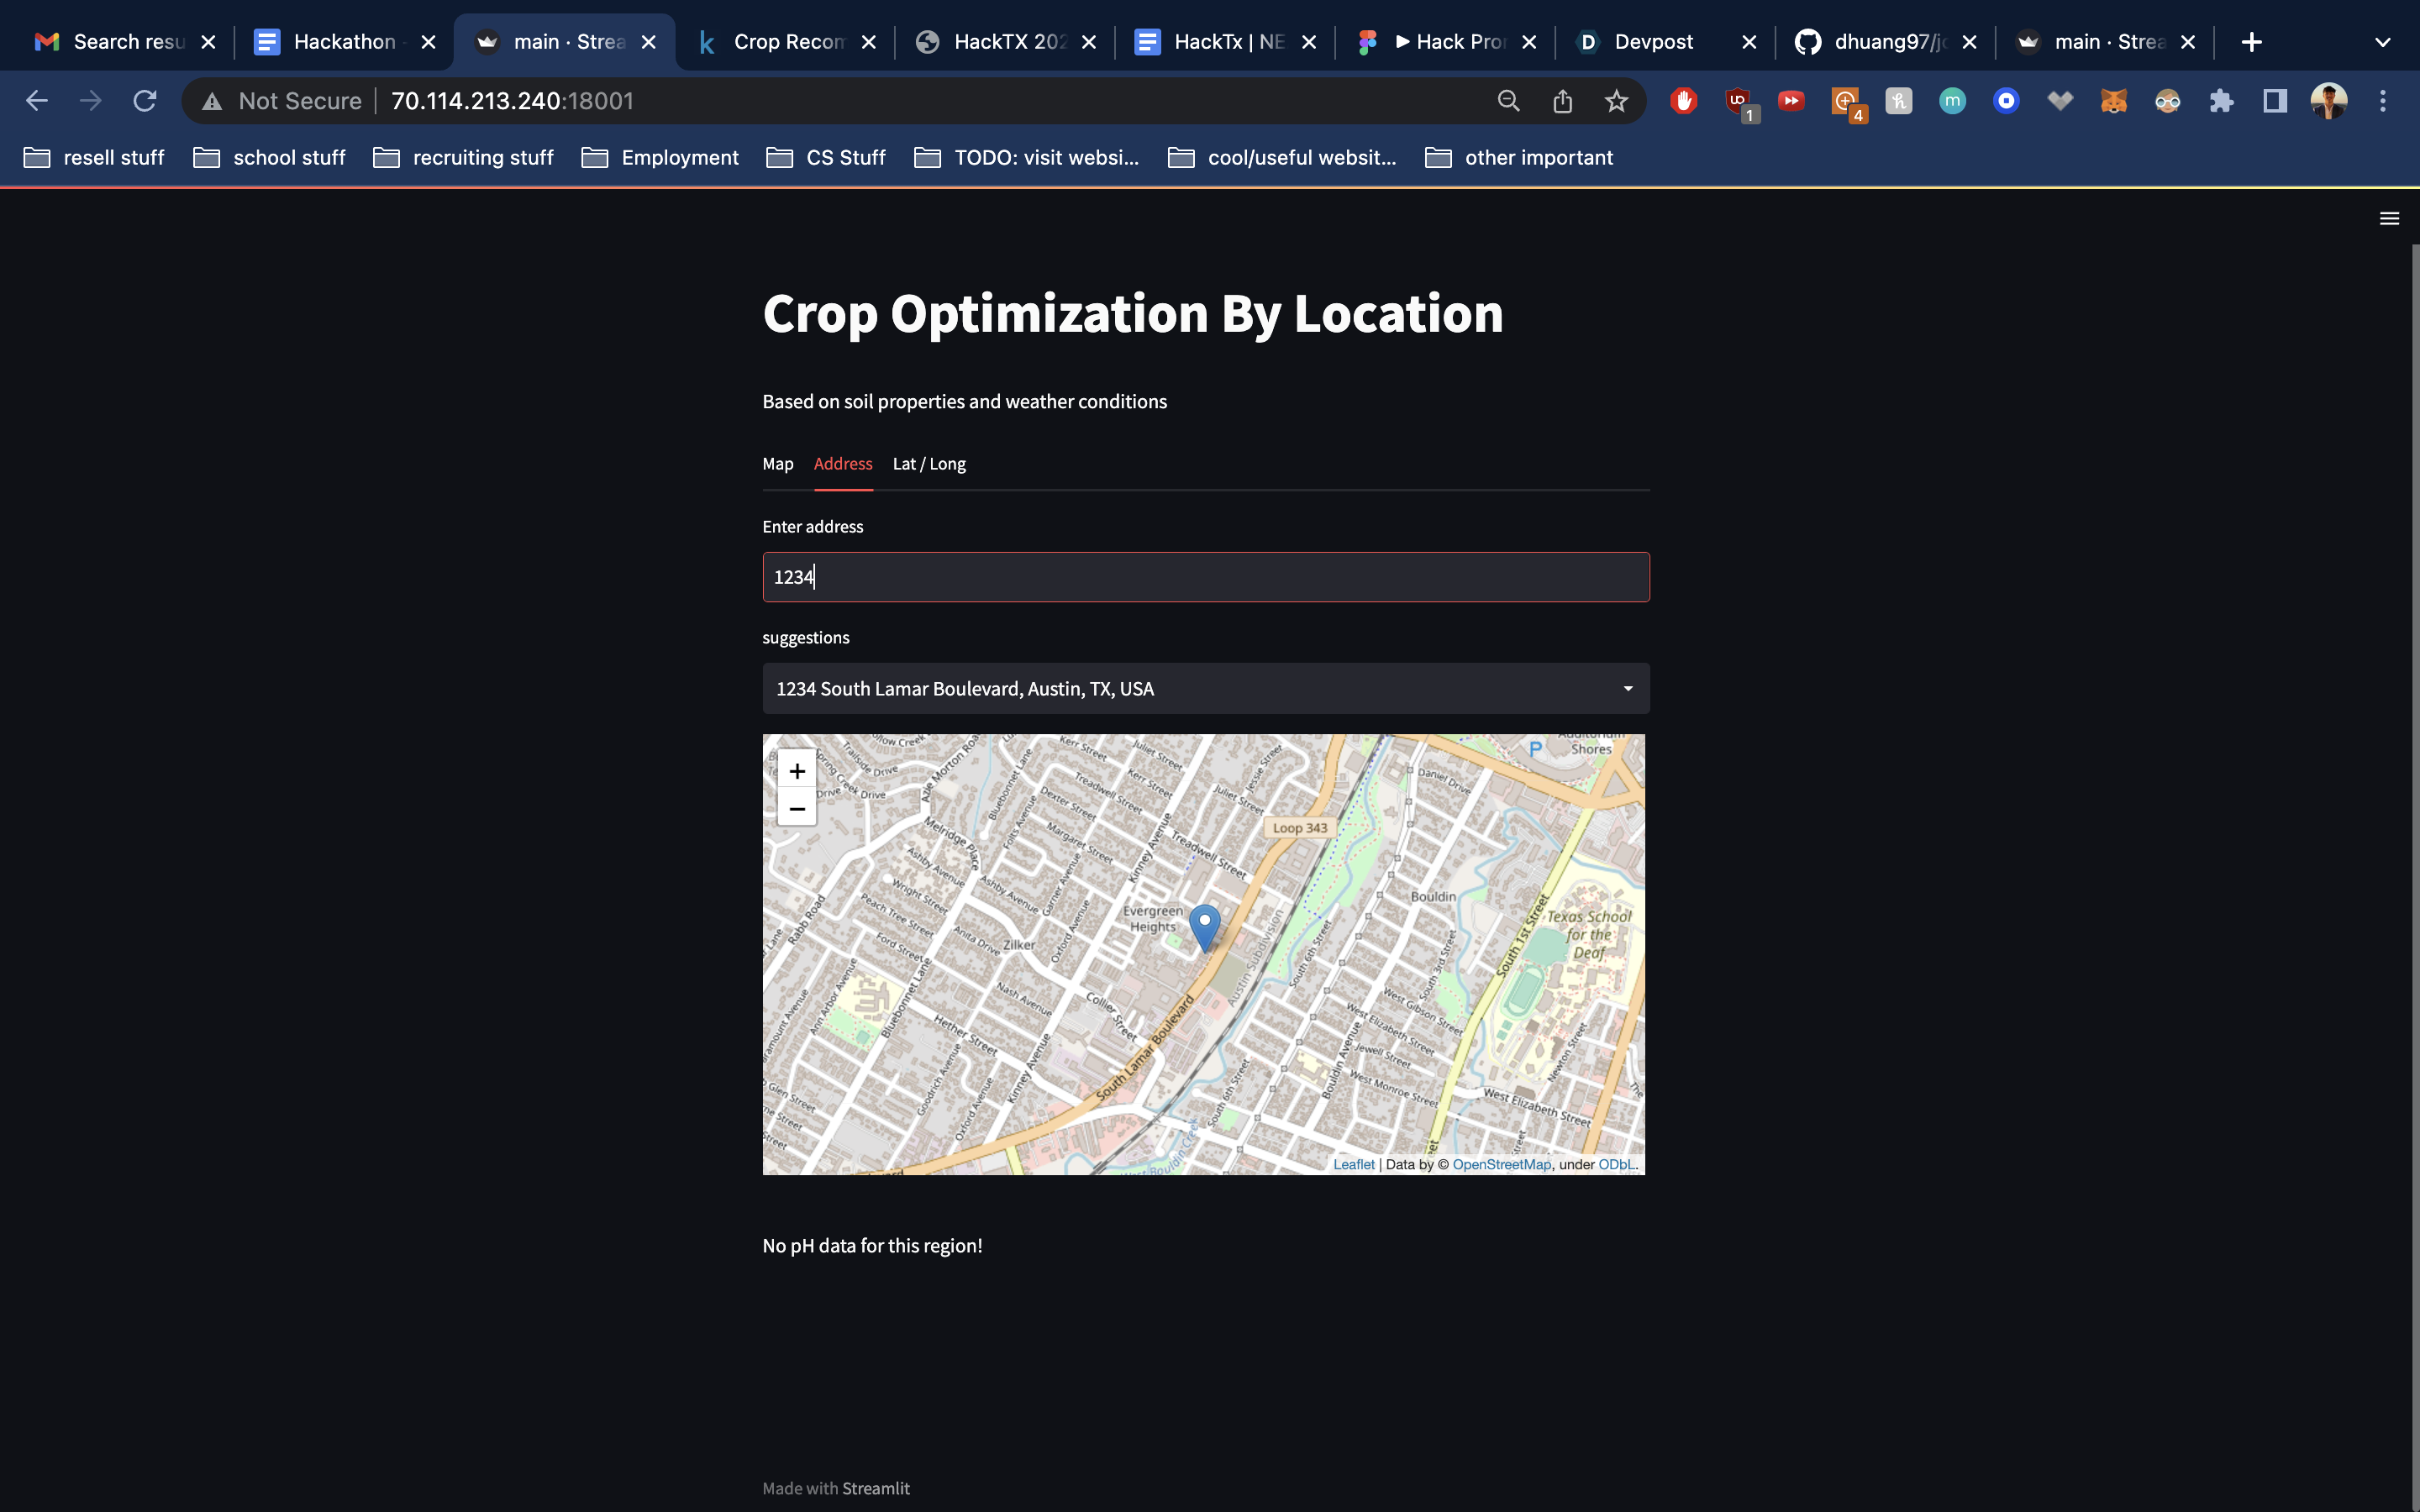
Inspiration
Inspired by the struggles farmers face in cultivating crops in tough and unpredictable environments, this project hopes to allow farmers a greater degree of knowledge and flexibility in choosing their crop types, fertilizers, pesticides, etc for land anywhere in the world. This allows for less wasted and uncultivated crops and smarter agricultural planning and development--taking a step forward in solving the exponentially growing demand for food that comes hand-in-hand with the ever-increasing world population.
What it does
This web application takes in global soil and weather data from multiple API's, connecting them together into one seamless user interface powered by an interactive map. Users enter input through 3 different channels: clicking on the map, typing an address, or entering latitude/longitude coordinates. A backend algorithm queries a dataset of agricultural properties, building a model that predicts the most optimal crop type to cultivate for that specific location. Users can click almost anywhere in the entire world and expect to receive a list of 3 recommended crops.
How we built it
We used python3 and a streamlit app framework to host our web application locally for development and testing. We used git version control and a remote GitHub repository in order to work effectively as a team. The various web API's we call from our backend (using the Python Requests library) include Ambee and Soil-Grid for weather/soil data and Google Maps and Folium for interactive, in-browser interactive map capabilities. The model built using this data calculates the mean squared difference between the API data and each of the thousands of references data points, outputting a final list of 3 recommended crops, sorted in descending order of soil/weather affinity for that particular location.
Challenges we ran into
We ran into several significant challenges finding and accessing the right API's, because a lot of them were paid and/or didn't have quality data. Finding the right agricultural dataset with the relevant agricultural properties we needed also took a lot of time, as we had to ensure the API's and dataset had enough corresponding data.
Accomplishments that we're proud of
We are proud of implementing a fully-functioning interactive map and suggestions for partially completed addresses. Our model also seems to work effectively, giving results that are plausible based on actual research into crops grown in various locations.
What we learned
We learned how to pass data from one API to another and implement various asynchronous components in Streamlit. We also learned that John Deere supports a huge variety of tech roles, including ML Ops, data catalyst, and many others.
What's next for Croptimization?
Improving our model accuracy and generalization is a possible area of improvement. Mean squared difference calculations are fast and practical, but introducing a machine learning model utilizing the k-nearest-neighbor algorithm through the sci-kit learn package would potentially provide results with more certainty. If we are able to run accuracy tests and figure out the optimal number of neighbors and weights for our particular dataset, this could potentially generate production-level consistency and results. We could also add more input data columns including soil nutrient levels, mineral composition, and rainfall--however, a limitation on these is the availability of API's.
Built With
- ambee-api
- folium-api
- google-maps
- makefile
- numpy
- python
- raspberry-pi
- soil-grid-api
- streamlit


Log in or sign up for Devpost to join the conversation.