Inspiration
Humanitarian organizations have limited funding, and deciding where resources are needed most isn't always straightforward. We wanted to use data to make funding patterns easier to understand and support better decision-making.
What it does
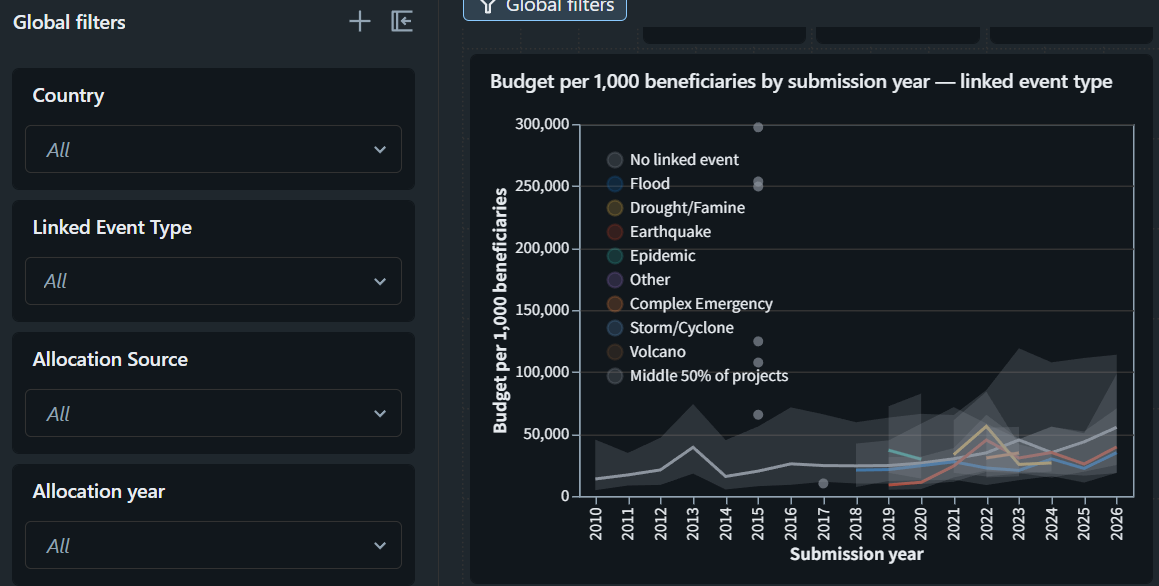
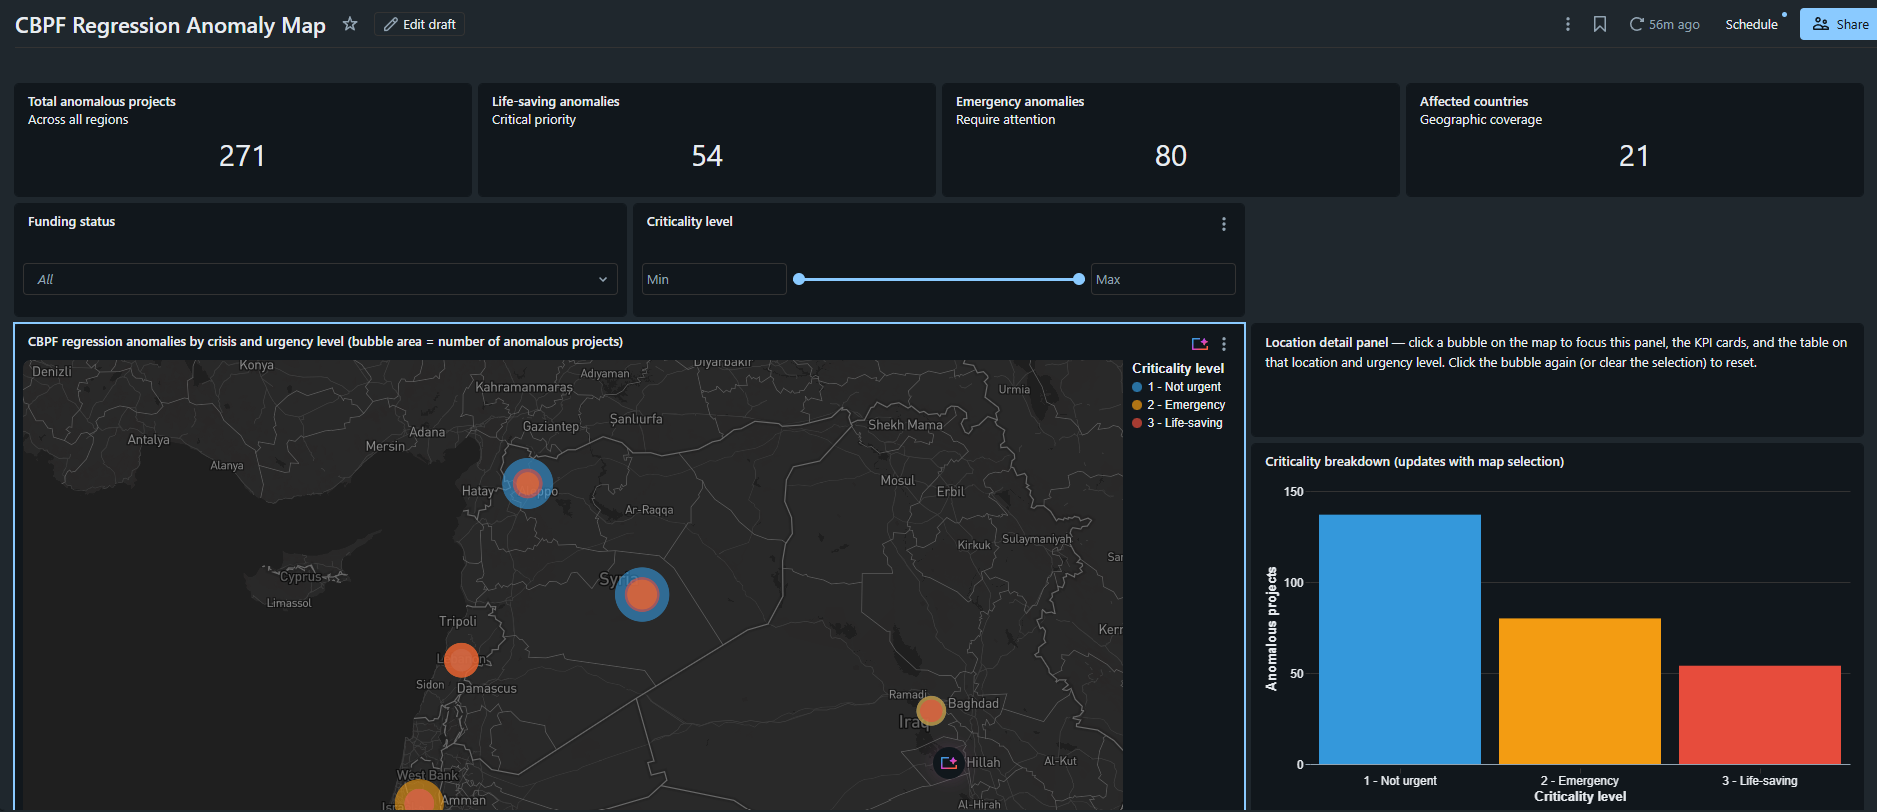
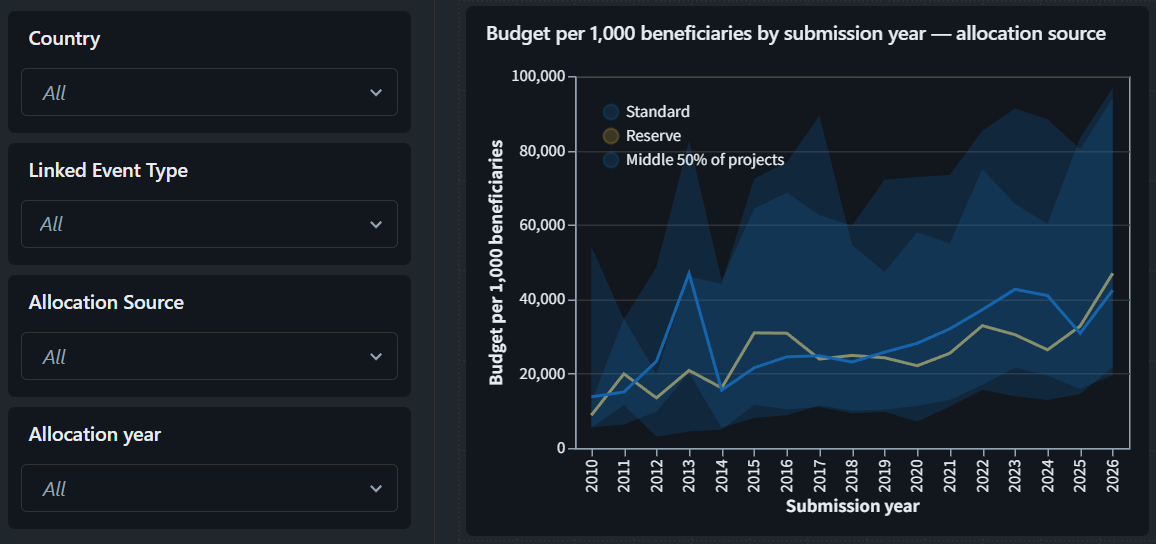
Smarter Humanitarian Fund Allocation helps users identify unusual beneficiary-to-budget ratios and compare similar humanitarian projects. It also provides an interactive map to highlight potential gaps between crisis severity and humanitarian funding.
How we built it
We used Python and Pandas to clean and analyze humanitarian project, disaster, and funding data. We classified projects by crisis type using text analysis, calculated statistical benchmarks, and built interactive visualizations to explore funding patterns.
Challenges we ran into
One major challenge was dealing with missing information, especially the lack of explicit crisis-type labels. We also had to figure out how to identify unusual funding patterns without making misleading comparisons between very different projects.
Accomplishments that we're proud of
We're proud of turning complex humanitarian data into interactive tools that make funding patterns easier to explore. Our two features provide both project-level benchmarks and a broader view of geographic funding gaps.
What we learned
We learned that understanding the data and choosing meaningful comparisons are just as important as building the analysis itself. We also realized that statistical anomalies don't always indicate real-world problems, so providing context is essential.
What's next
We'd like to improve our crisis classification accuracy and incorporate more detailed data on humanitarian needs and project outcomes. We also hope to add more interactive features to make the tools more useful for humanitarian decision-making.
Built With
- databrick
- python
