-
Home Page
-
Time Line
-
Jean Trends
-
Classifier


Inspiration
From the 1950s to today, jeans have remained a timeless symbol of style and self-expression in pop culture. In this project, we explore the world of denim, analyzing how different styles of jeans have trended across decades. Whether you're a fashion enthusiast or just curious about your closet, our tool brings the history of denim to your fingertips!
What it does
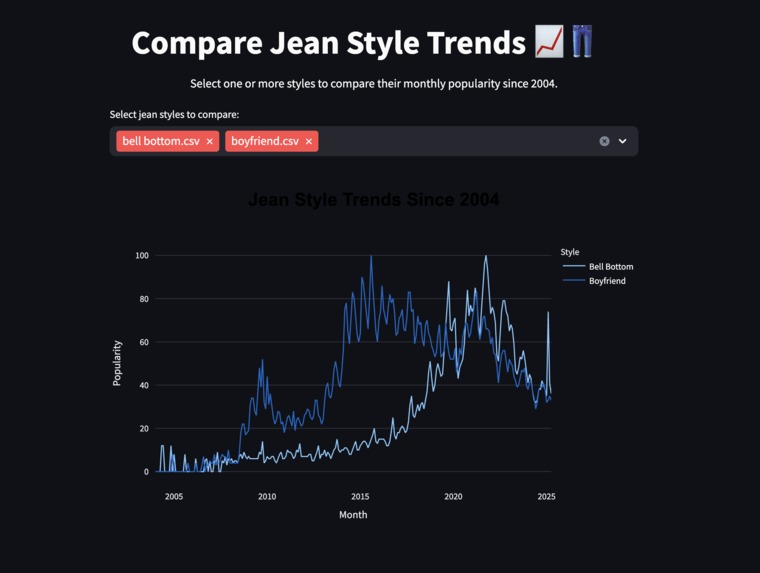
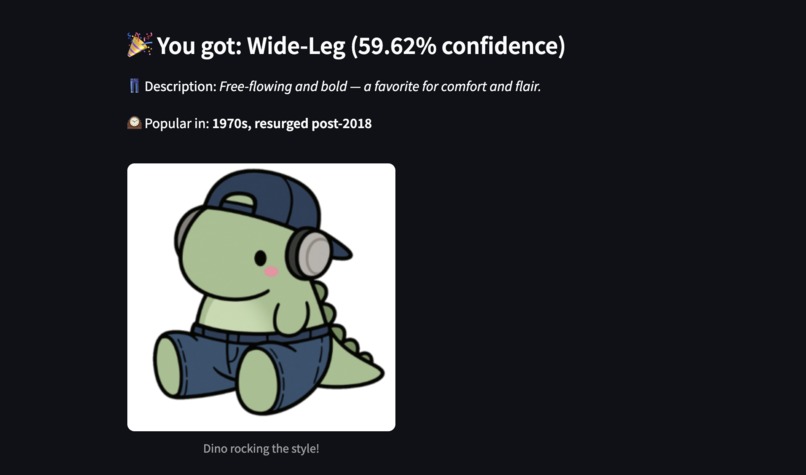
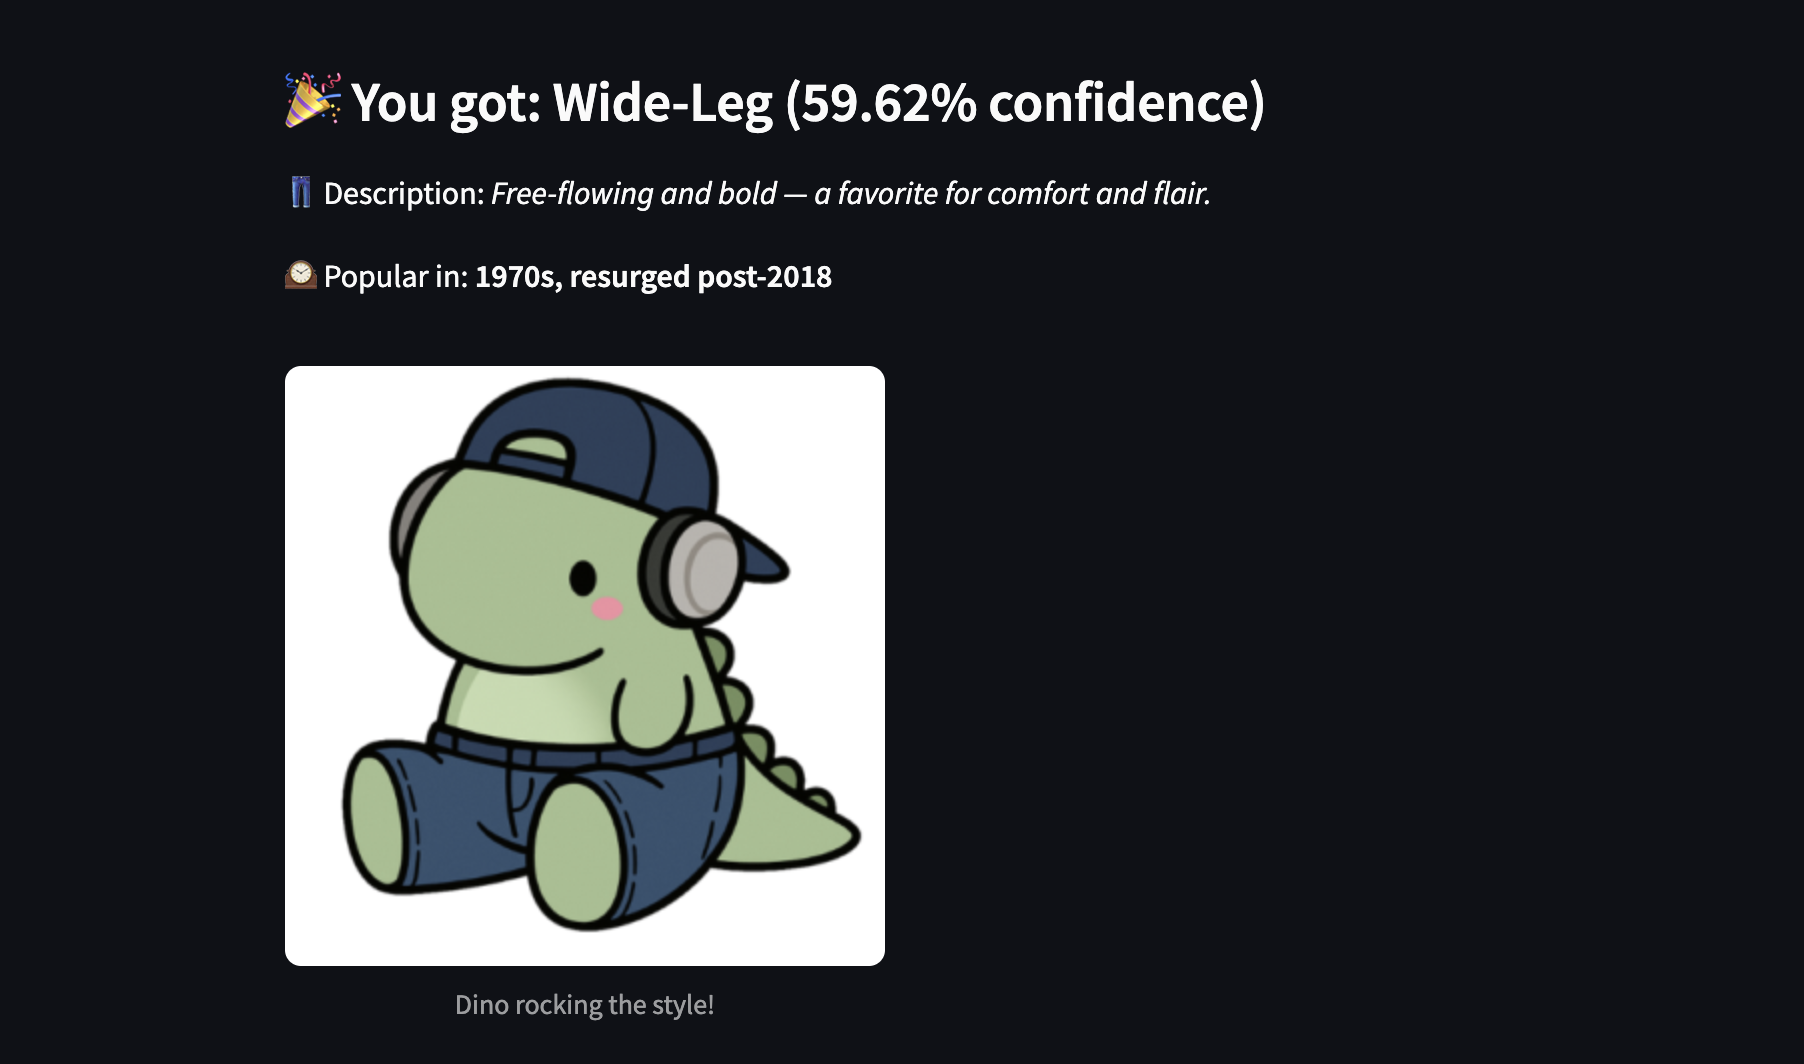
Jean-O-Type helps people identify what type of jeans they are wearing and associates it with the decade it was most popular in. Users upload a photo of their jeans and the app classifies them into one of five fits (Skinny, Straight, Bootcut, Baggy, or Wide-Leg) along with a description of the style and its peak era. The app also includes an interactive trend explorer that visualizes Google Trends data for each jean style since 2004, so you can see exactly when your fit had its moment.
How we built it
Tech Stack
- Framer: landing page and overall website design
- Streamlit: interactive web app for the classifier and trend explorer
- TensorFlow/Keras: model training and inference (MobileNetV2 fine-tuned on 5 jean categories)
- torchvision: data augmentation (random flips, rotations, color jitter, random crops)
- Plotly: interactive trend visualization
- pandas: dataset assembly and label parsing from Hollister, Levi's, and Lucky Brand product listings
Our dataset was assembled by scraping product listings from Hollister, Levi's, and Lucky Brand, giving us ~900 labeled jean images across five categories. We wrote custom name-parsing logic to map product names like "relaxed fit" or "barrel leg" to the correct fit category. Since some categories had far fewer examples, we used augmentation to bring each class up to 300 images. We then fine-tuned a MobileNetV2 backbone pretrained on ImageNet, adding a GlobalAveragePooling layer, a Dropout layer, and a 128-unit dense head before the 5-class softmax output. For the trends page, we pulled Google Trends data for each style and visualized it with Plotly.
Challenges we ran into
We ran into challenges with the customization of the website. We also faced difficulty in the data collection phase. Product listings didn't always use clean, standardized fit names, so we had to write brand-specific parsing rules to correctly label each item. Class imbalance was another hurdle, with wide-leg jeans significantly underrepresented. That's why we incorporated augmentation to level the playing field.
Accomplishments that we're proud of
We were proud of being able to build an end-to-end machine learning pipeline (everything from raw web-scraped product data to a deployed, interactive classifier) within the duration of the hackathon. We're also proud of the trend visualization feature and the UI/UX for the deployed site.
What we learned
We learned about the full machine learning lifecycle: data collection and cleaning, handling class imbalance, transfer learning with a pretrained CNN, model evaluation, and deployment. We also got hands-on experience combining multiple tools (Framer, Streamlit, TensorFlow, Plotly) into a cohesive product under time pressure.
What's next for Jean-O-Type
We hope to add more information about each type of jean and help people understand the history behind their clothing. On the technical side, we'd like to expand the dataset with more brands and improve accuracy on harder cases like wide-leg vs. baggy. We also want to integrate the Framer landing page and Streamlit app more, and potentially add a feature that links users to where they can shop their identified style.

Log in or sign up for Devpost to join the conversation.