Summary
Jax Affordability Index is a data-driven tool that measures and visualizes neighborhood-level affordability across Jacksonville to help residents, policymakers, and planners understand and address urban inequality.
Inspiration
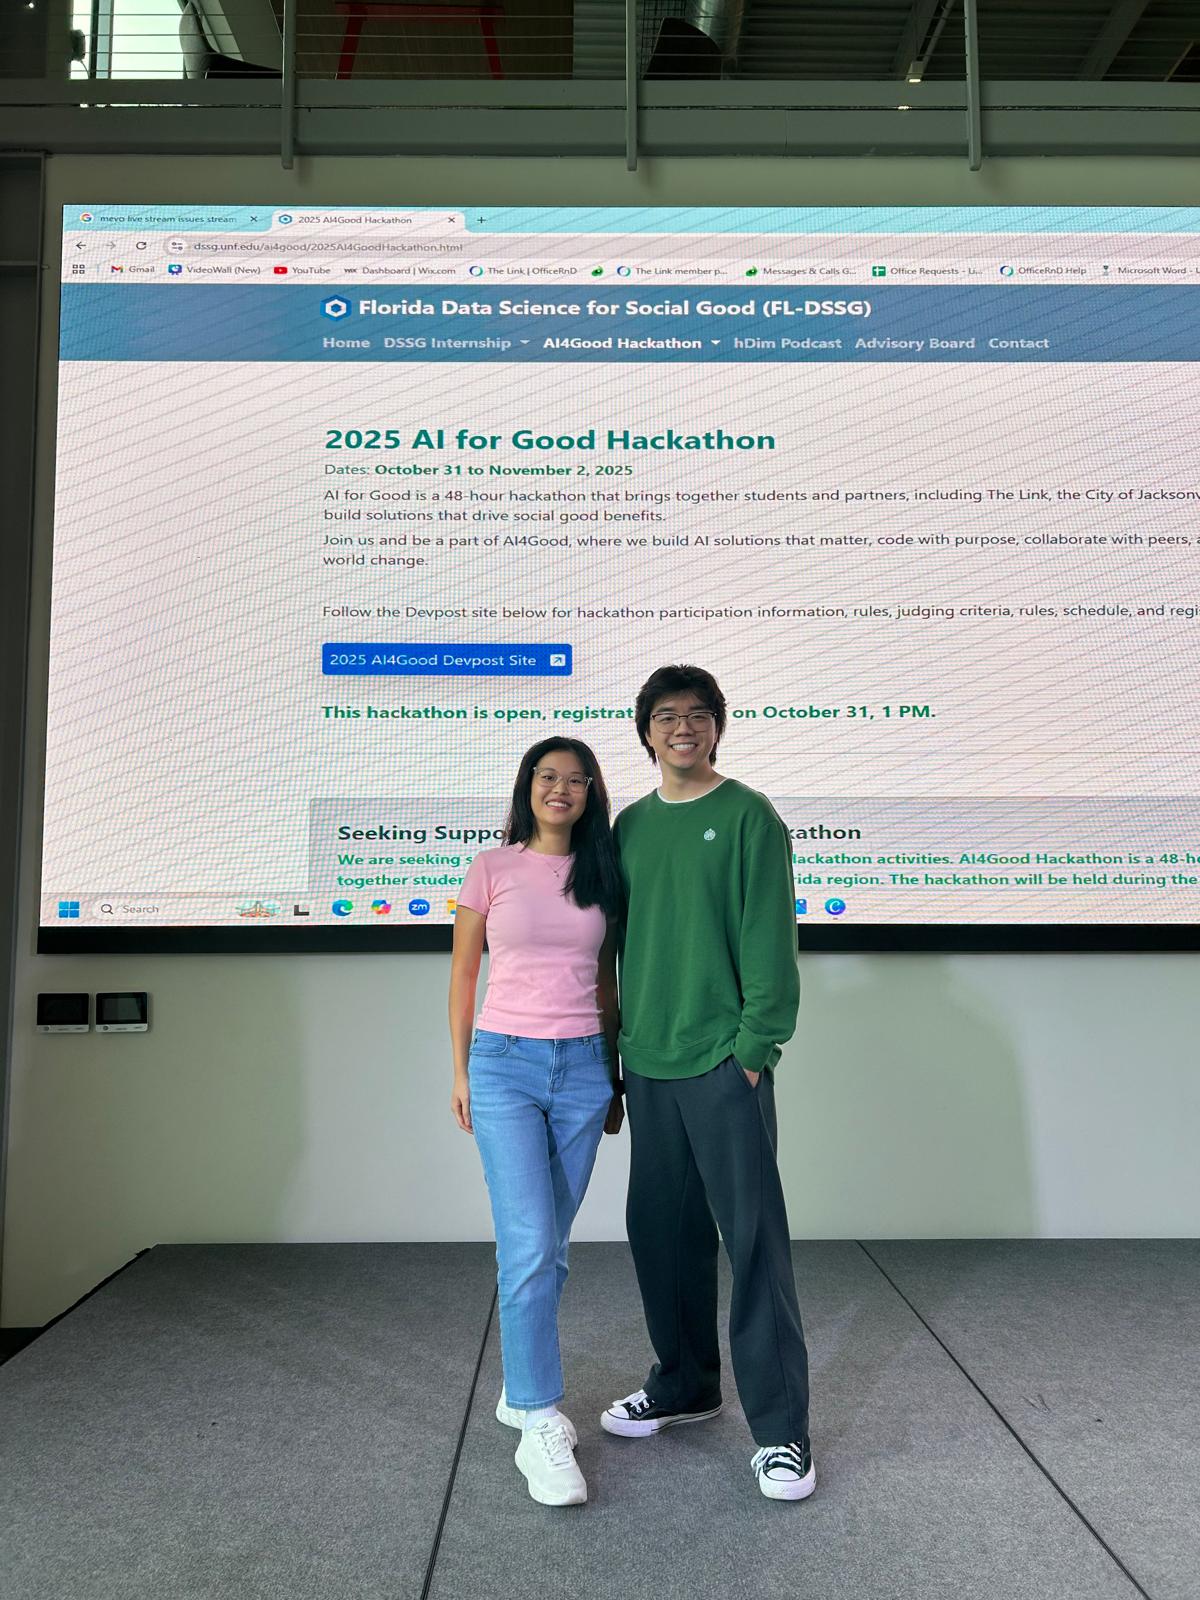
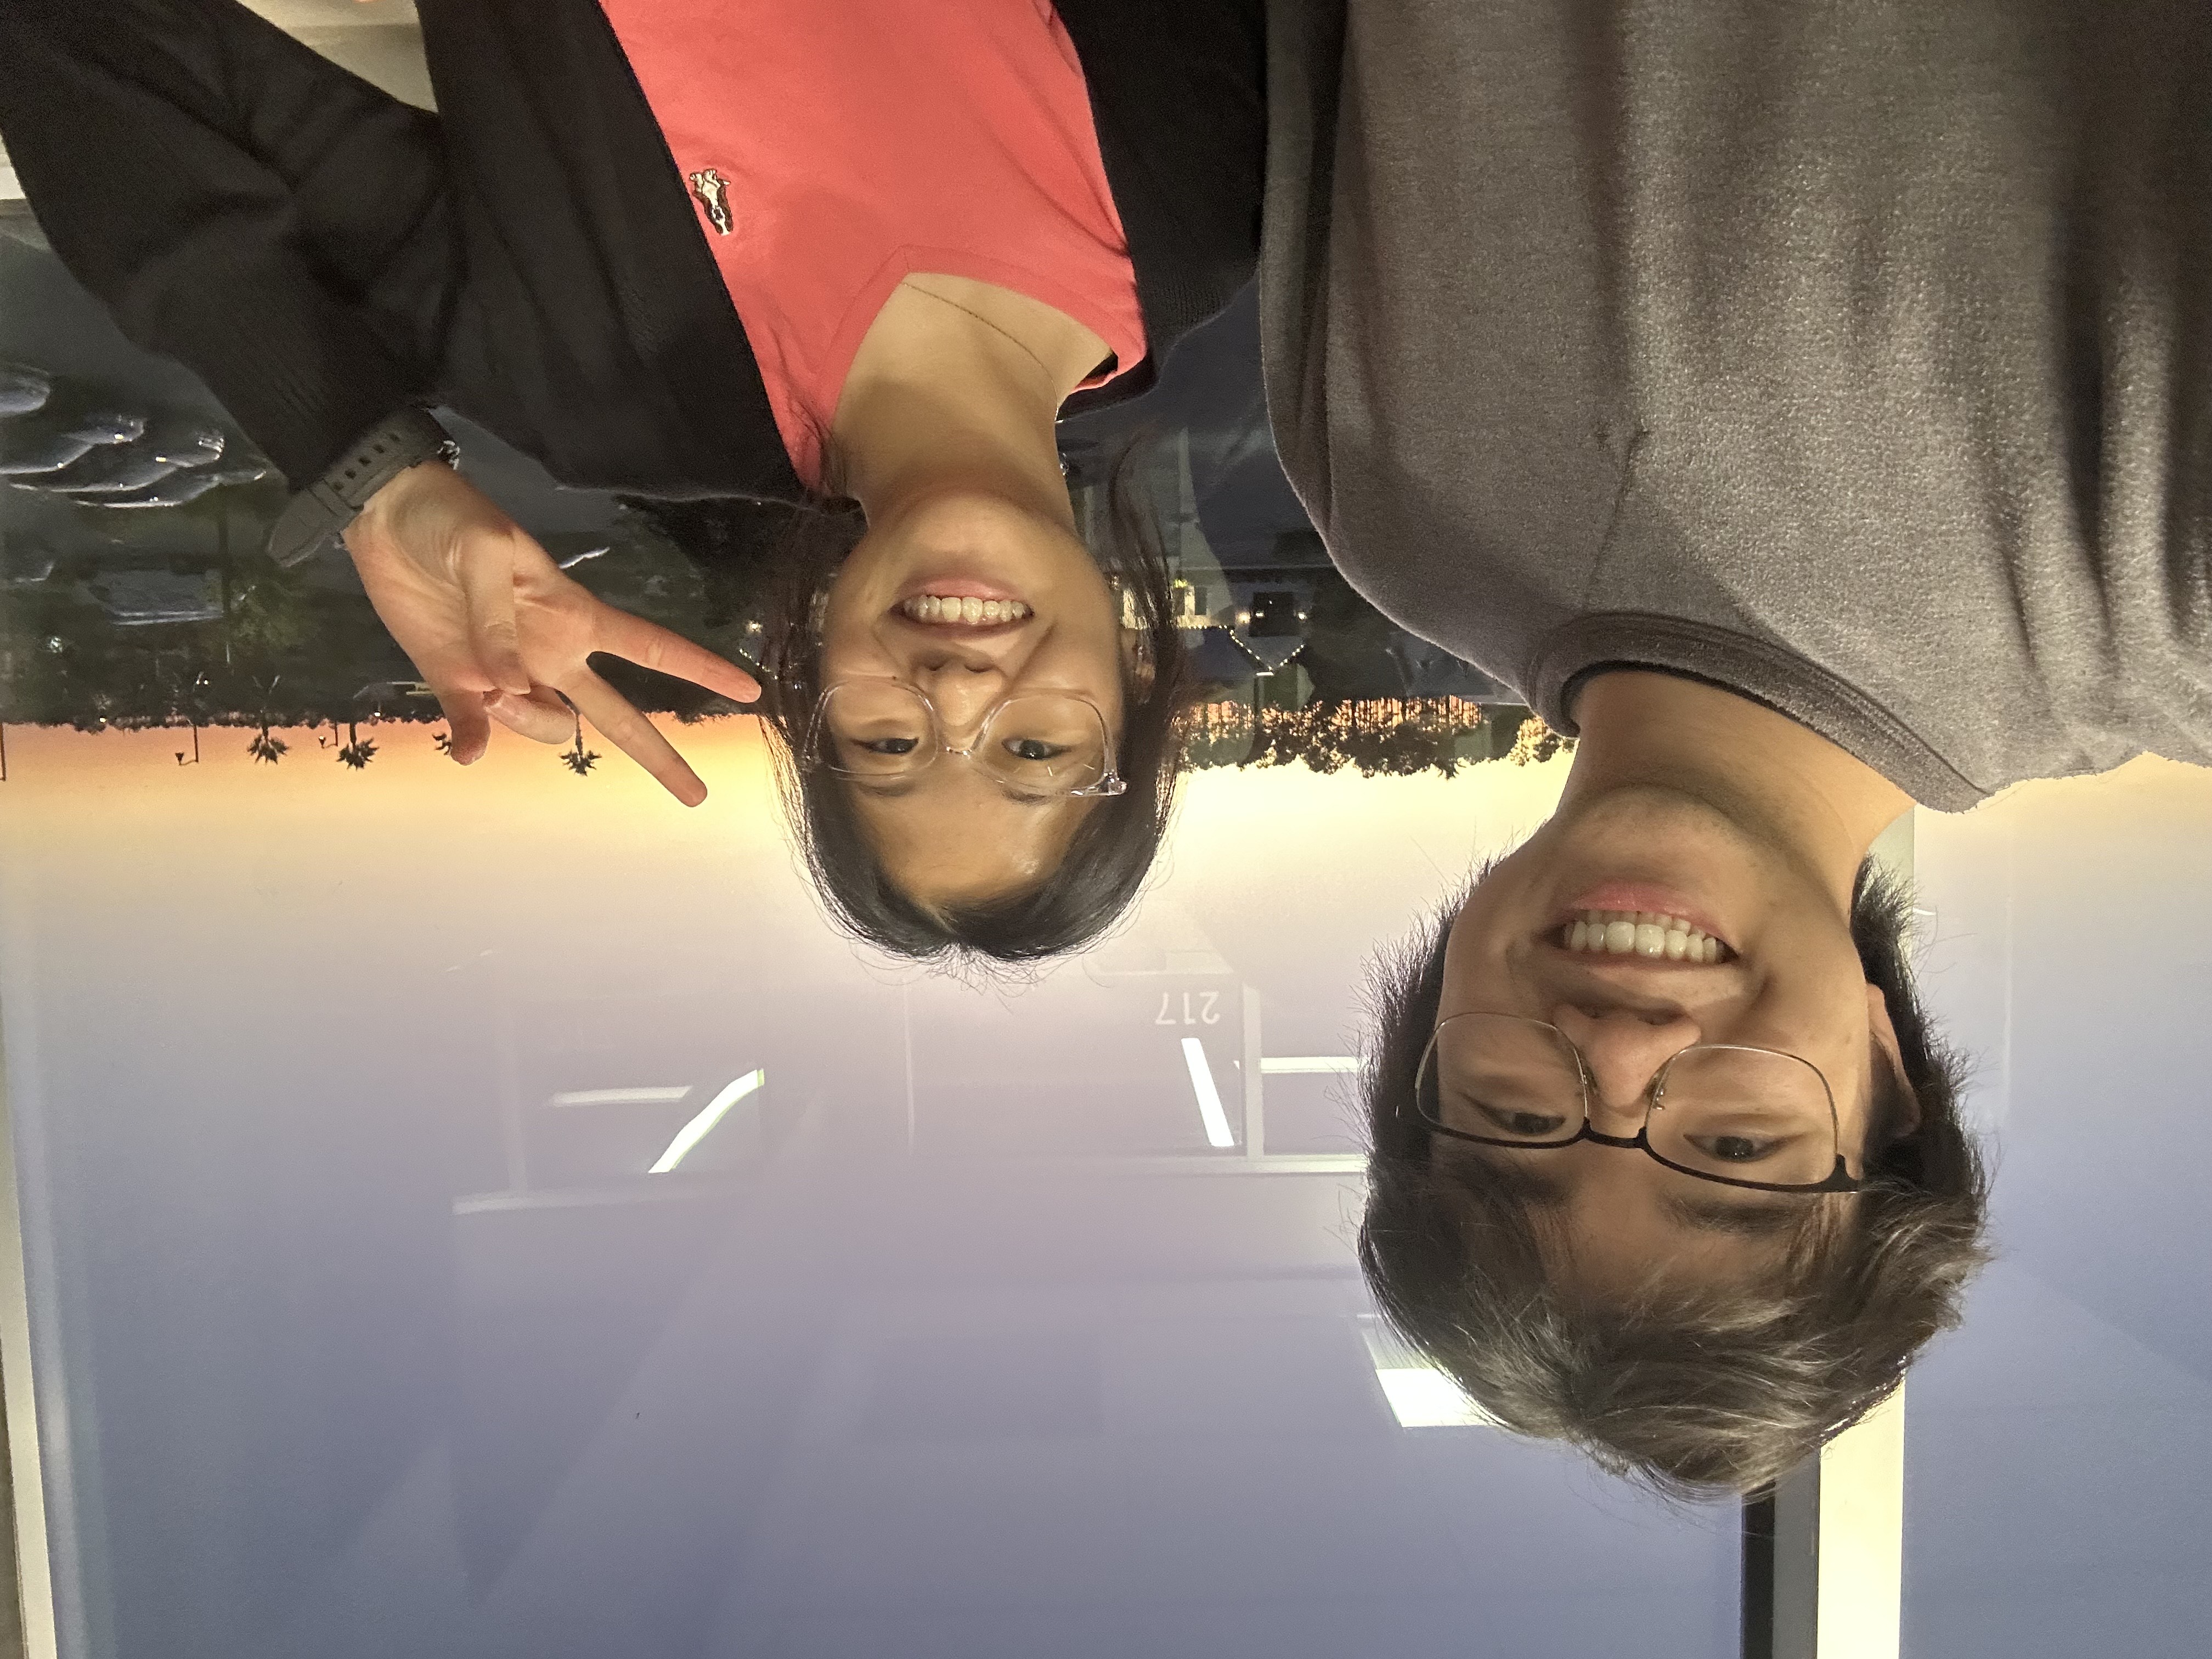
As residents of Jacksonville, we wanted to better understand the city we live in based on its strengths, its challenges, and how affordability varies across neighborhoods. Housing and transportation costs are only part of the picture. Accessibility, walkability, and income all play major roles in shaping how affordable life truly is in each area. Our goal was to build a data-driven Affordability Index to help visualize and compare affordability patterns across the city and surrounding tracts.
What It Does
The Jax Affordability Index combines city-level and tract-level data to create an overall score representing the relative affordability of different areas in Jacksonville. We designed an interactive dashboard that displays these results visually, helping users identify which neighborhoods are more or less affordable, how accessibility affects affordability, and clusters of similar affordability patterns using K-Means clustering.
Challenges We Faced
We faced several challenges throughout the project. Since it was our first time working with geospatial and city-level data, we had to quickly learn how to handle and visualize complex datasets. Aligning different data sources by GEOID and managing missing or inconsistent entries required careful cleaning and validation. Applying K-Means clustering in a meaningful way for urban data also took experimentation and iteration to ensure our results reflected real-world patterns. Finally, we had to balance the technical aspects of analysis with designing an effective visualization and all within the limited time of the hackathon.
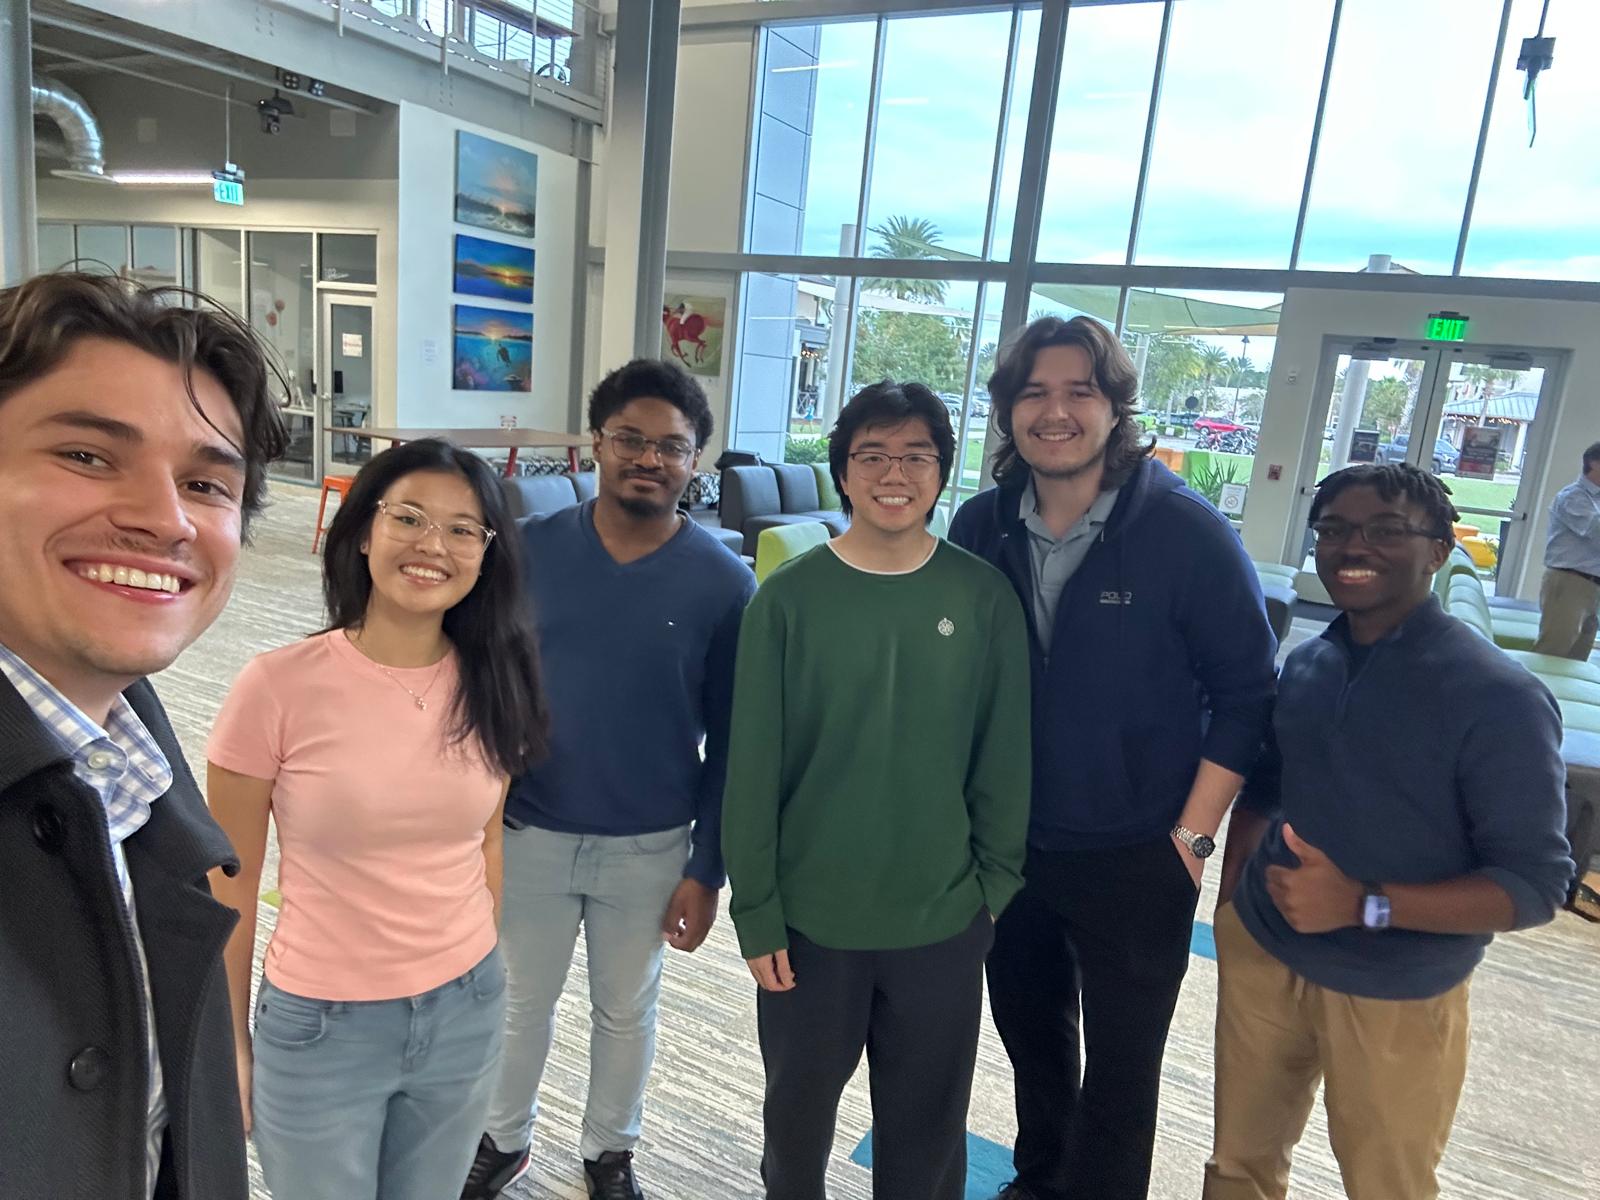
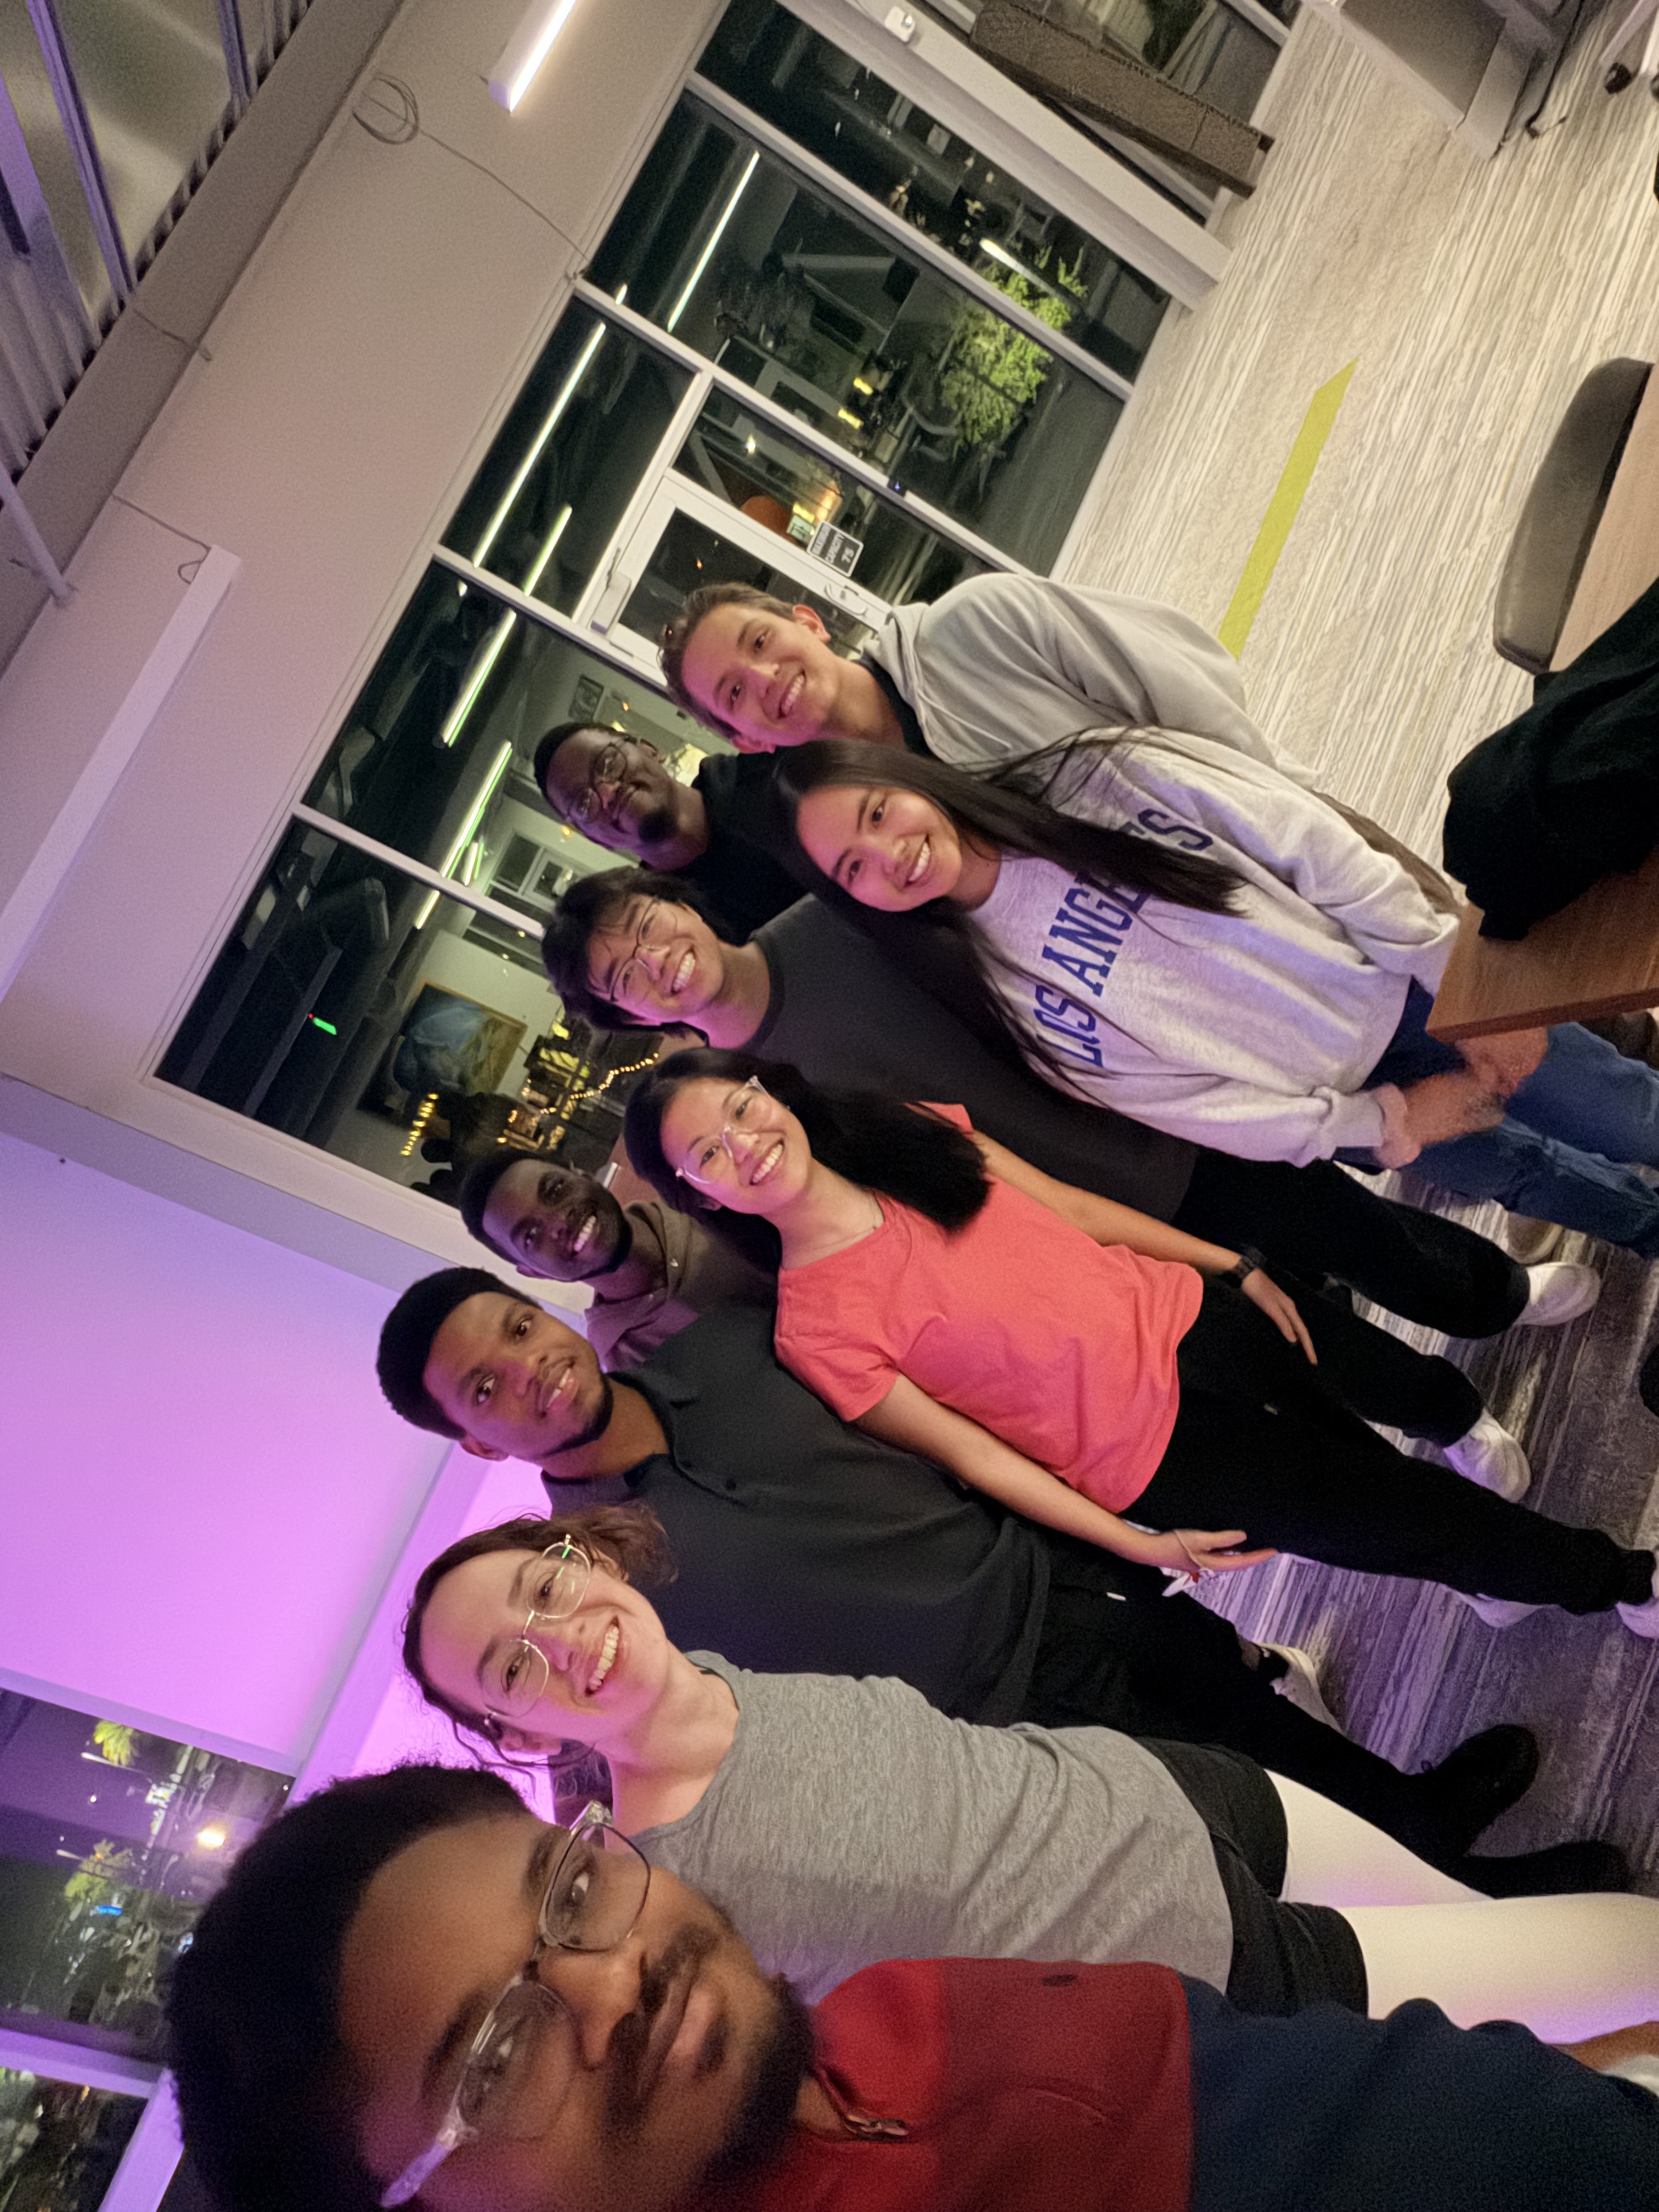
What helped us most was the support and guidance from other teams, mentors, and professors. Collaborating, sharing insights, and learning from each other’s perspectives made a huge difference, especially when solving data or modeling issues we had never encountered before.
What We Learned
Beyond technical skills, we learned the value of community and collaboration. We met incredible professors, mentors, and peers who generously shared their expertise, offered feedback, and inspired us to keep improving. The collaboration, guidance, and encouragement we received turned this project from an idea into a shared achievement and inspired us to keep using data for good. We also gained a deeper appreciation for how interdisciplinary city analysis is by combining data science, urban studies, and human impact. The hackathon became more than a competition; it was a chance to grow together, exchange ideas, and build something meaningful for our city.
What’s Next
In the future, we plan to add more variables to our index, including housing costs, transportation access, and employment data, to provide a more complete picture of affordability. We also aim to expand beyond Jacksonville and apply our model to other cities across Florida to identify regional patterns and differences. Additionally, we hope to refine our model by incorporating weighted metrics and gathering community feedback to ensure that the results better reflect real-world experiences. Finally, we plan to integrate real-time or API-based data updates, transforming our dashboard into a live affordability tracker that can evolve alongside the city itself.
Built With
- anaconda
- claude
- python
- spyder

Log in or sign up for Devpost to join the conversation.