-

Thumbnail
-
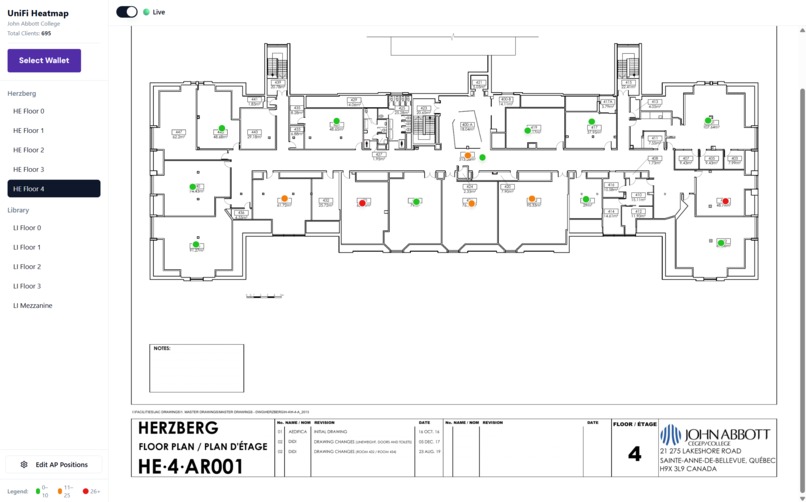
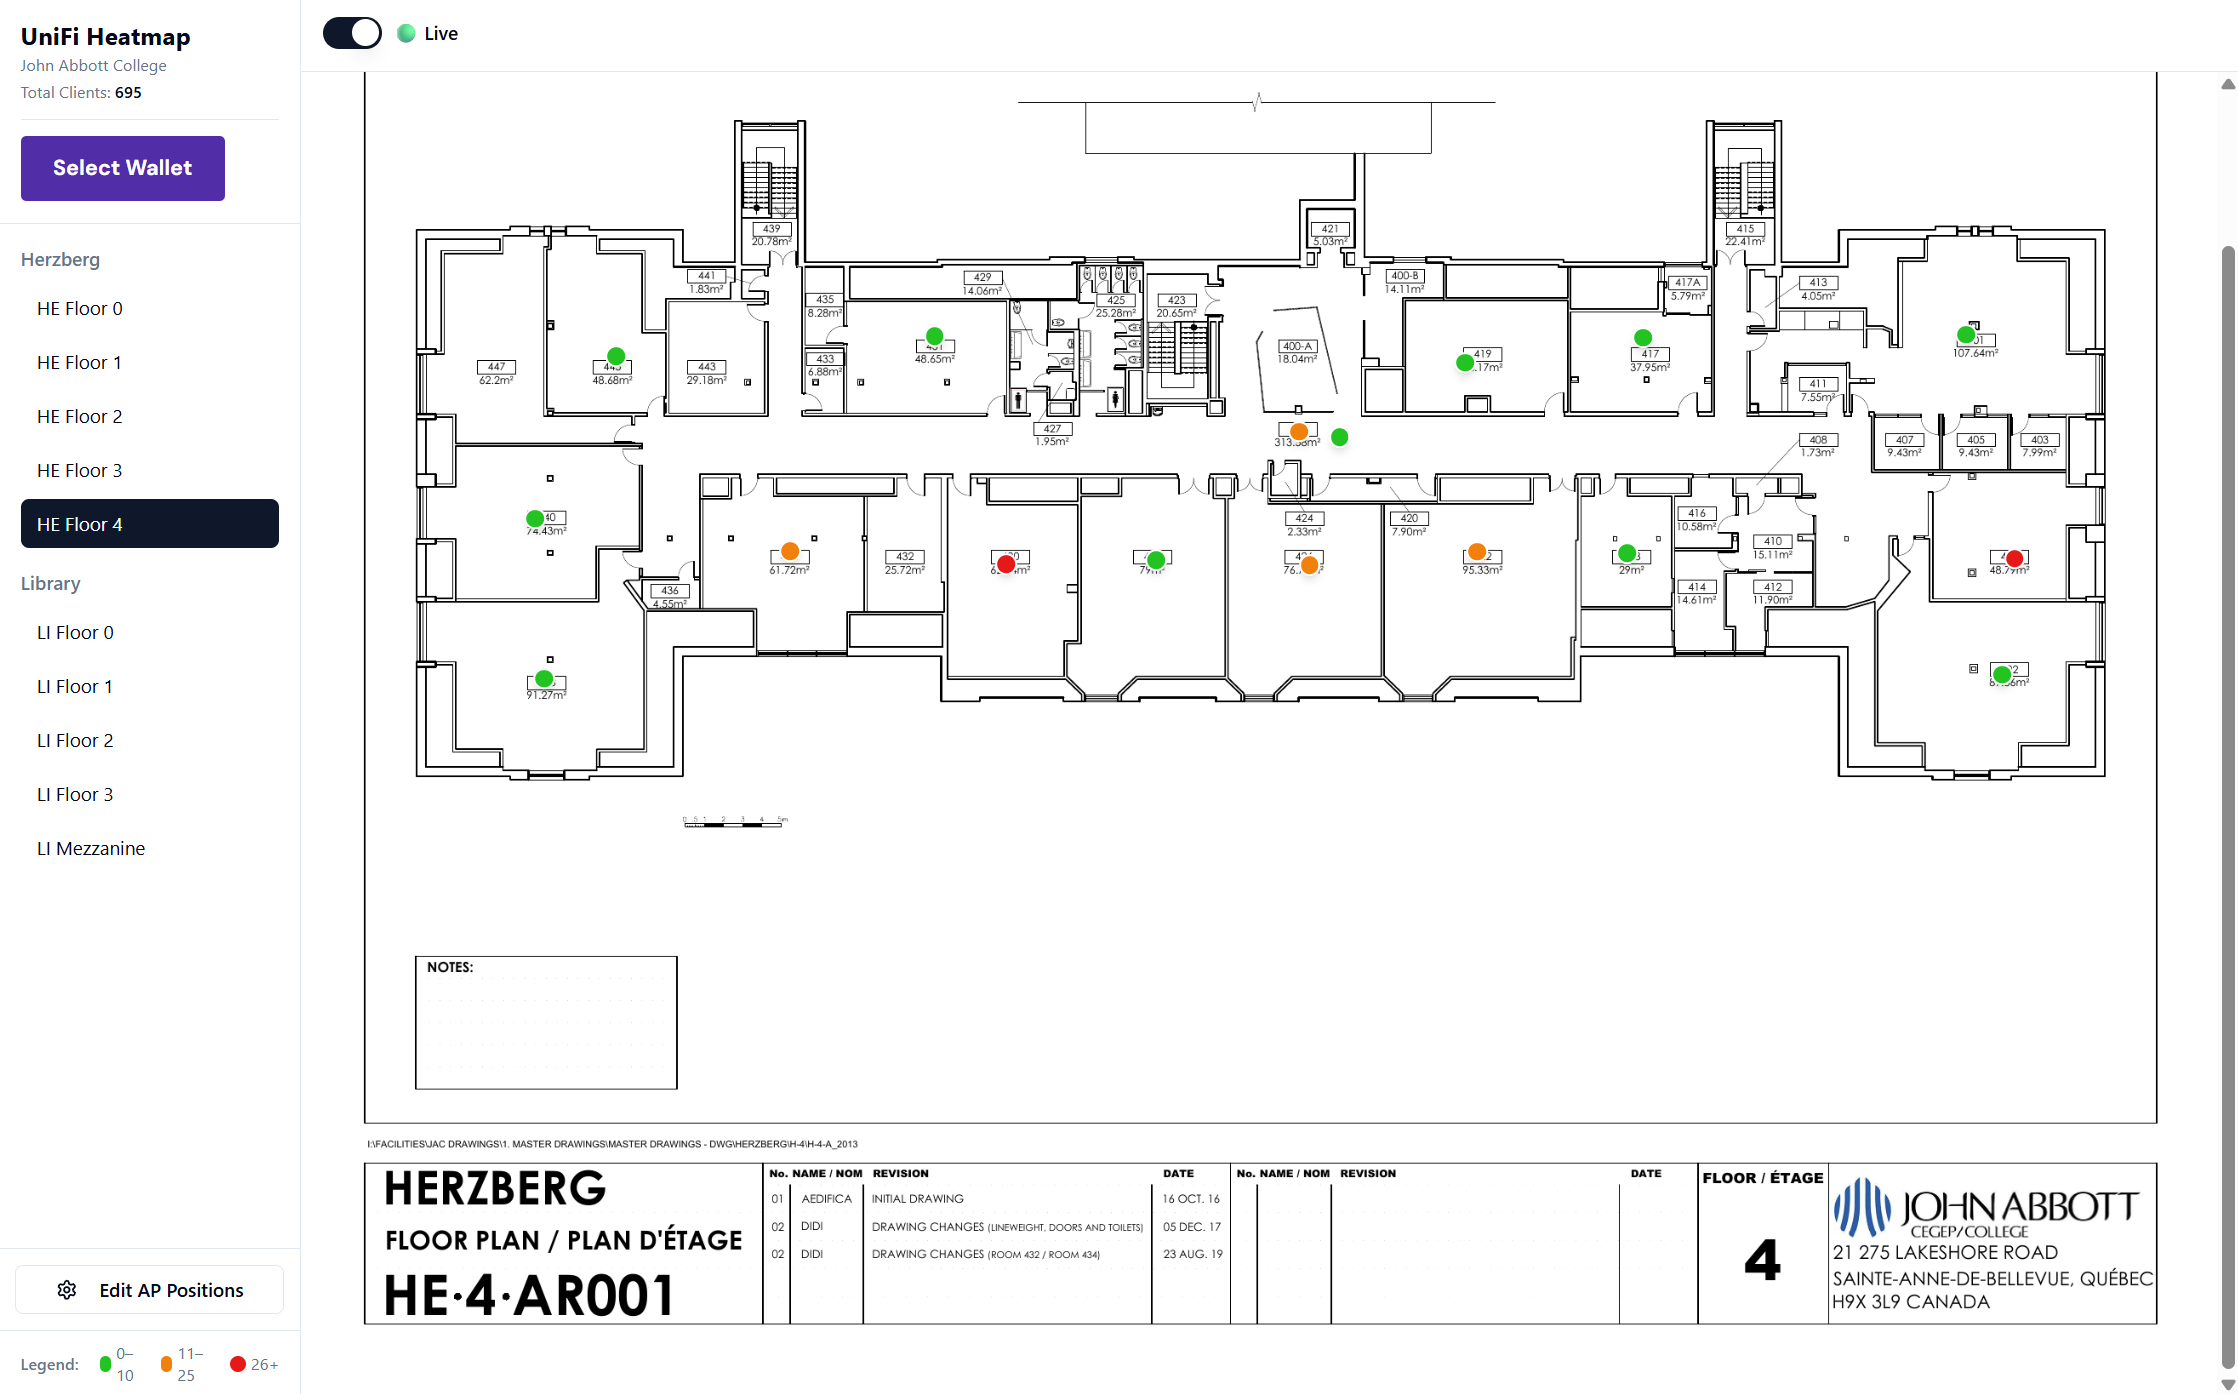
This campus has thousands of students moving between buildings every day, but we rarely have real‑time insight into how spaces are actually being used. During events, exams, or peak study hours, it’s almost impossible to know which areas are crowded and which ones are free.
At the same time, every student device connects to Wi‑Fi meaning the network already has the data needed to understand occupancy patterns. That sparked the idea: What if we could turn UniFi wireless client data into a live heatmap of campus activity?
This project aims to visualize how people move through the Library and Herzberg buildings using only anonymized wireless client counts. No personal data, no tracking — just aggregate numbers mapped to rooms.


Log in or sign up for Devpost to join the conversation.