Inspiration
When working with the team as a scrum master or project manager it happens that some issues take longer to deliver then others and we need to see retrospectively where was a problem.
There is Time in a status gadget which is great for analyzing average time in status on high level (project) but when investigating causes of some of the statuses taking too long we need to look on the issue level.
Was issue too long in Code review? Or in testing? To figure out we would need to go through issue history and that might take a long time 😓
What it does
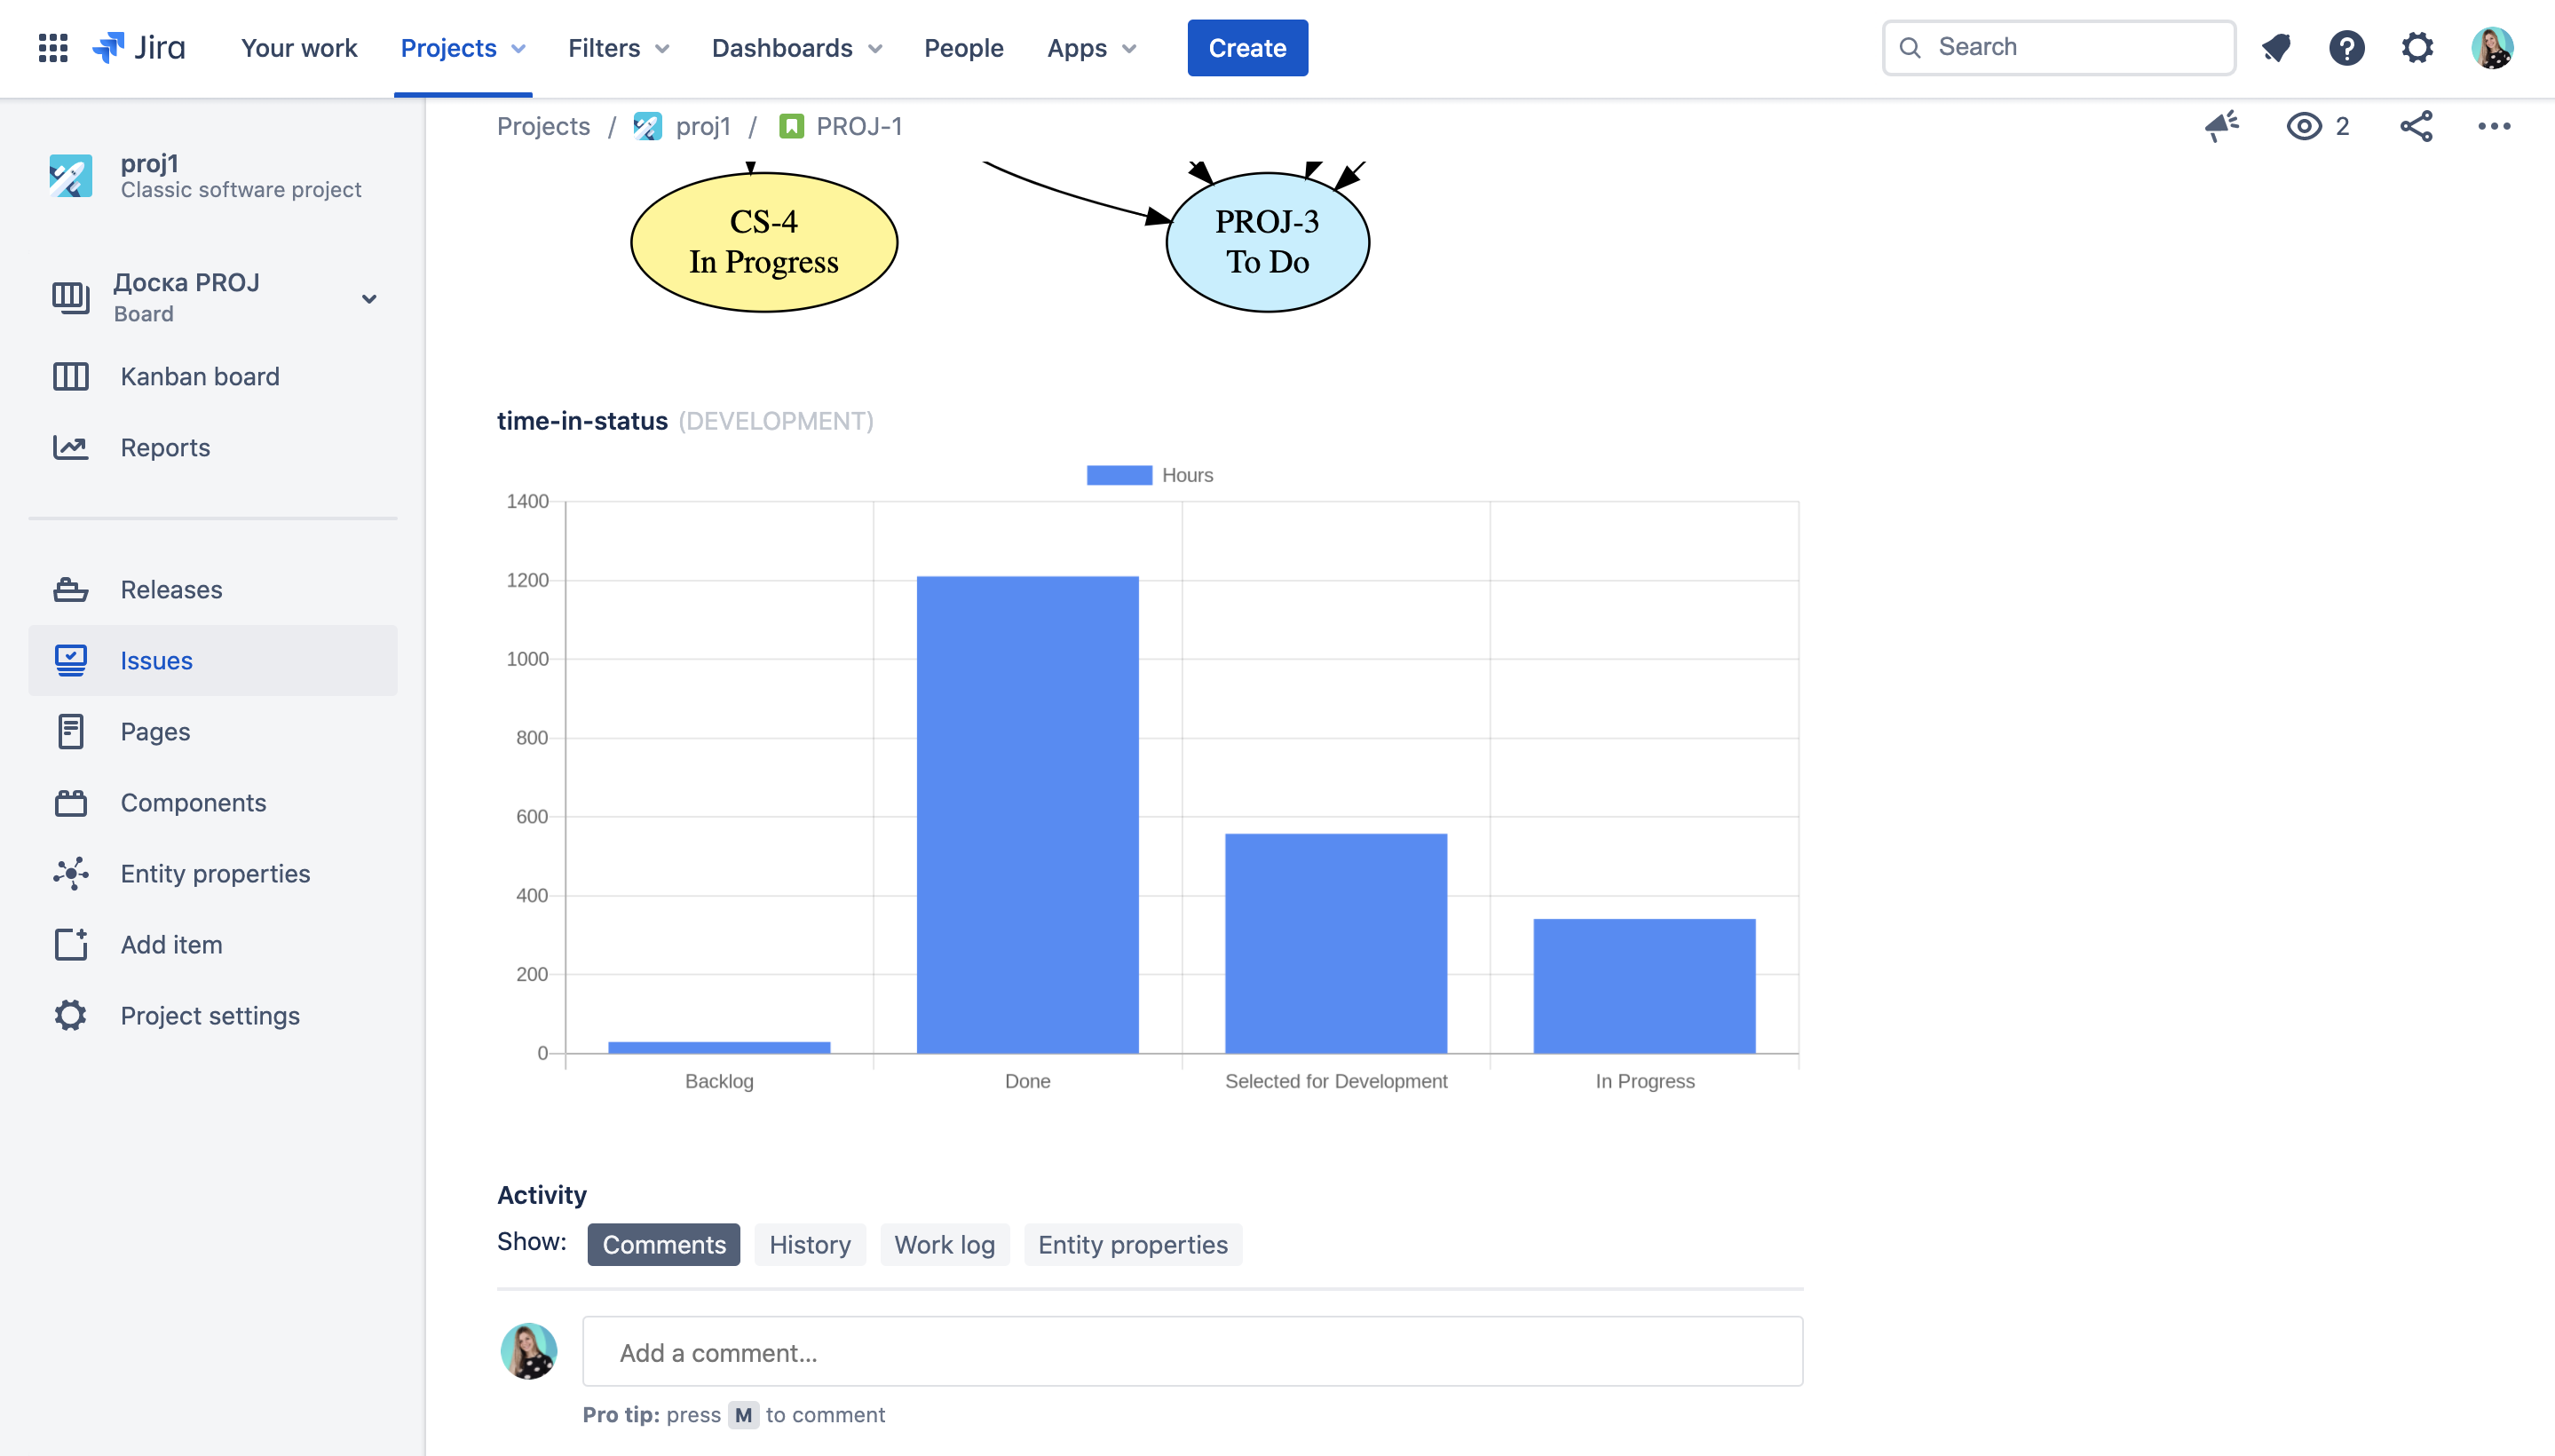
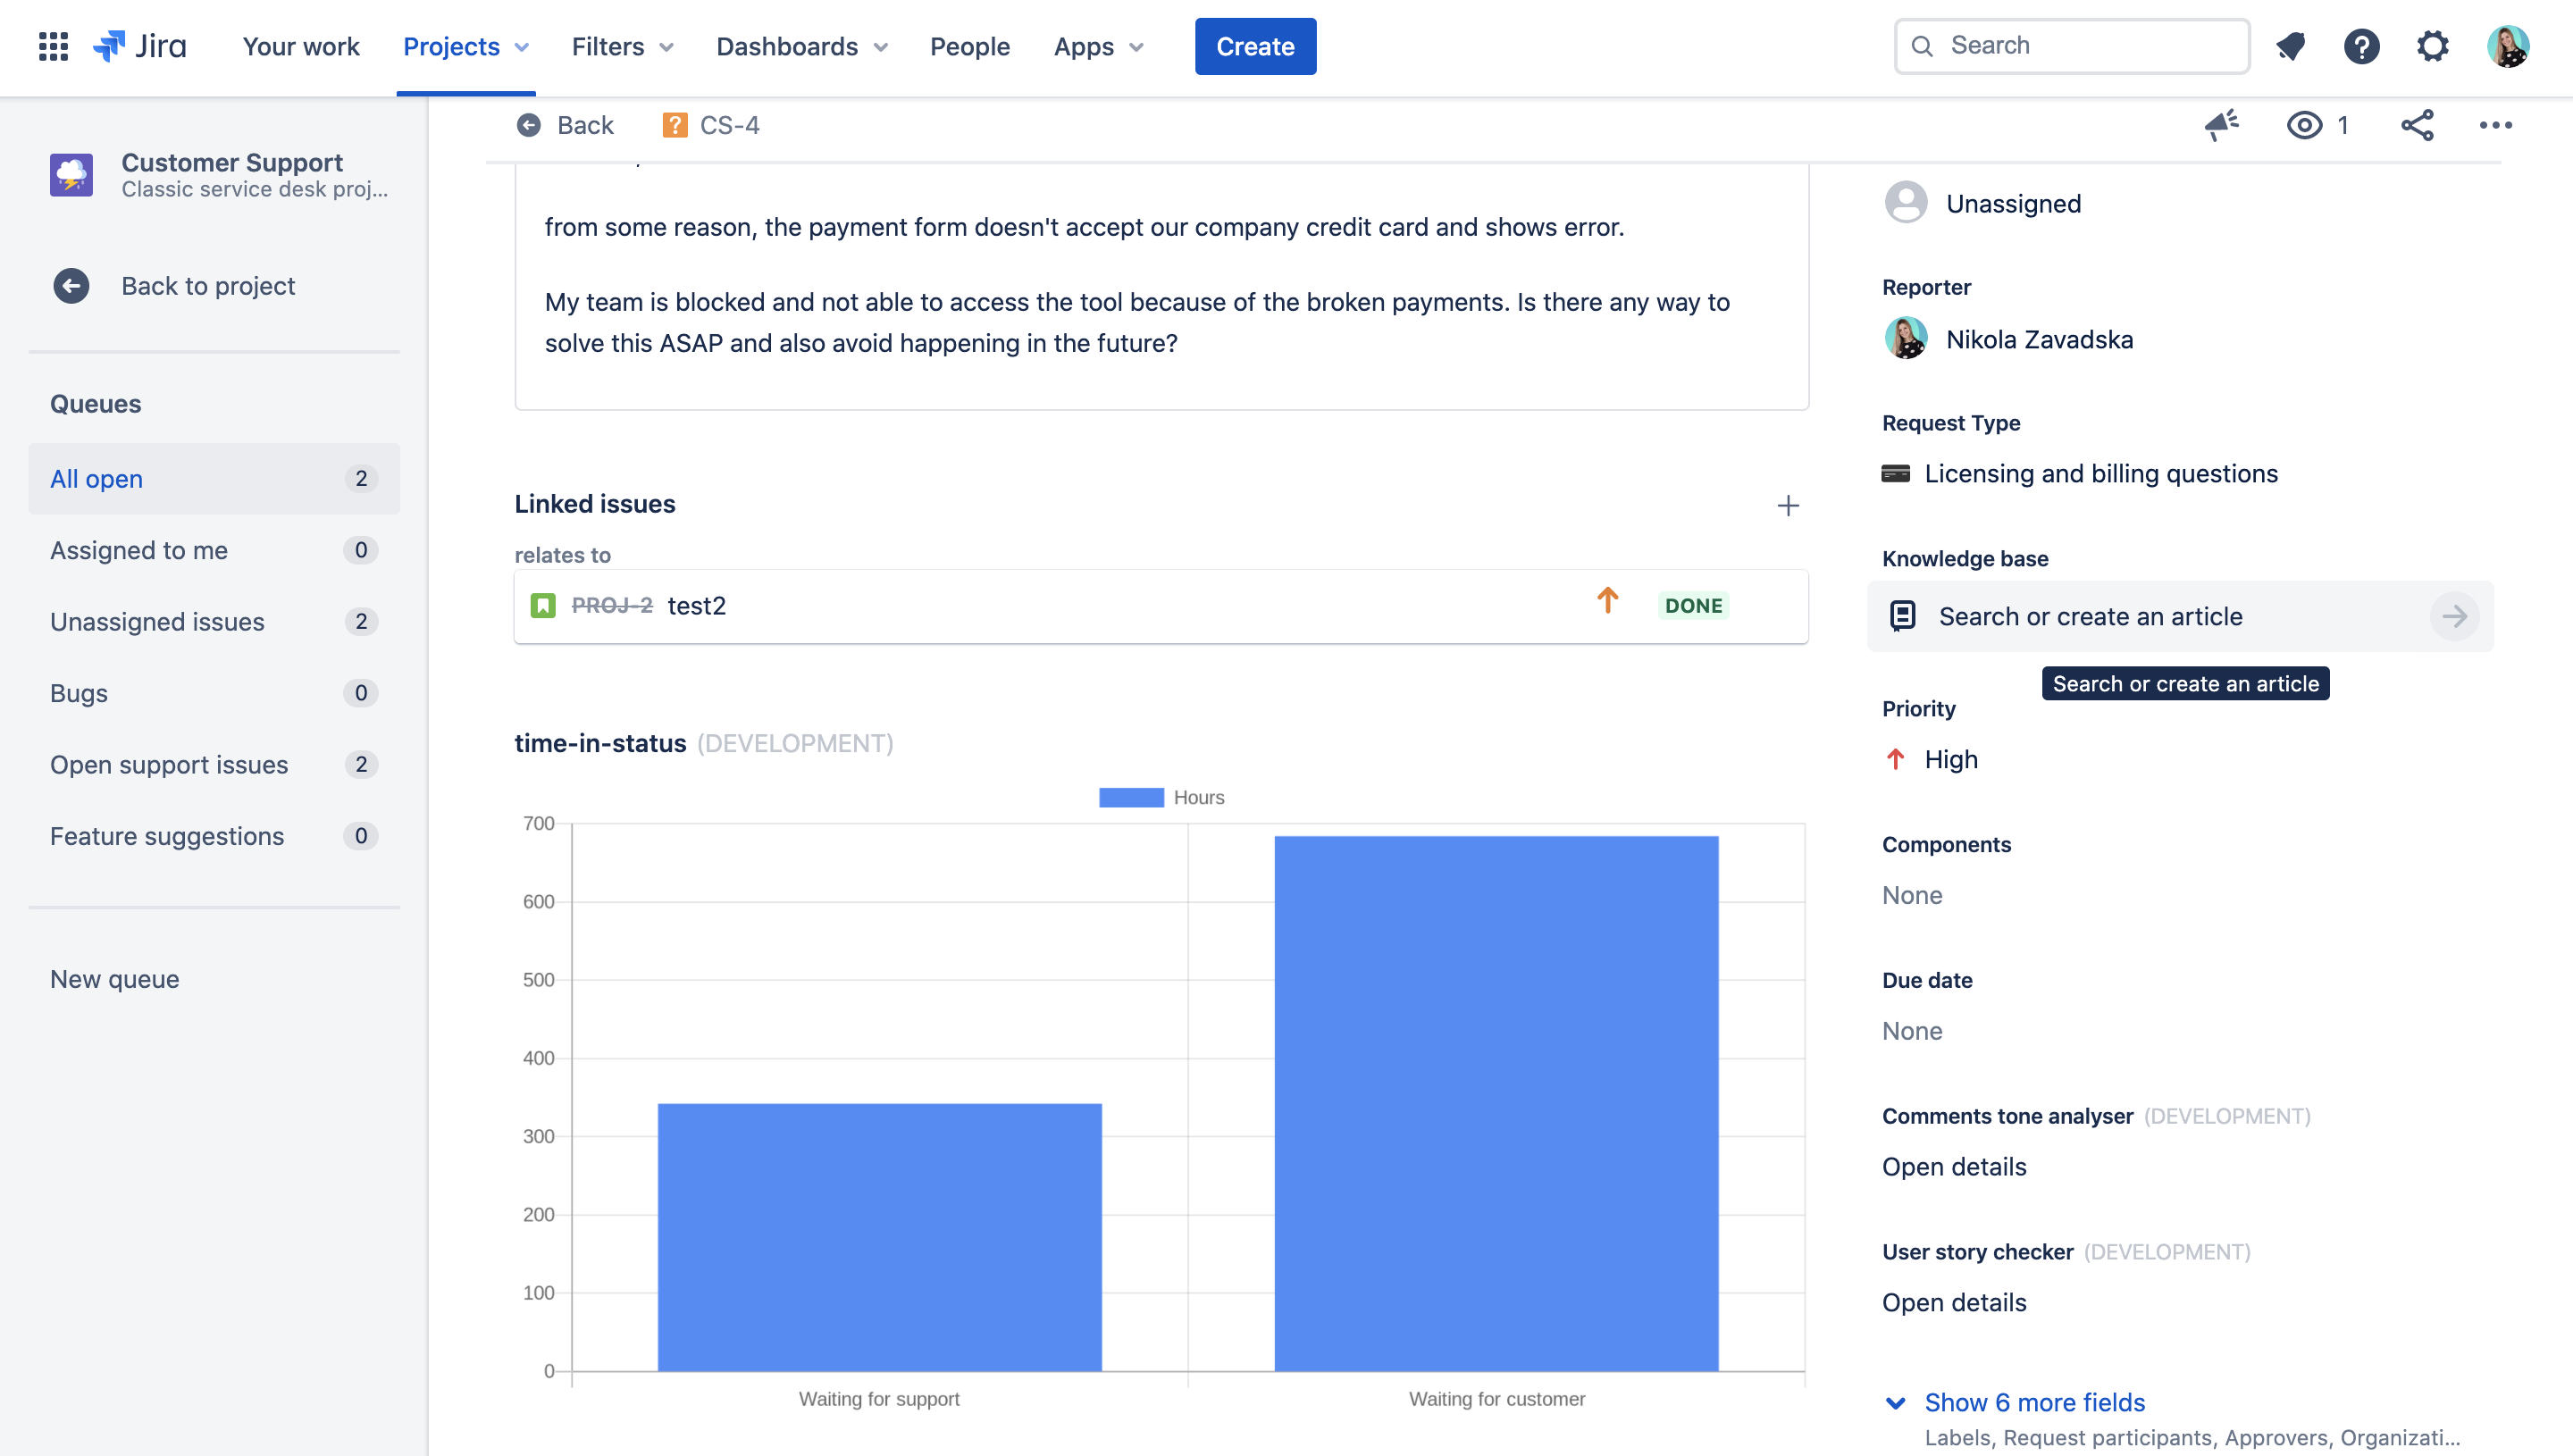
The Issue Time in Status shows a bar chart in the issue under the description.
From the chart, you can see the different statuses issue went through and how long it was in this status.
How I built it
We are using the Jira APIs to retrieve status information for the issue. After formatting the data in the desired structure we use a 3rd party service called https://quickchart.io/ that exposes an API to send data and return a processed bar chart image with time on Y axis and statuses on X axis. This statuses chart then gets embedded into the issue fragment using the Image component from Forge-UI.
Challenges I ran into
Due to Forge limitations and restrictions in rendering any sort of pure HTML and CSS elements we had to come up with an alternative to generating the diagram
Accomplishments that I'm proud of
Once we figured out the chart solution the implementation was pretty straight forward
What I learned
That when there are limitations you get creative :)
What's next for Issue Time in Status
The app is a great addition to Project Time in Status gadget and will be ready to be used once forge is enabled.

Log in or sign up for Devpost to join the conversation.