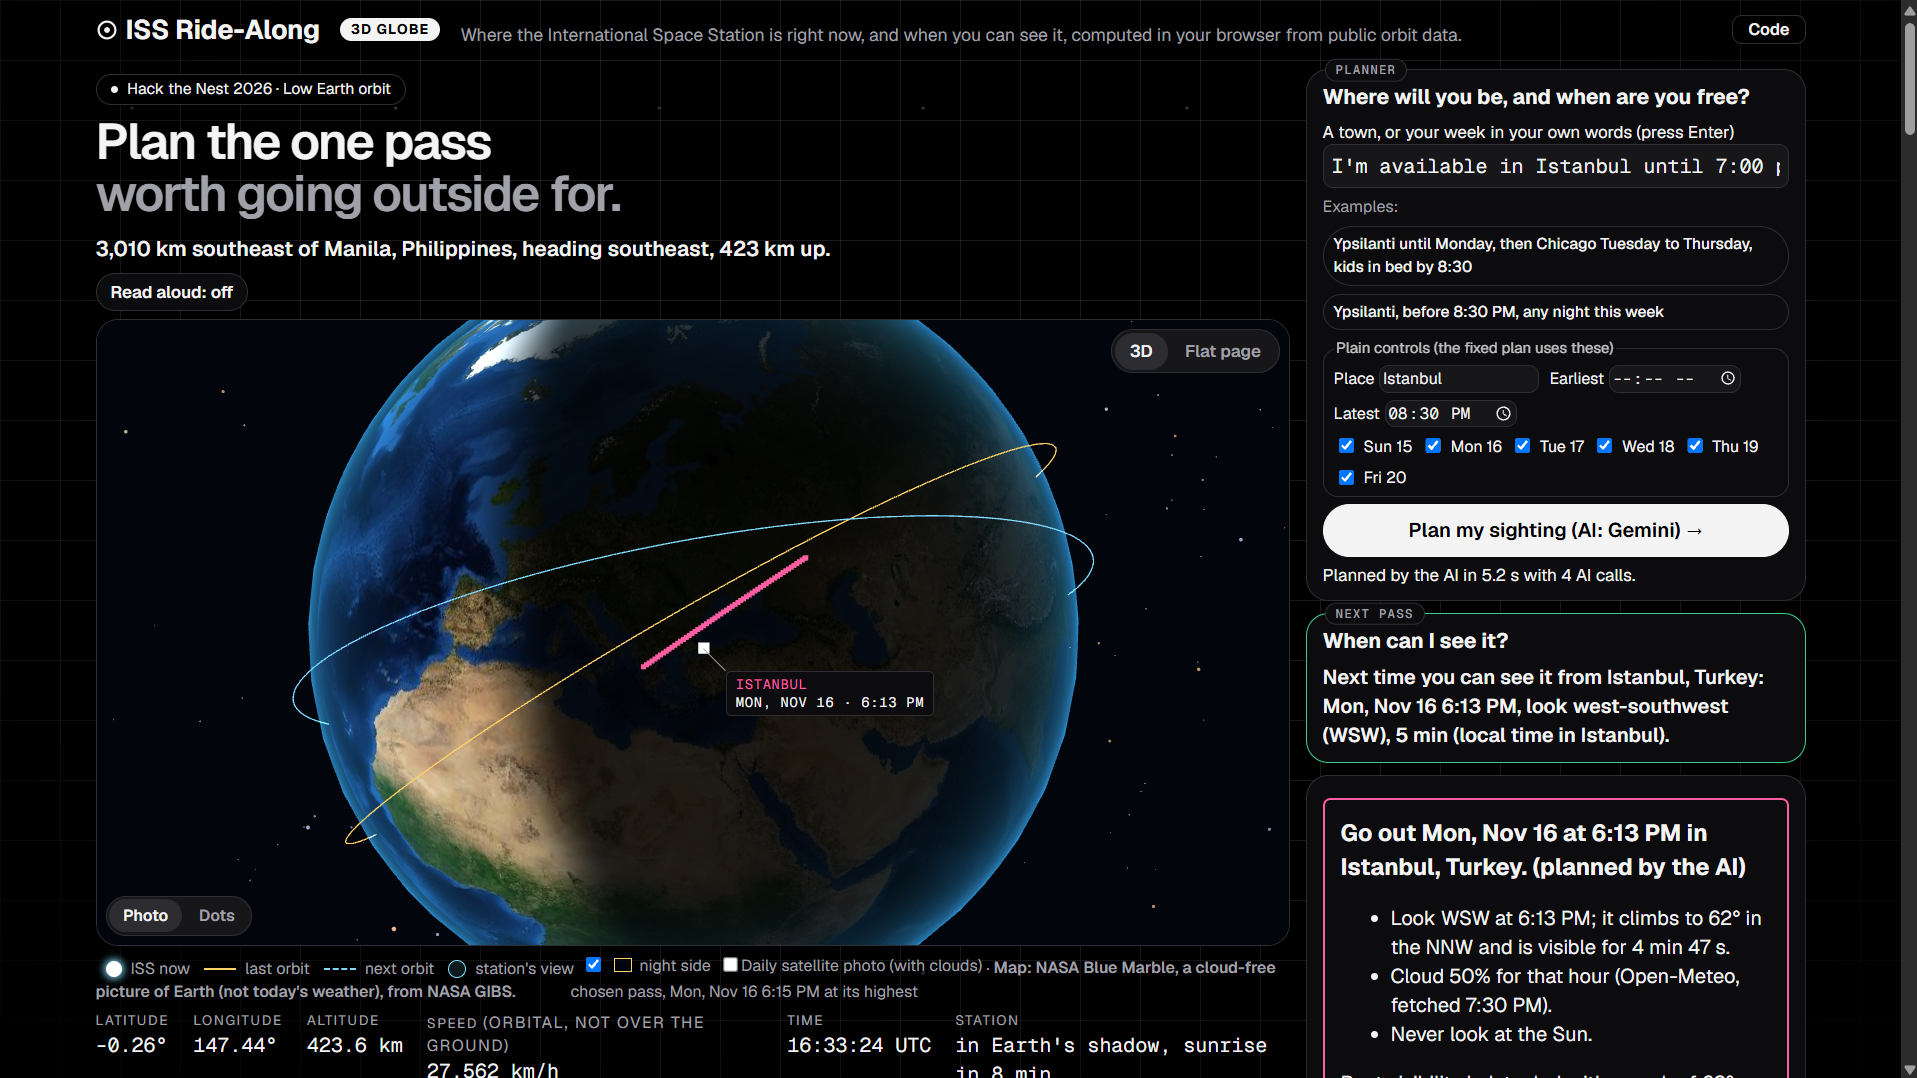
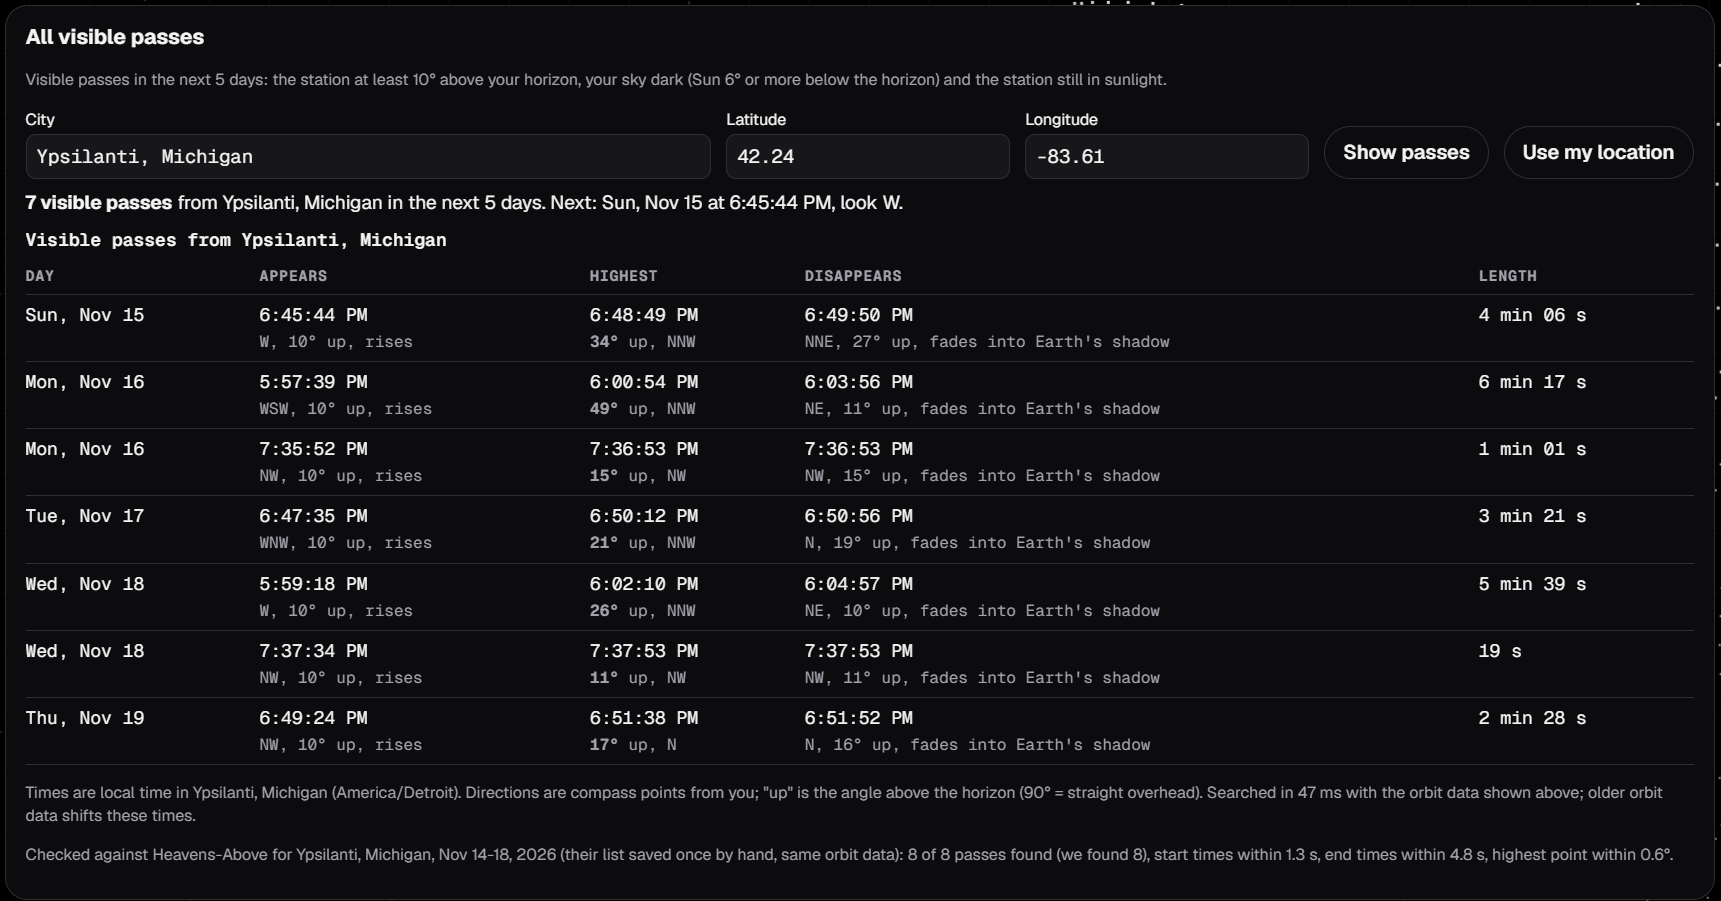
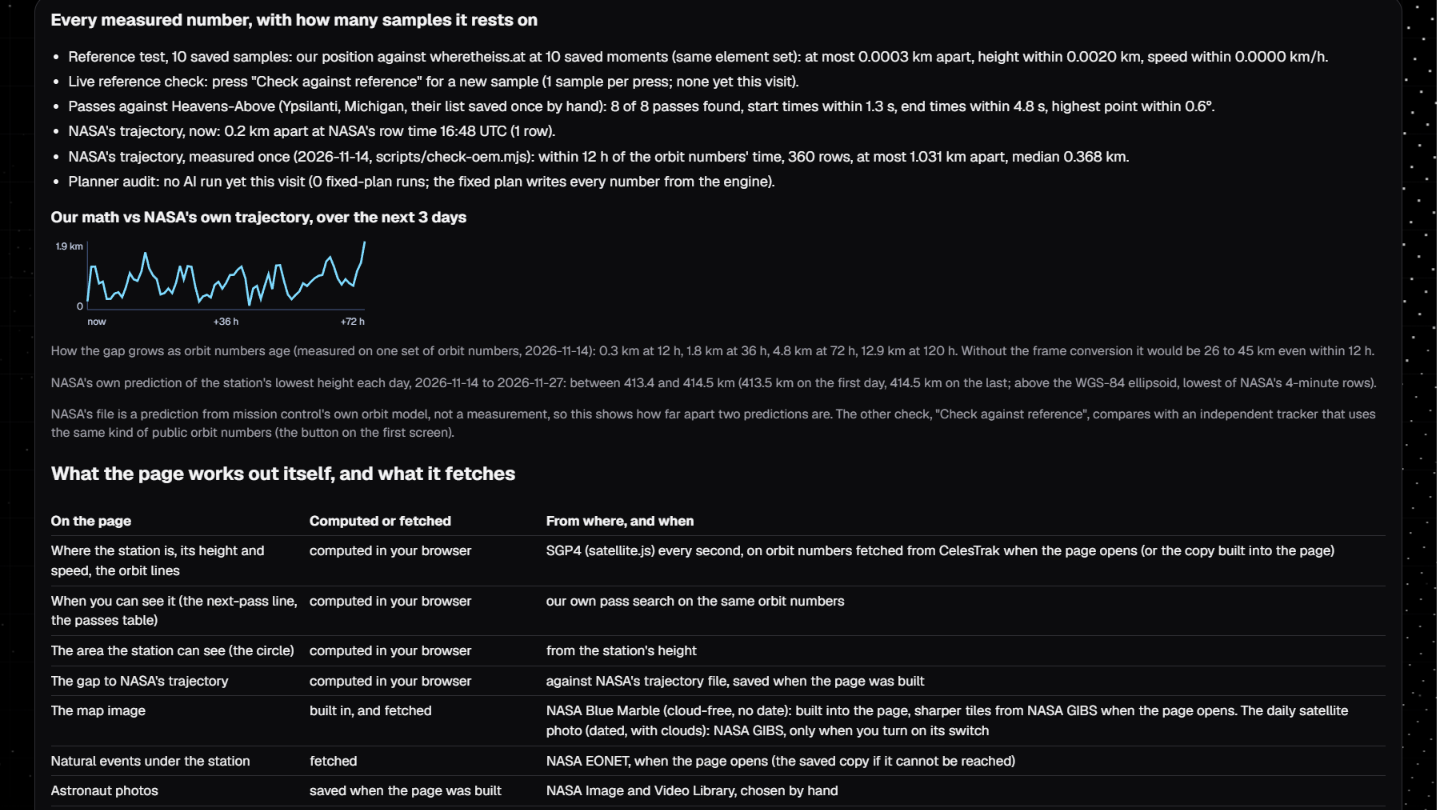
ISS Ride-Along plans the one International Space Station pass worth going outside for: type where you will be this week and when you are free, in your own words. It is for a parent, a teacher or a first-time stargazer. Its pass list matched 8 of the 8 passes that Heavens-Above (a satellite pass site) lists for Ypsilanti for Nov 14-18, the worst start time 1.3 seconds off.
Inspiration
You see the station only if you are in the dark, it is still in sunlight, the sky is clear and you look the right way at the right minute. Pass apps list the times and leave the rest to you.
What it does
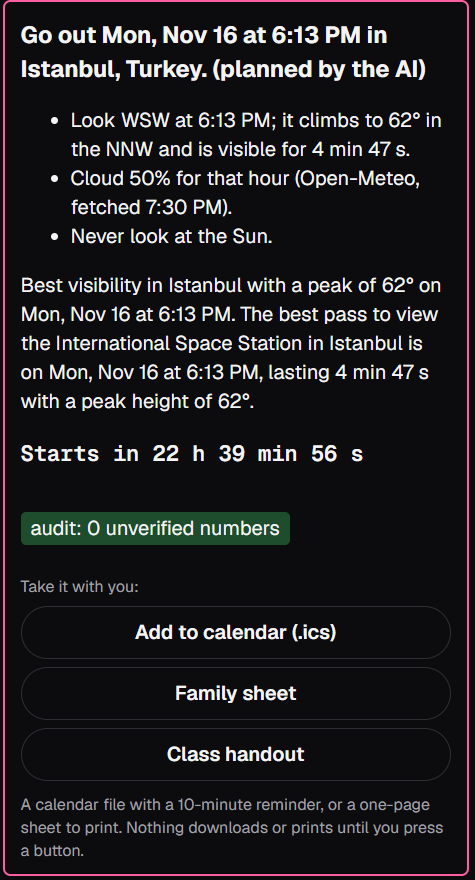
- Plan my sighting. An AI agent (a model that chooses which of our tools to run) runs our pass math and the Open-Meteo cloud forecast for each place and night you named, searches the web through Exa and picks one pass. Our engine writes every number on the card, and an audit marks any number the AI made up. With no key, a fixed plan runs instead.
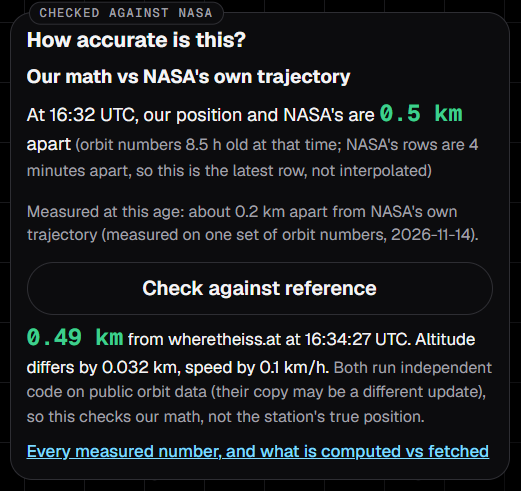
- Live tracker. Where the station is every second, its last and next orbit, and a button that checks our position against an independent tracker, wheretheiss.at.
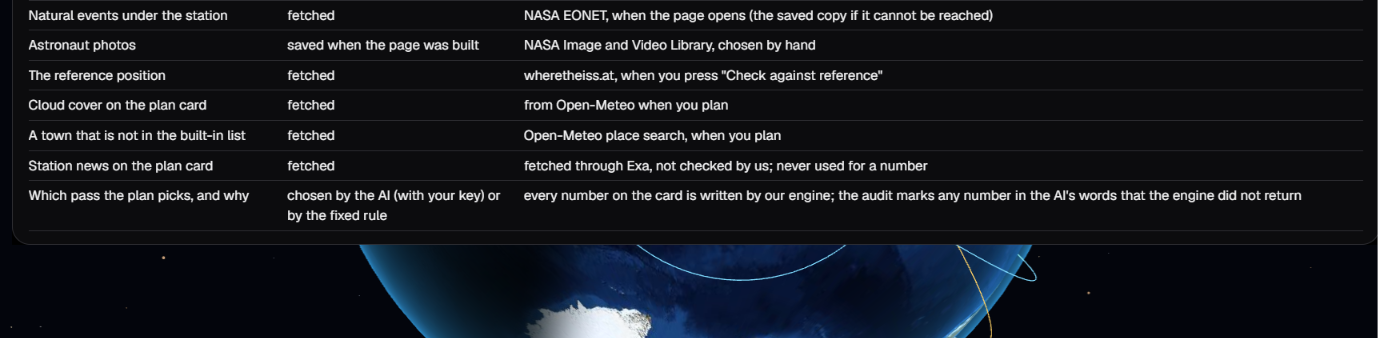
- From NASA data. What the station is flying over (the daily satellite photo, open natural events, astronaut photos), and how far our position is from NASA's own trajectory file.
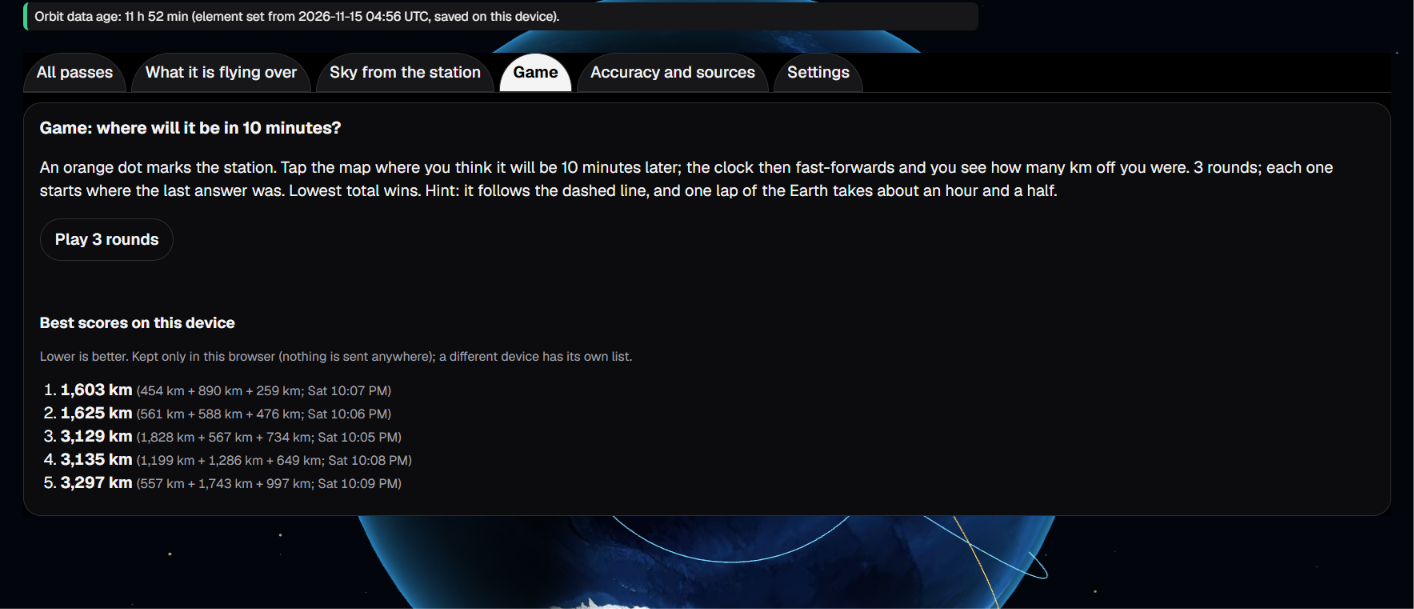
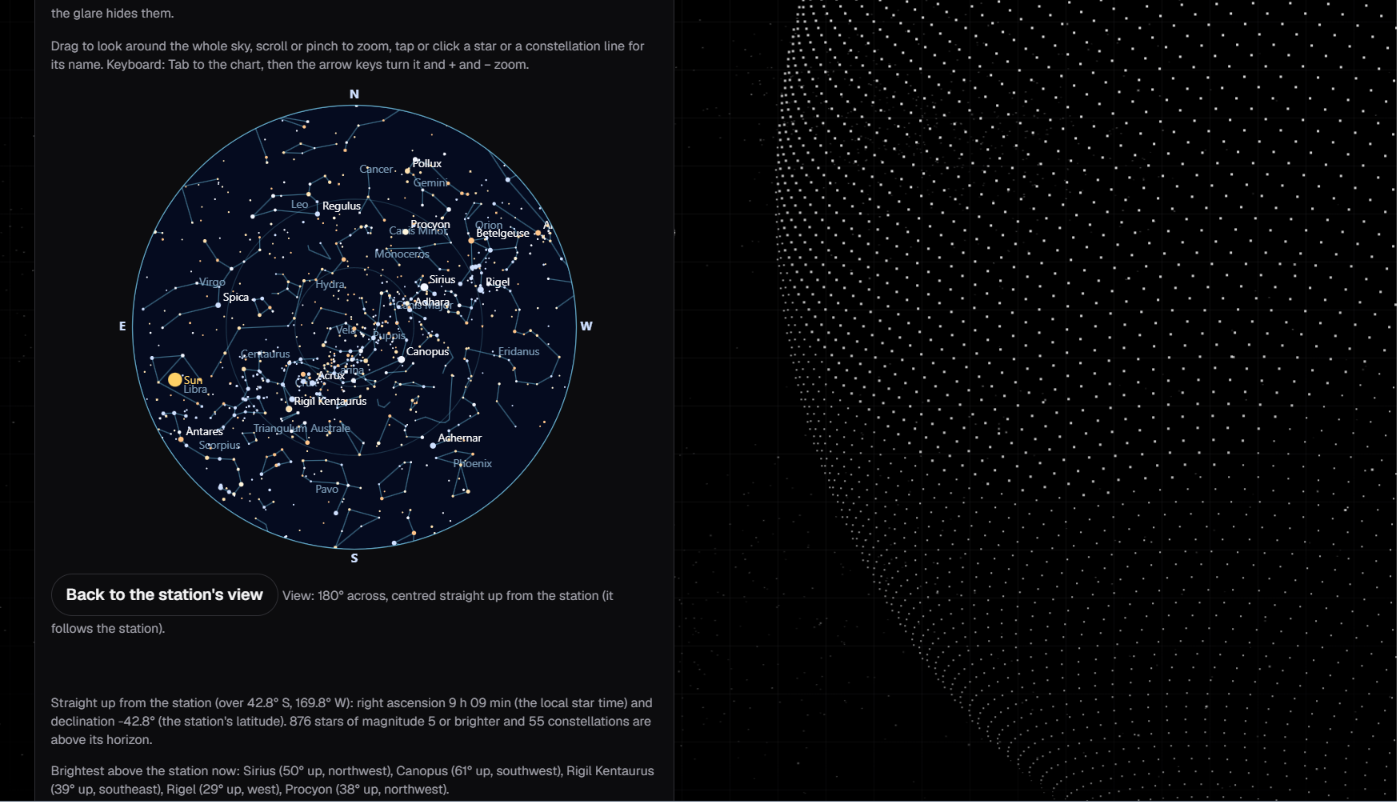
- Also. A calendar file for the chosen pass, a three-round game, a star chart, a read-aloud switch and a Forecast lab (a research demo, not investment advice).
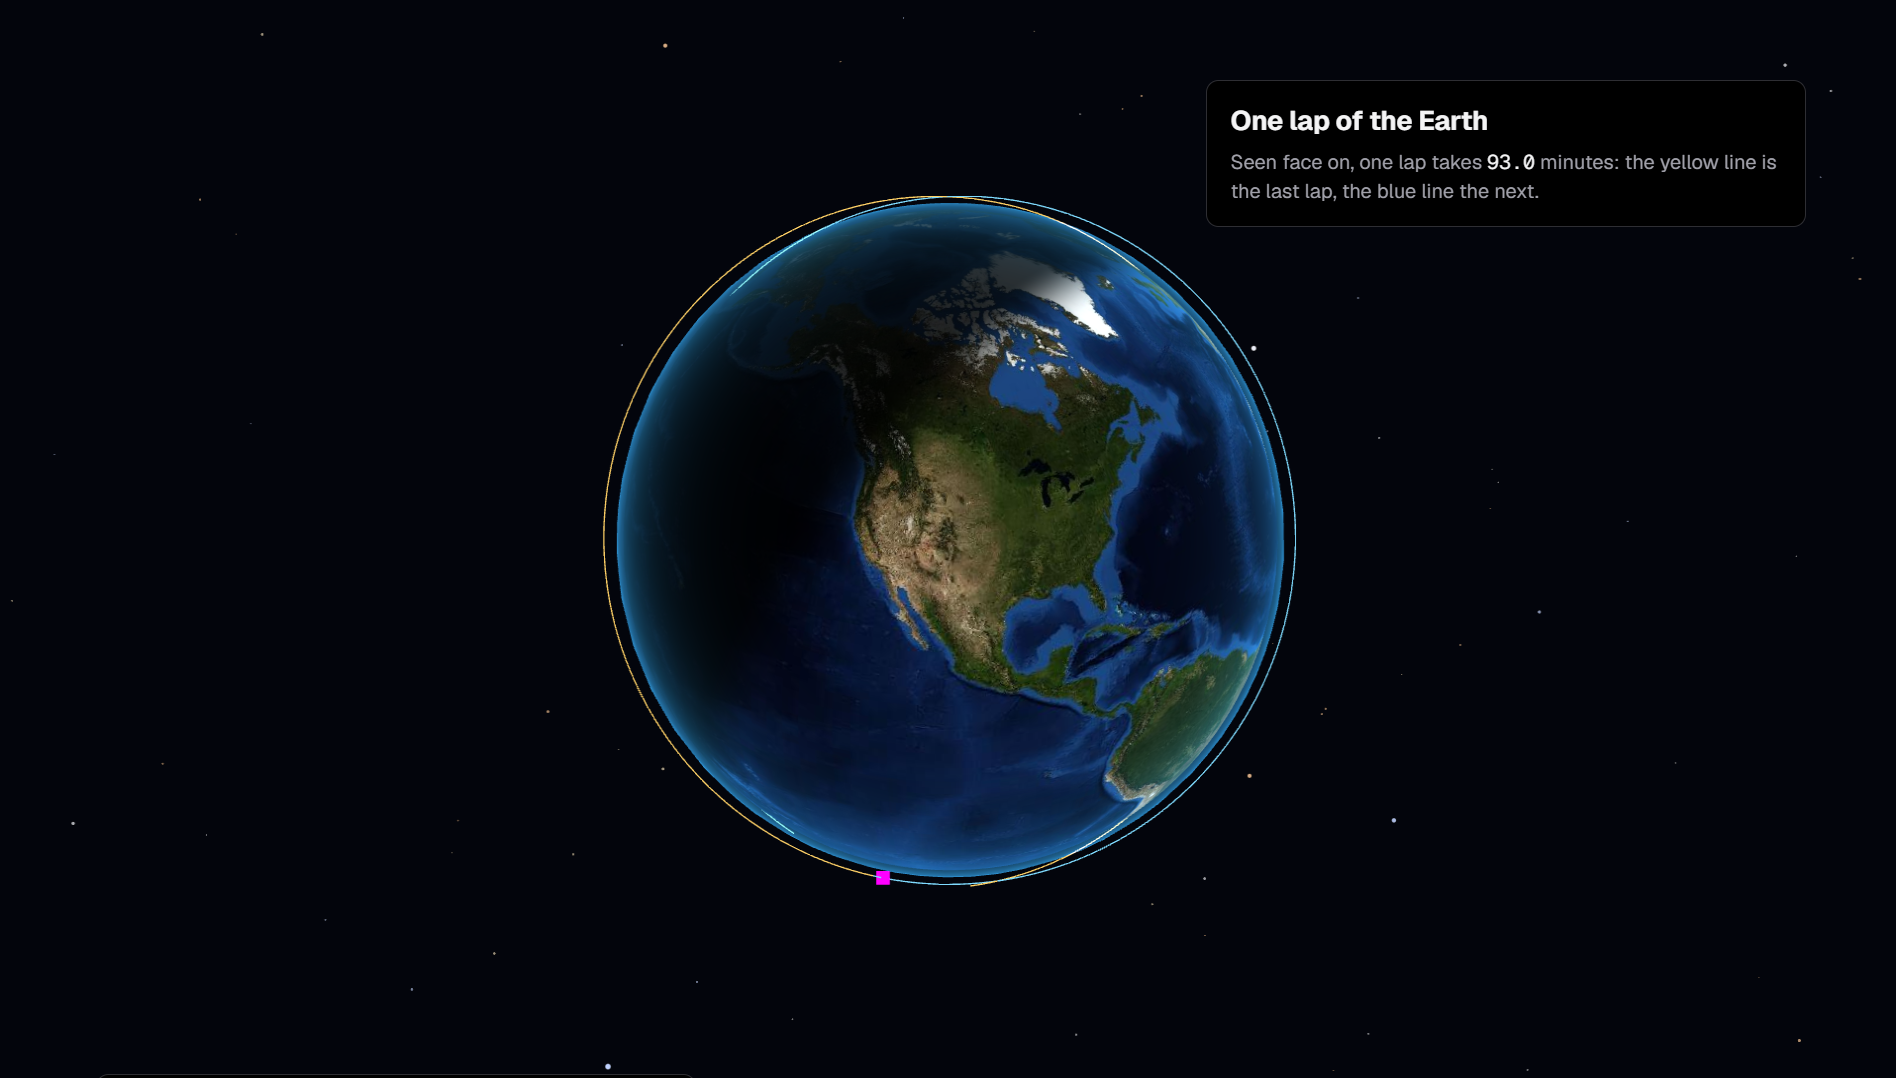
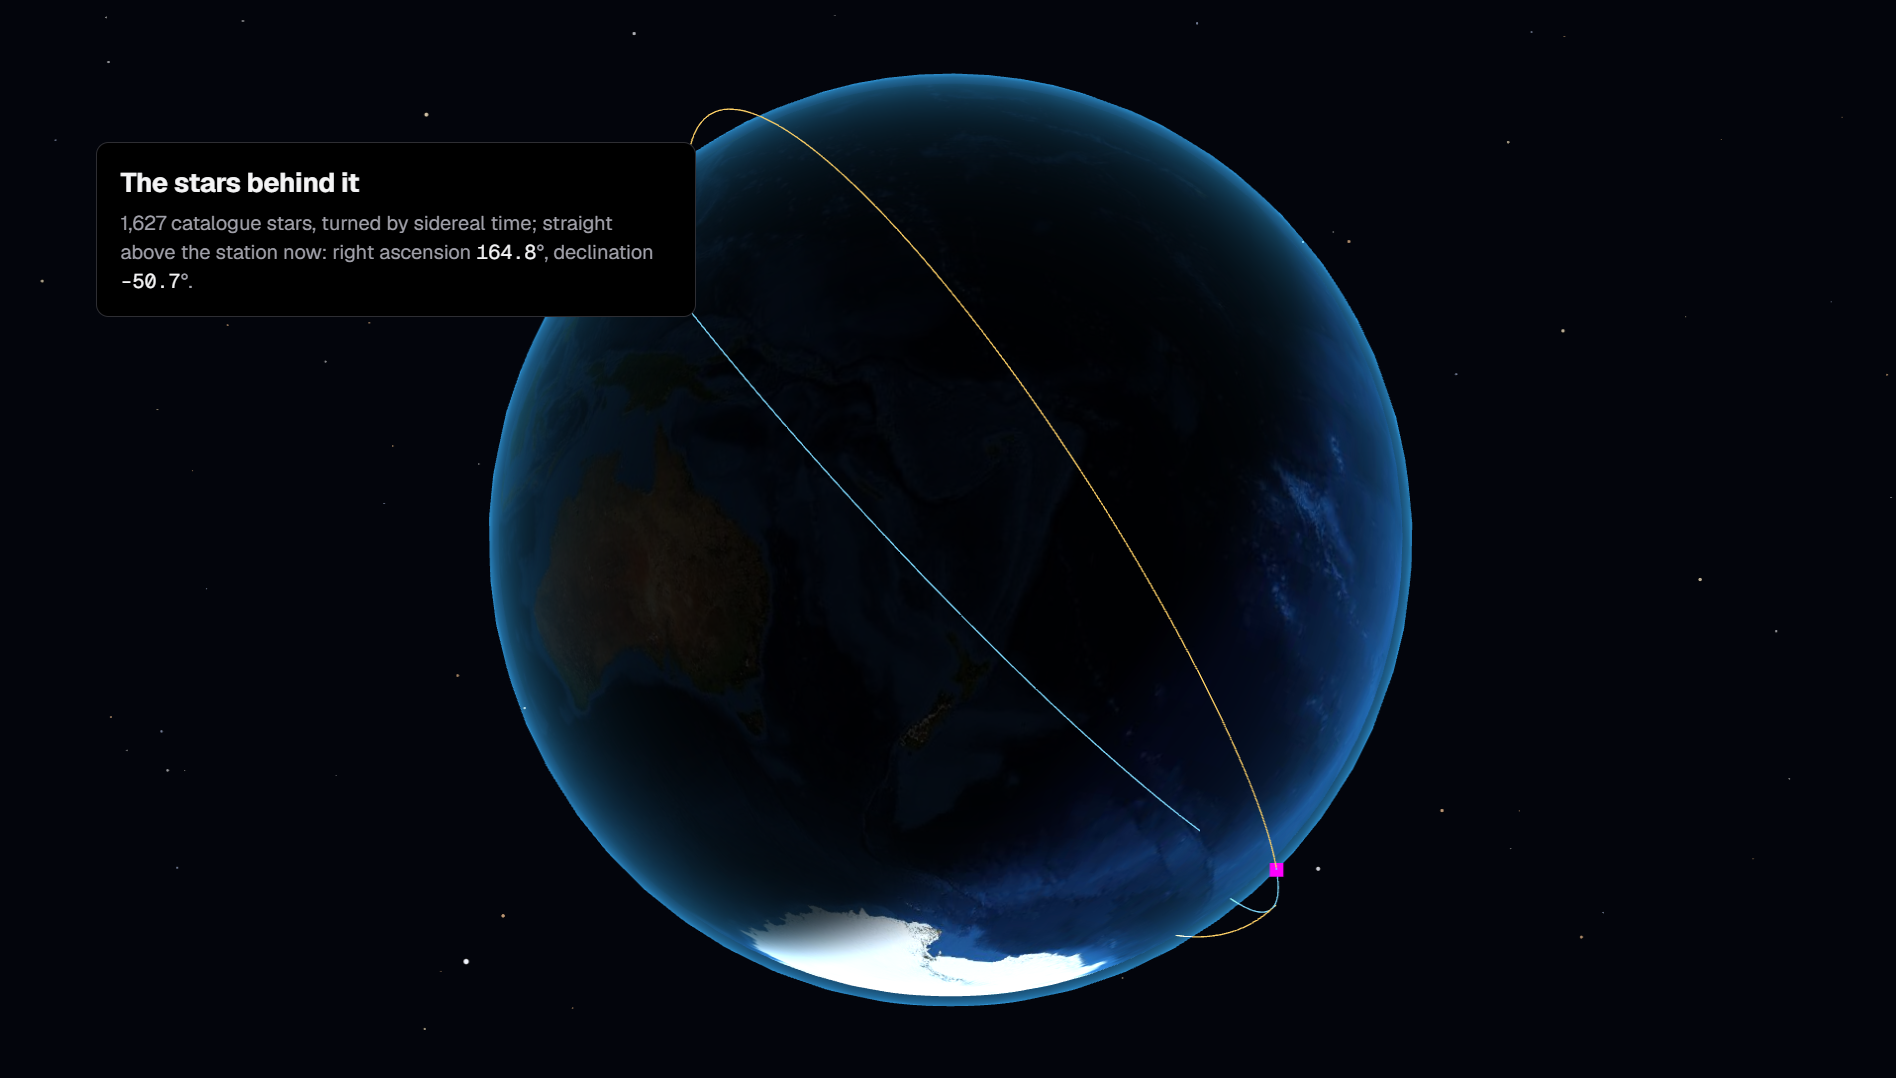
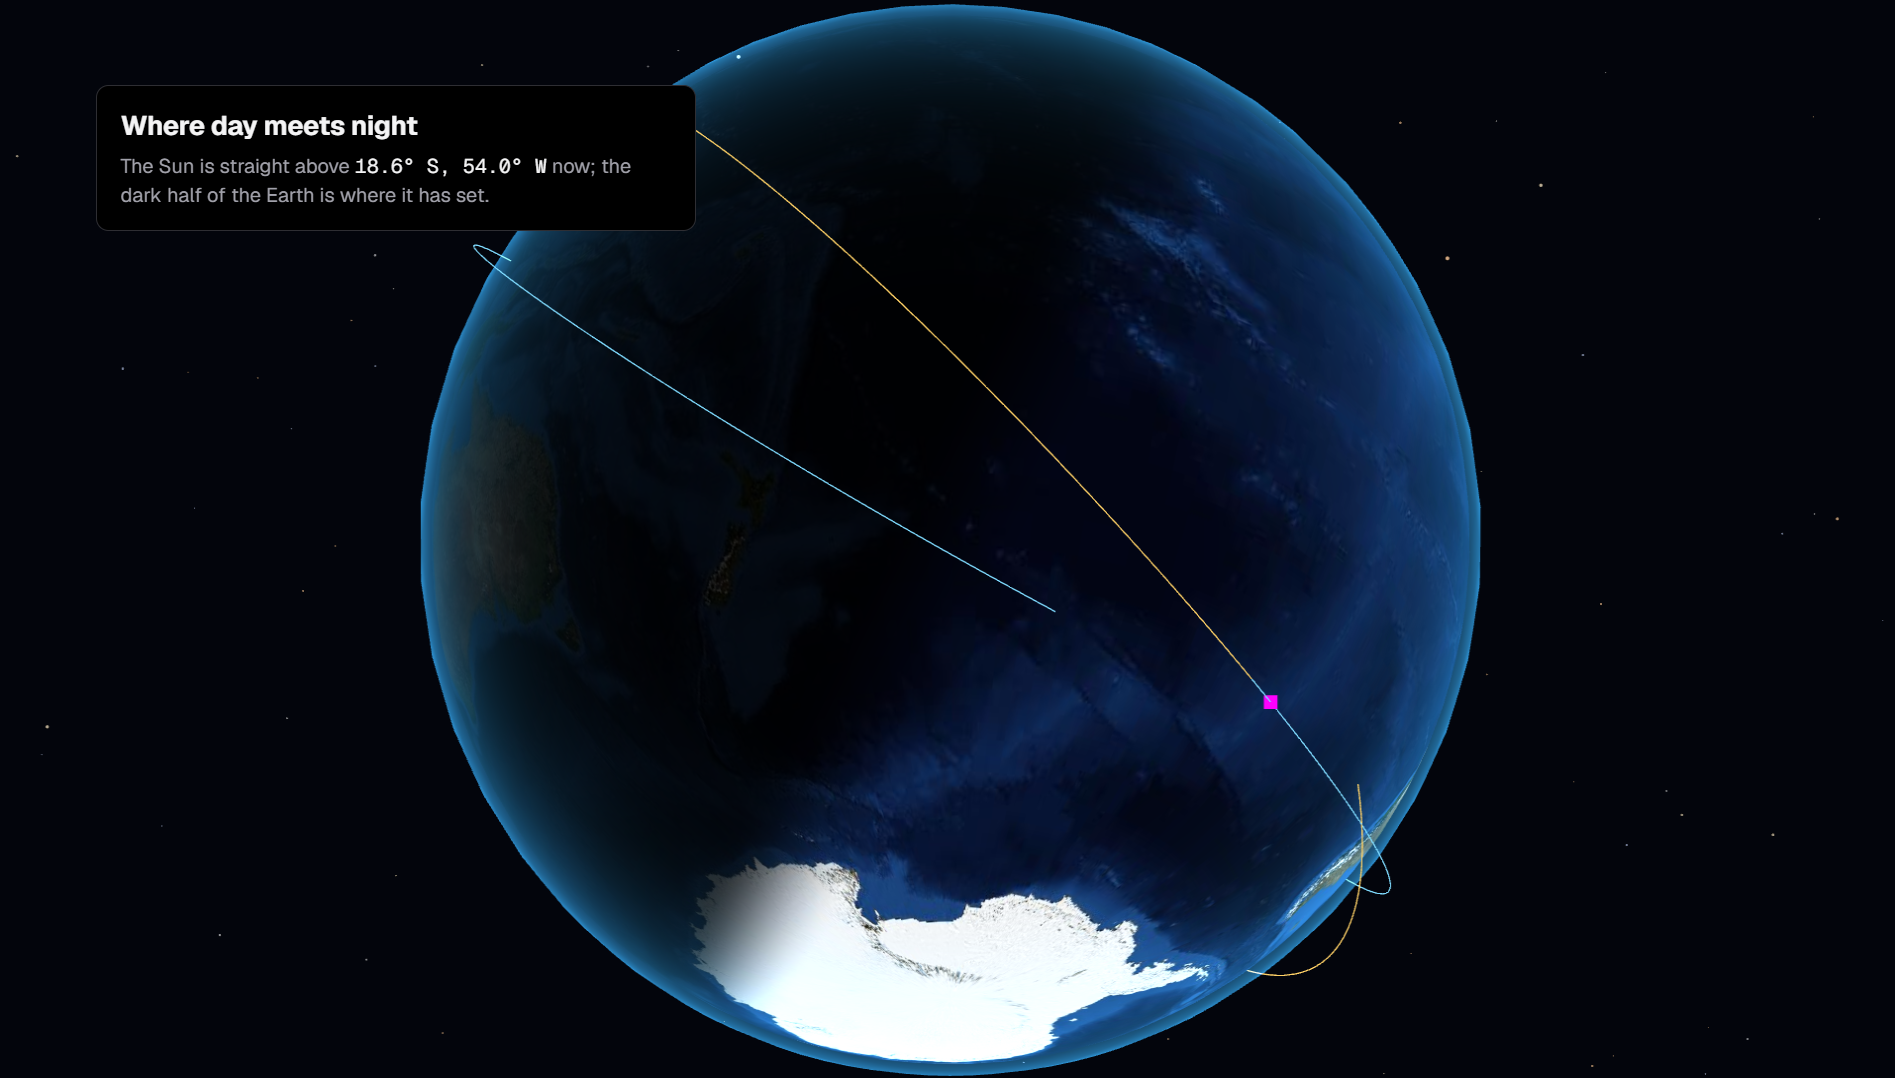
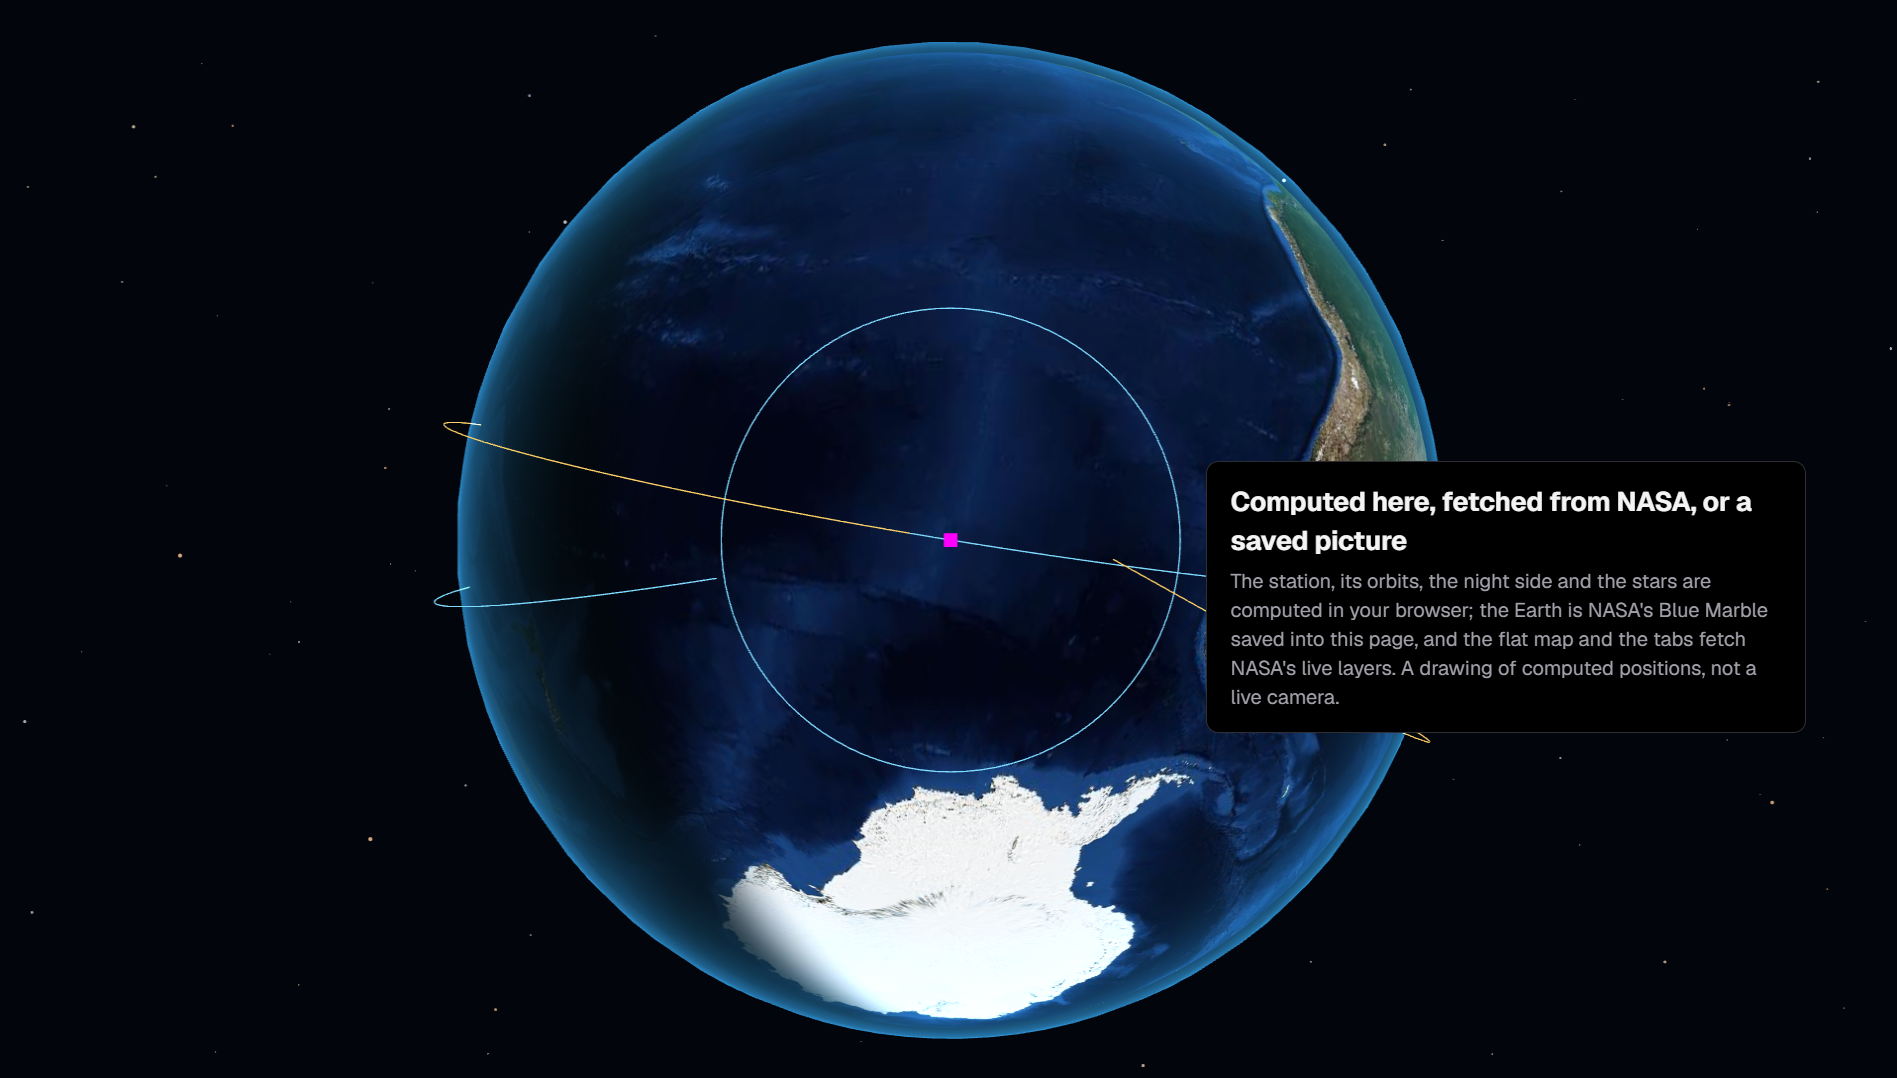
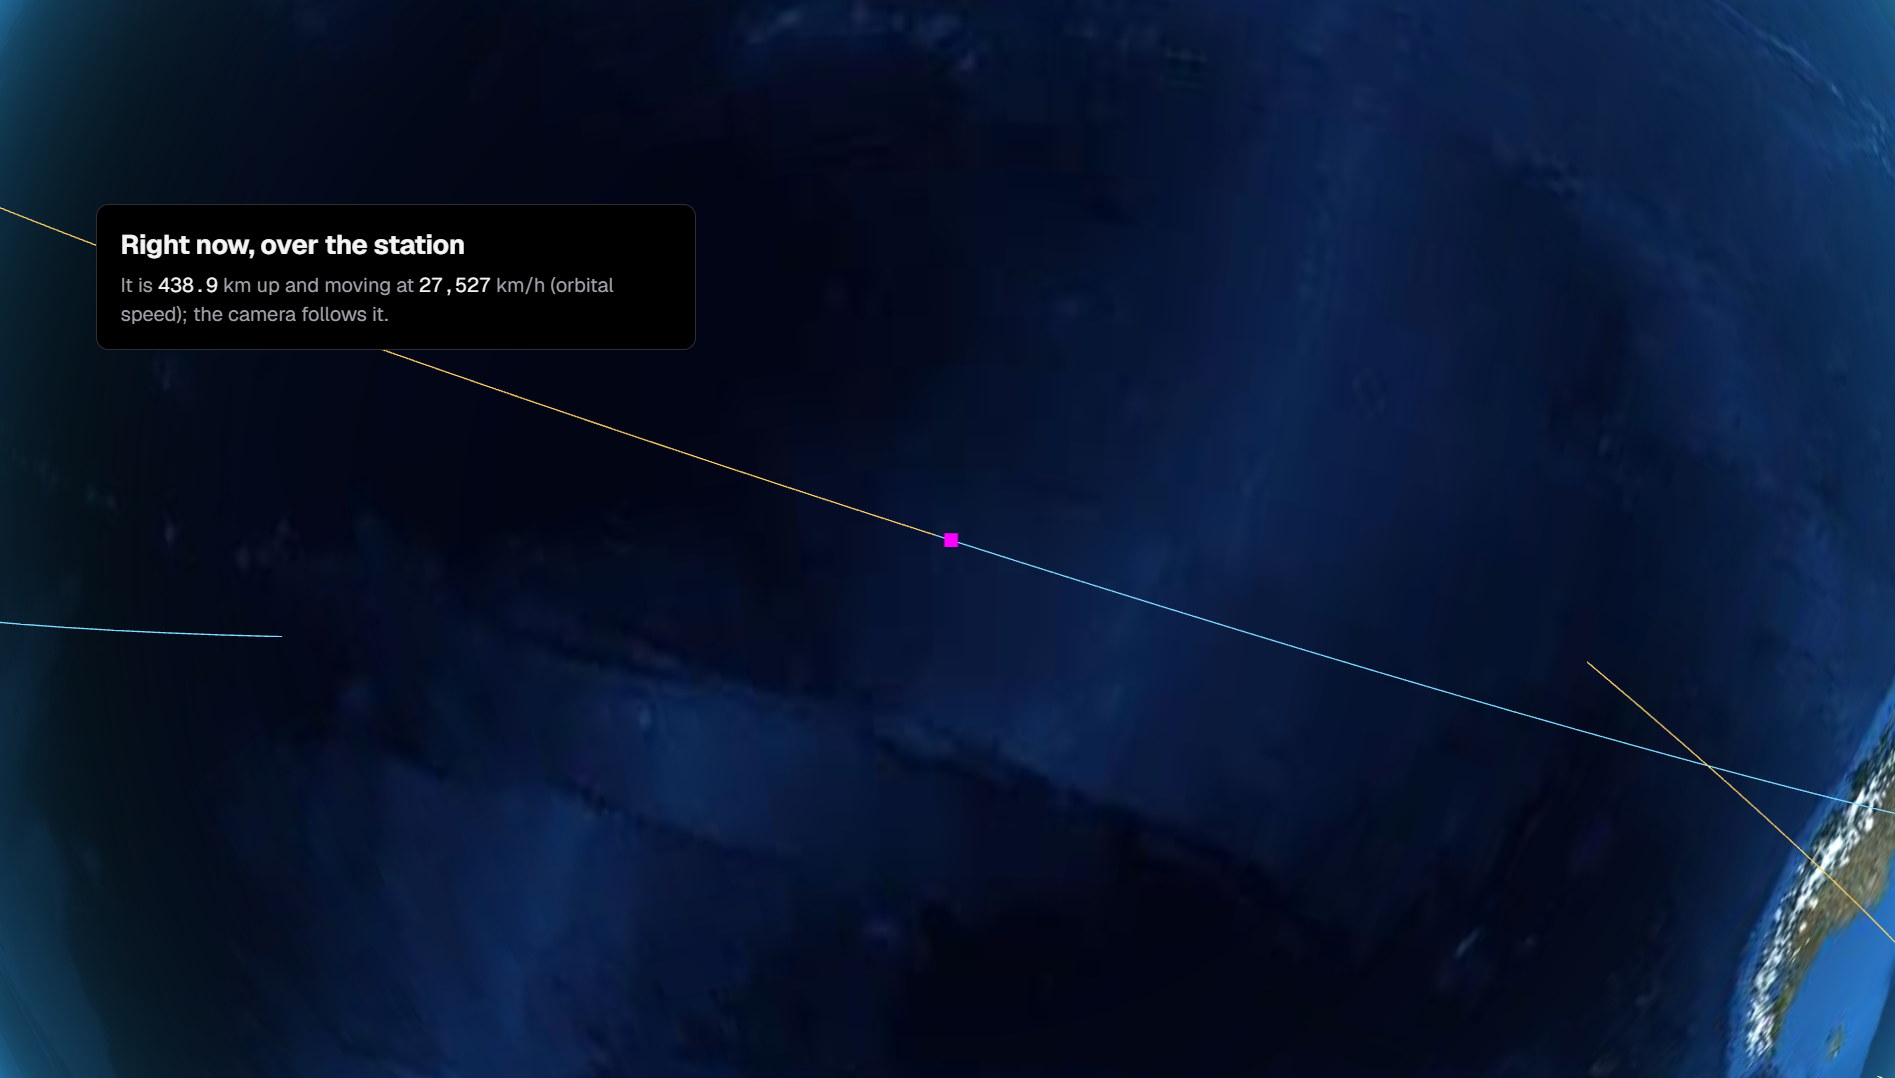
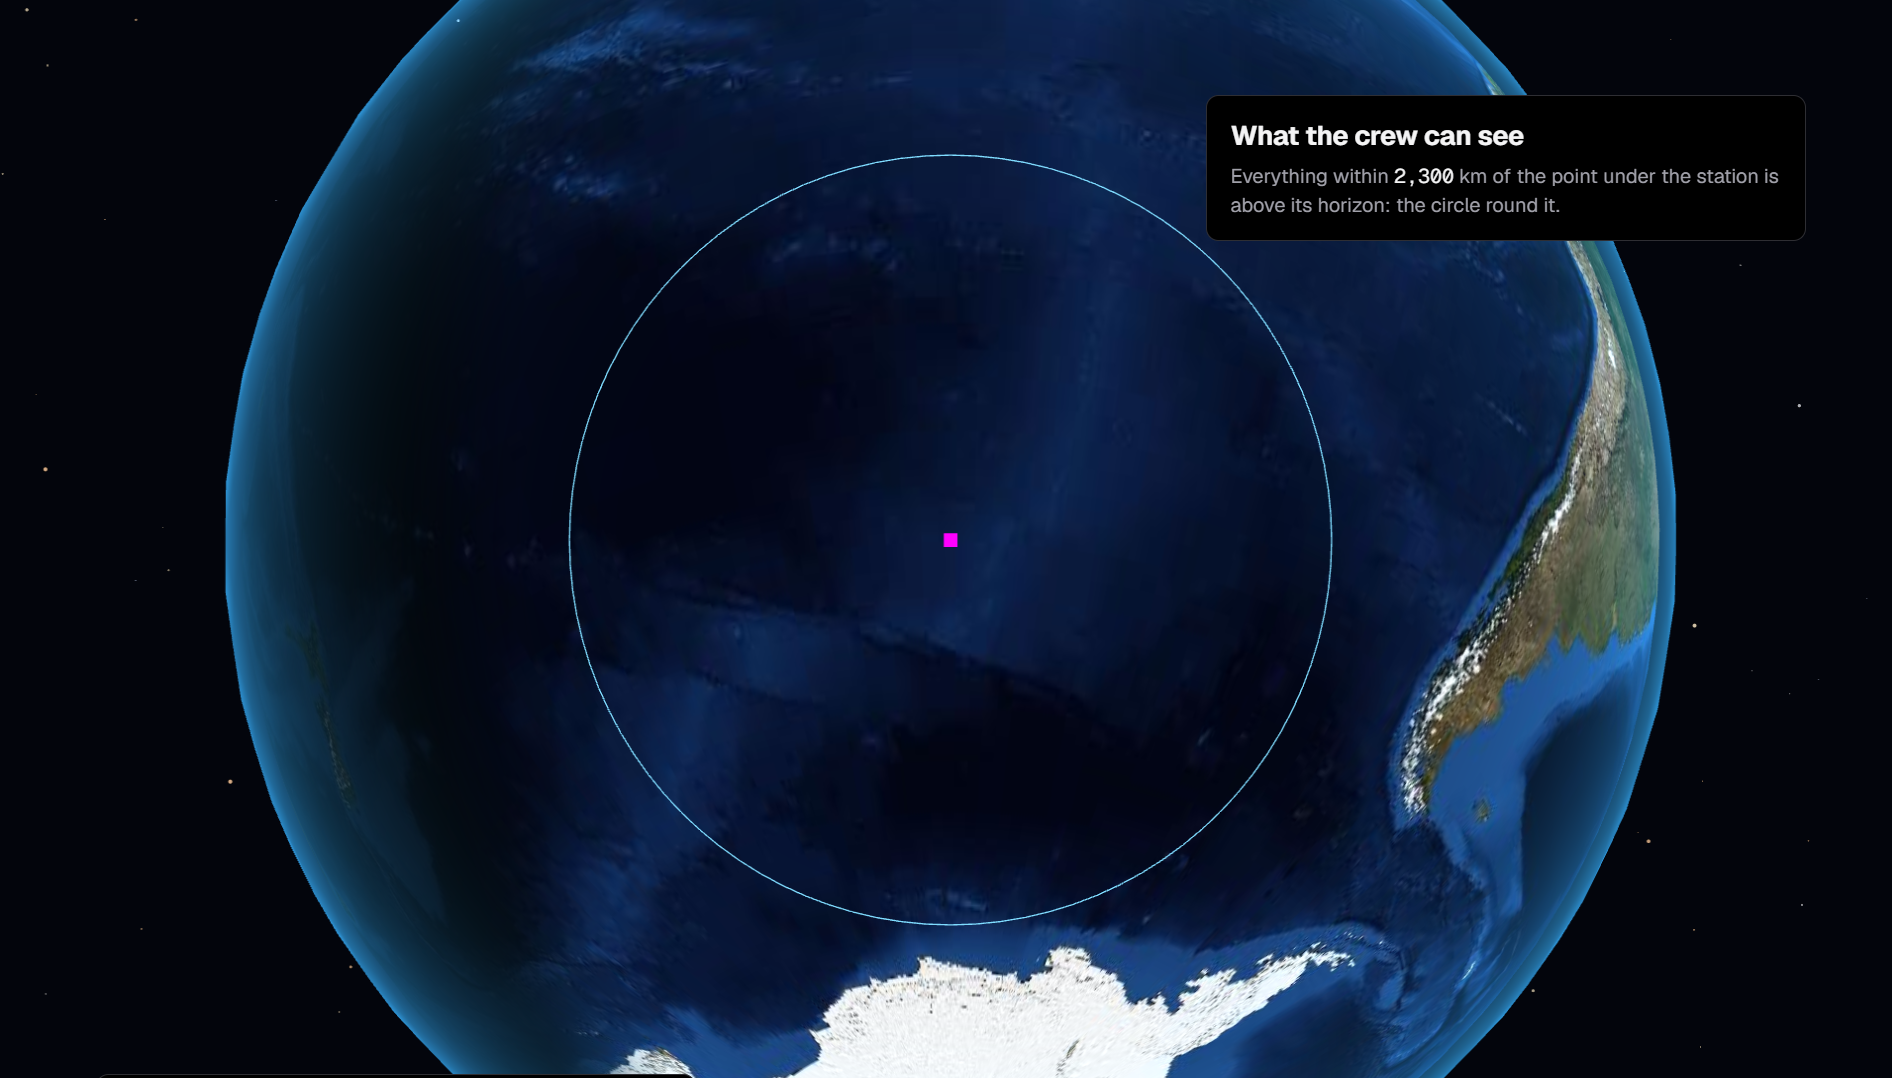
Where the device can draw it smoothly, the page opens on a 3D globe in a dark look, drawn with three.js (MIT). It is a drawing of computed positions, not a live camera: the Earth is NASA's cloud-free Blue Marble from NASA GIBS (one copy saved on Nov 15, 2026 and built into the page), and the station at its true height, its last and next orbit, the night side, the area the crew can see and the chosen pass over your city all come from the same tested orbit and Sun math as the flat map; the 1,627 stars behind it are the Sky tab's own catalogue. Below the tool, a six-scene scroll story turns the globe as you read. The flat page is one press away ("Flat page"), and it opens by itself on a device with no WebGL2, a software renderer, a slow graphics chip or reduced motion. The look was modelled on Ahmed's earlier RoBuff page; all code was written new at this event. Not affiliated with or endorsed by NASA.
How we built it
Everything is computed in the browser, in TypeScript. The orbit comes from a TLE (the public two-line description of an orbit) run through SGP4, the standard model for TLEs, in satellite.js. GitHub Actions runs the tests on every push before GitHub Pages publishes the page.
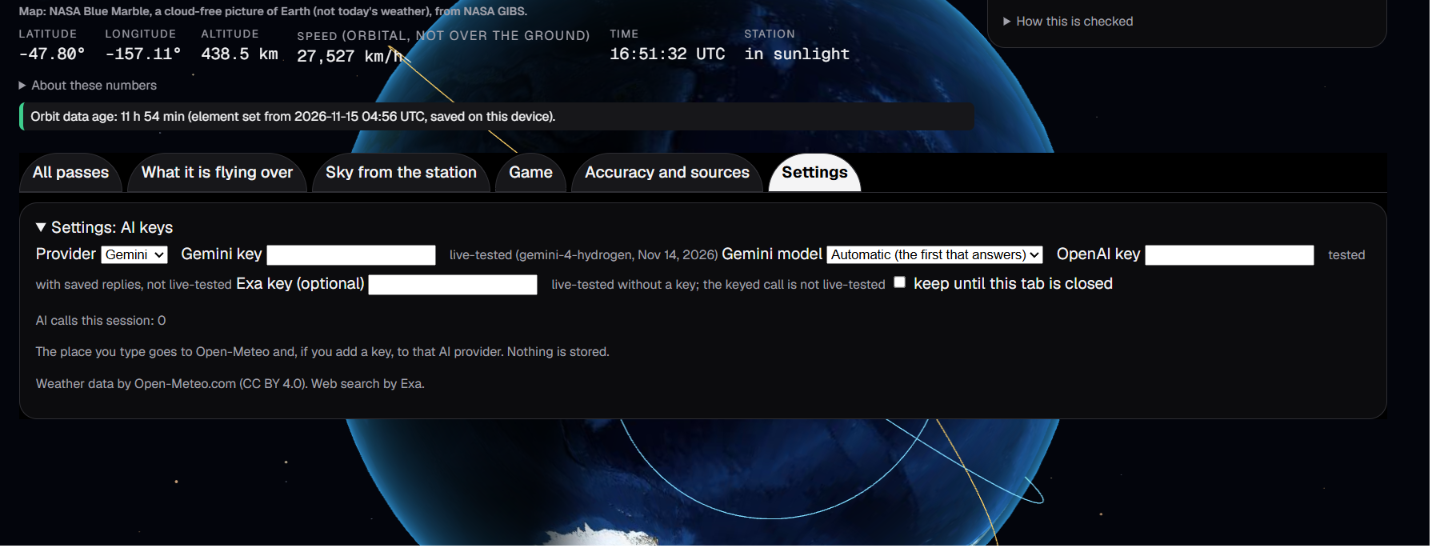
The code was written by Claude Code, Anthropic's AI coding tool (the Fable 5.2 model planned, the Opus 5.5 model wrote the code), directed by our teammate Ahmed. Every part had to pass checks that do not trust the AI: tests against outside data and a separate verification run. Inside the app, the planner was live-tested with Gemini; the OpenAI adapter was tested with saved replies only, not live-tested.
Who did what: Ahmed directed the build. Quinn posted the event's Devpost page and pressed Submit on the Saturday draft. Denim ran the planner on the demo laptop, his own, with his own Gemini key, and suggested the clear map that is now the default. Armeis wrote up how the publishing workflow works. Quinn, Denim, and Tyler all contributed to ideas for new features and changes after the initial generation.
Challenges
NASA's trajectory file uses a different reference frame from SGP4's output. Unconverted, the two positions were 26 to 45 km apart on 360 of NASA's rows; with our conversion, 0.485 km at our orbit numbers' timestamp.
Accomplishments
- Position: 0.0003 km at most from 10 of 10 positions saved from wheretheiss.at, on the same orbit numbers. This checks our math, not the station's true position.
- NASA's trajectory: 0.870 km apart after 24 hours and 4.763 km after 72 hours. NASA's file is a prediction too, so this is a distance between two predictions, not a measured error.
- The agent: 13 of the 14 live Gemini runs in our build log were finished by the AI, each with 0 unverified numbers. In the other, no reply came within 15 seconds; the page now asks once more, then falls back to the fixed plan and says why.
- 232 of 232 automated tests pass.
What we learned
- Ahmed: An independent check finds what the builder's own check misses: 6 verification runs, across 4 parts, failed work that had passed its builder's test.
- Quinn: I learned how powerful an AI tool can be, and that the future of computer science includes very little coding manually. I also learned a lot about NASA's public data as well as a bunch about the ISS.
- Denim: Helped ensure our project met the hackathon's main-track requirements by checking with the organizers, suggested improving the Earth visualization by removing the distracting cloud layer, and reviewed Claude-generated code to better understand how the application worked. I also learned how important usability, communication, and human oversight are when building a project with AI.
What's next
Not done yet: a test with a screen-reader user, timed tests with strangers, a live test of the OpenAI adapter, and the 3D view on more than the one laptop it was checked on.
Data: CelesTrak (US Space Force tracking data, not NASA), NASA GIBS, EONET, the NASA Image and Video Library and Johnson Space Center's trajectory file, wheretheiss.at, Heavens-Above, Open-Meteo, Exa; the README credits every source.
Built With
- exa
- gemini
- github
- github-actions
- leaflet.js
- open-meteo
- satellite.js
- three.js
- typescript
- vite
- vitest

