-
-
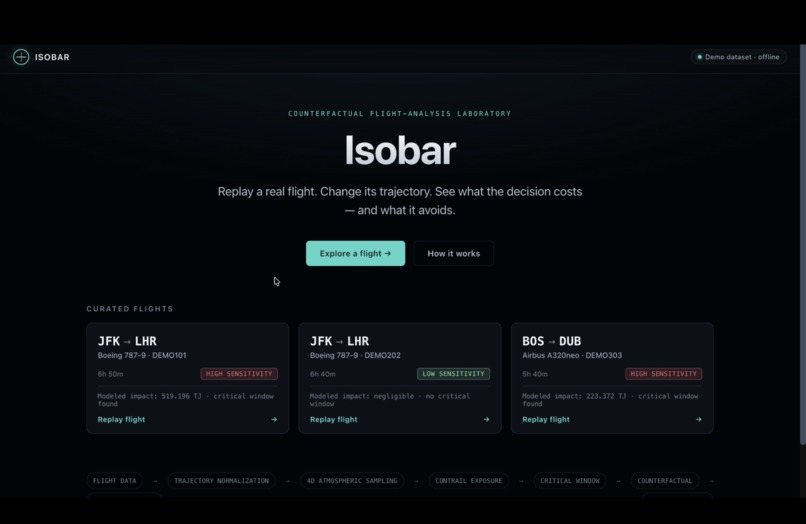
Main page
-
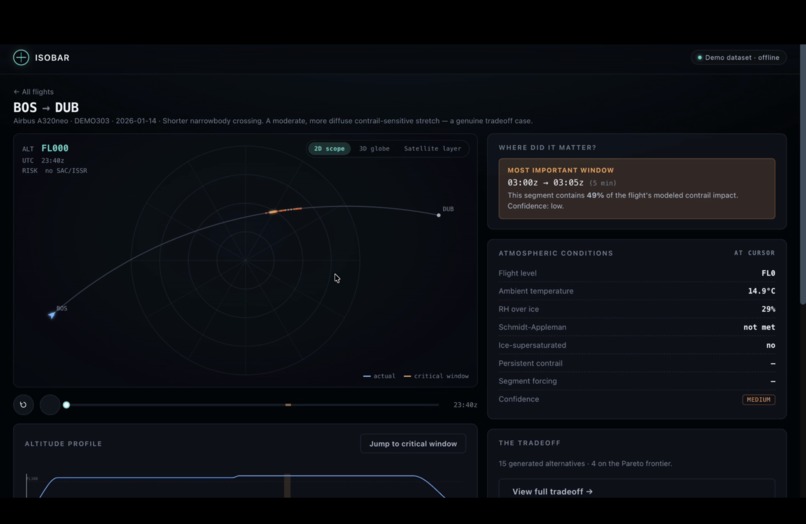
Flight Replay
-
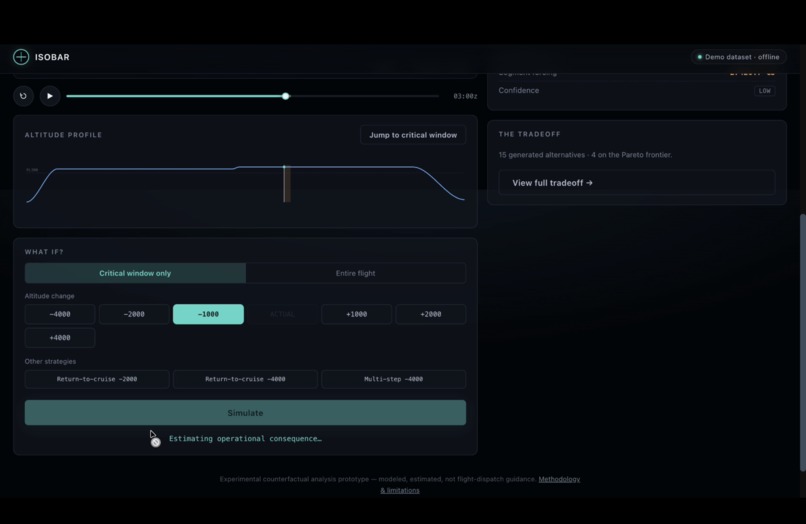
Flight what if scenario
-
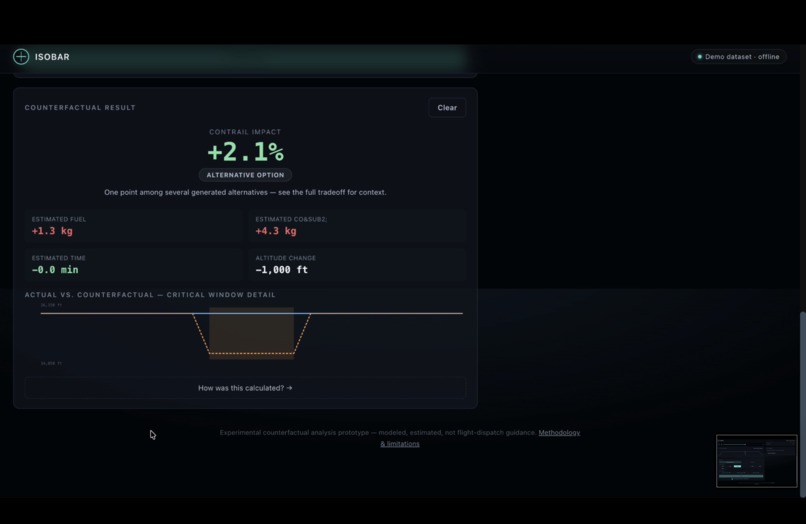
What if scenario results
-
Alternatives generated
Inspiration
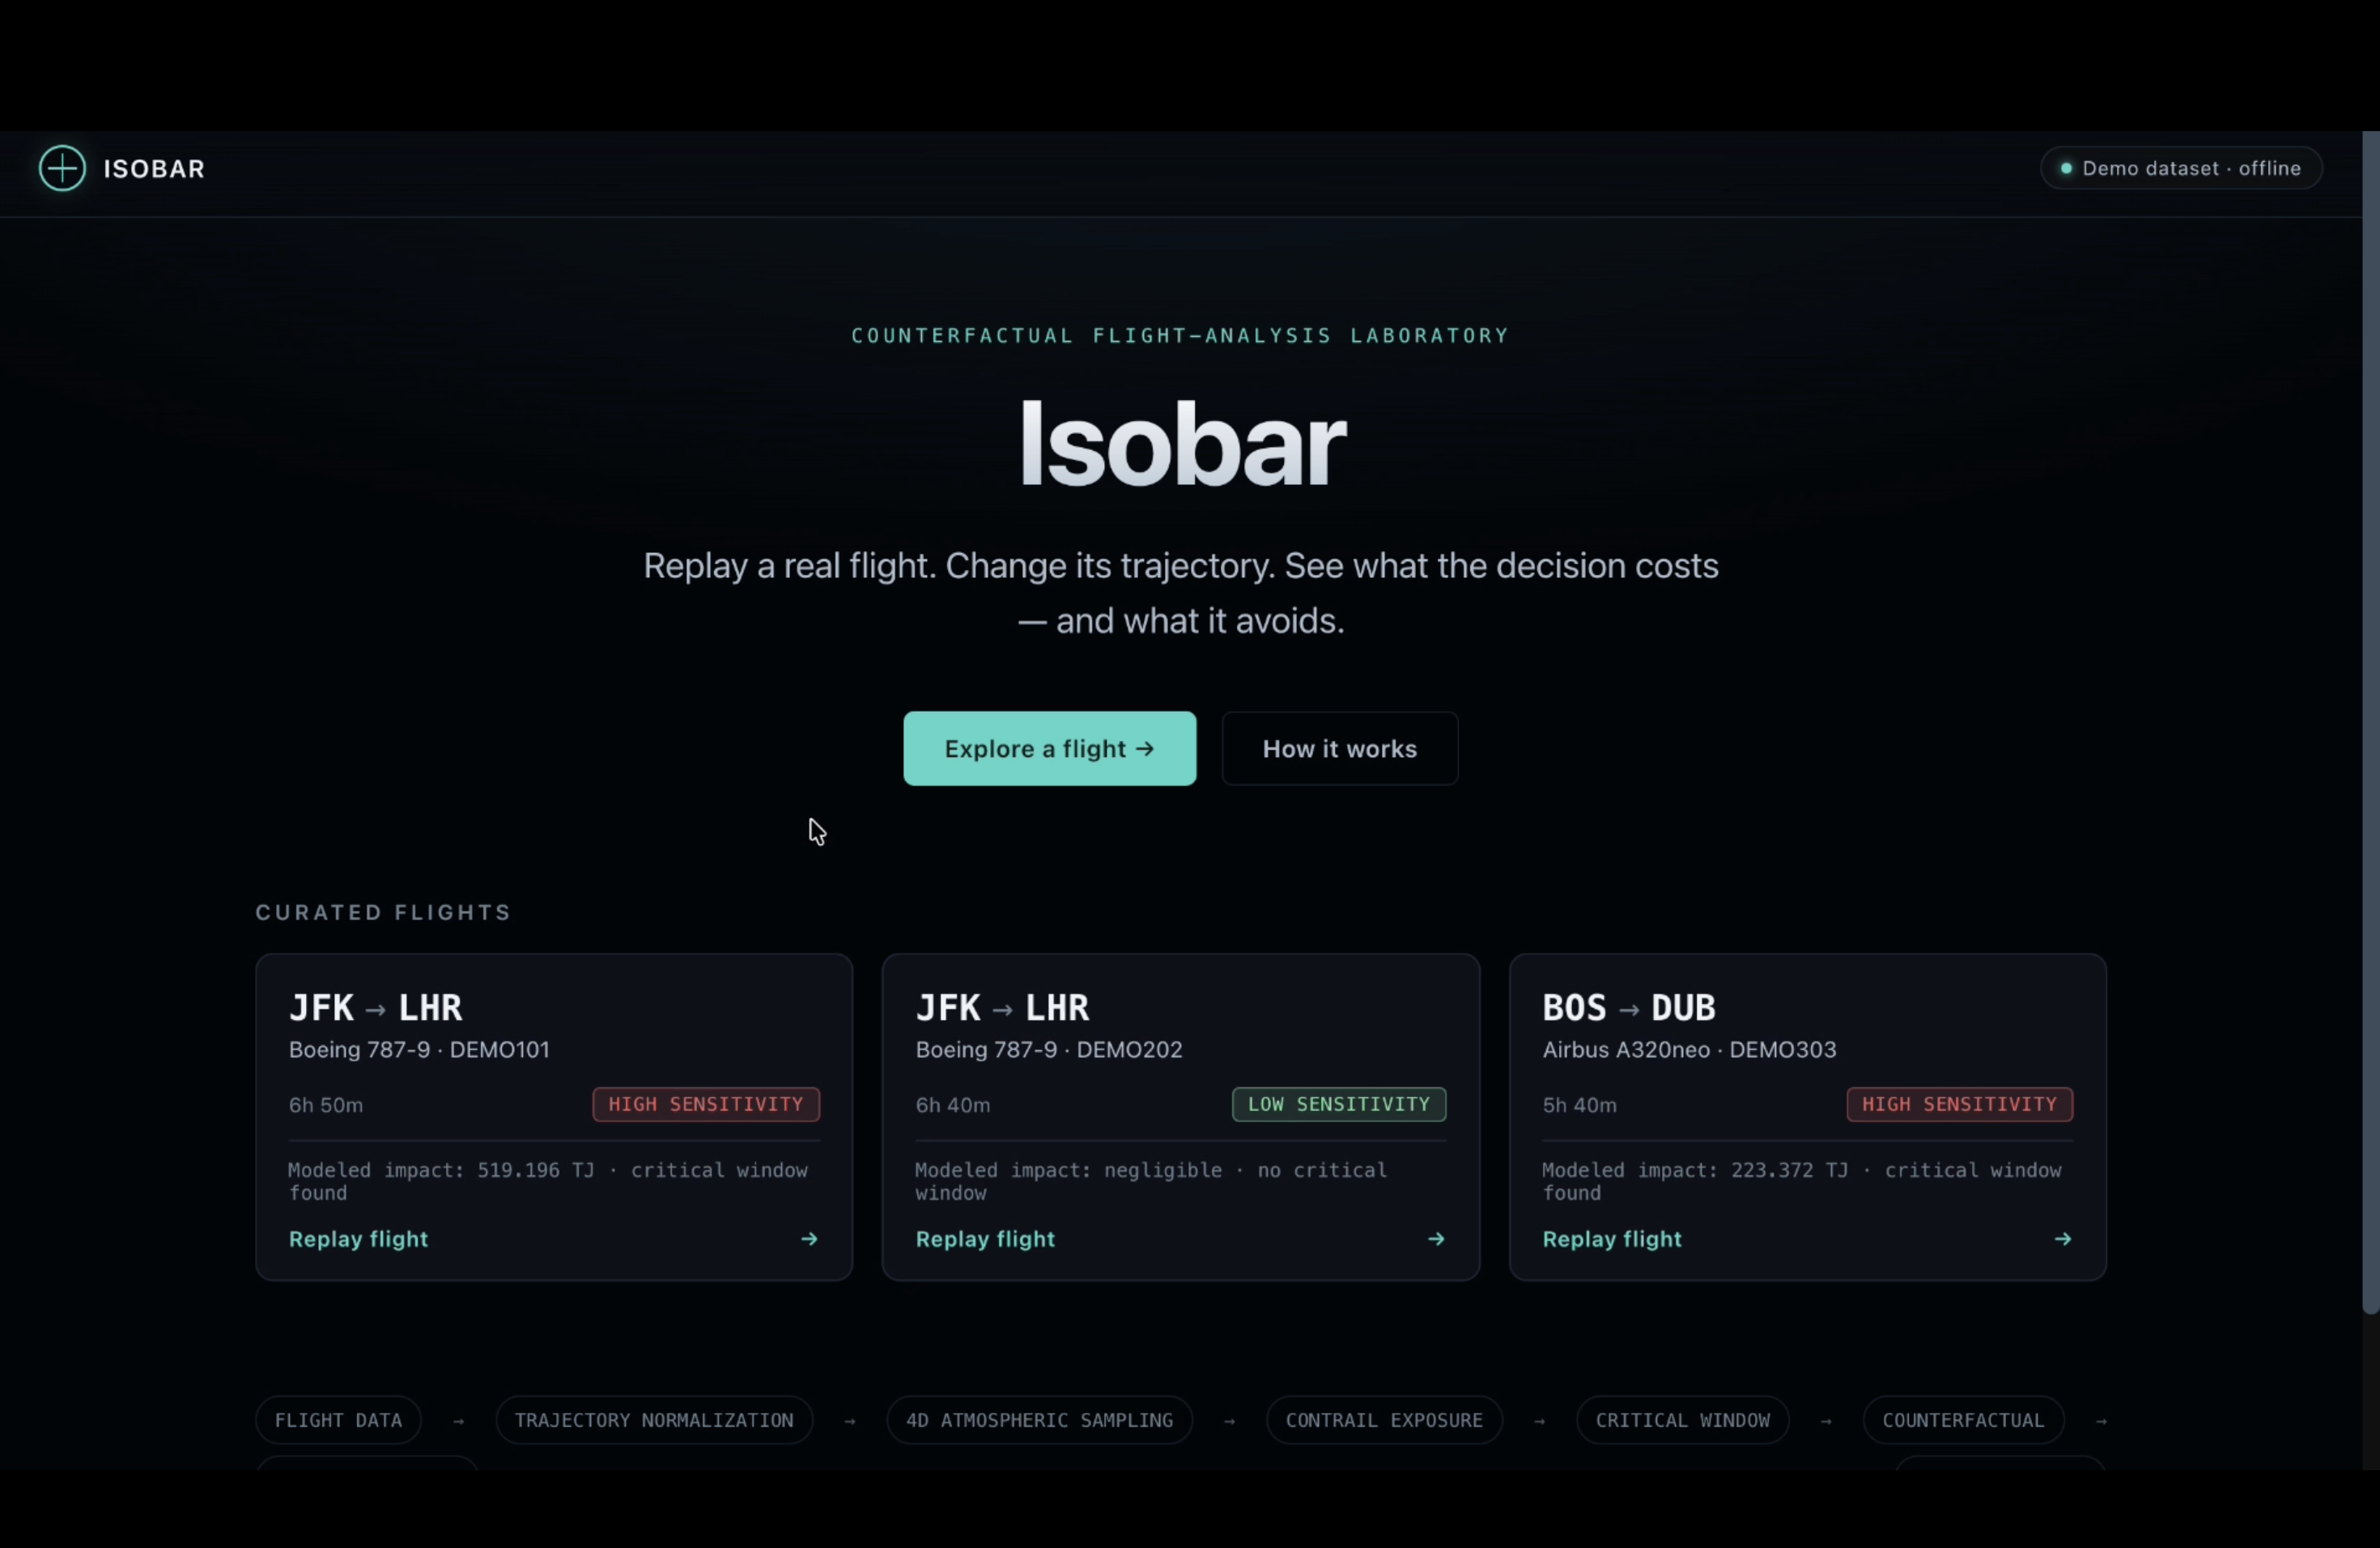
Contrails are one of aviation's strangest climate problems: on a per-flight basis, they can warm the planet more than the flight's own CO₂ emissions, and — unlike CO₂ — the fix isn't waiting decades for cleaner fuel. It's often a few thousand feet of altitude, for a few minutes, on the right flight. Real research groups (pycontrails/CoCiP, Google's Contrails API) have already shown this is measurable and, in trials, avoidable.
We wanted to make that idea tangible: not another dashboard that tells you contrails are bad, but a tool where you take one real flight, nudge its altitude, and watch the actual tradeoff — modeled impact down, fuel burn up (or vice versa) — play out in front of you. Isobar is that tool.
What it does
Isobar is a counterfactual flight-analysis laboratory. Give it a real flight, and it:
- Cleans and normalizes the trajectory — sorting, de-duplicating, and flagging (never silently deleting) physically impossible speed jumps.
- Models the atmosphere along the route and finds where contrail-forming conditions were concentrated, using Schmidt-Appleman / ISSR logic and an ICAO Standard Atmosphere temperature model.
Detects the critical window — the shortest contiguous span of the flight responsible for a target share of its total warming impact, rather than just flagging the single worst point:
\( \text{find } W \text{ minimizing } |W| \text{ s.t. } \sum_{t \in W} EF^{+}(t) \geq 0.4 \cdot \sum_{t} EF^{+}(t) \)
On our primary demo flight, an 8-minute window accounts for 44.5% of the whole flight's modeled impact.
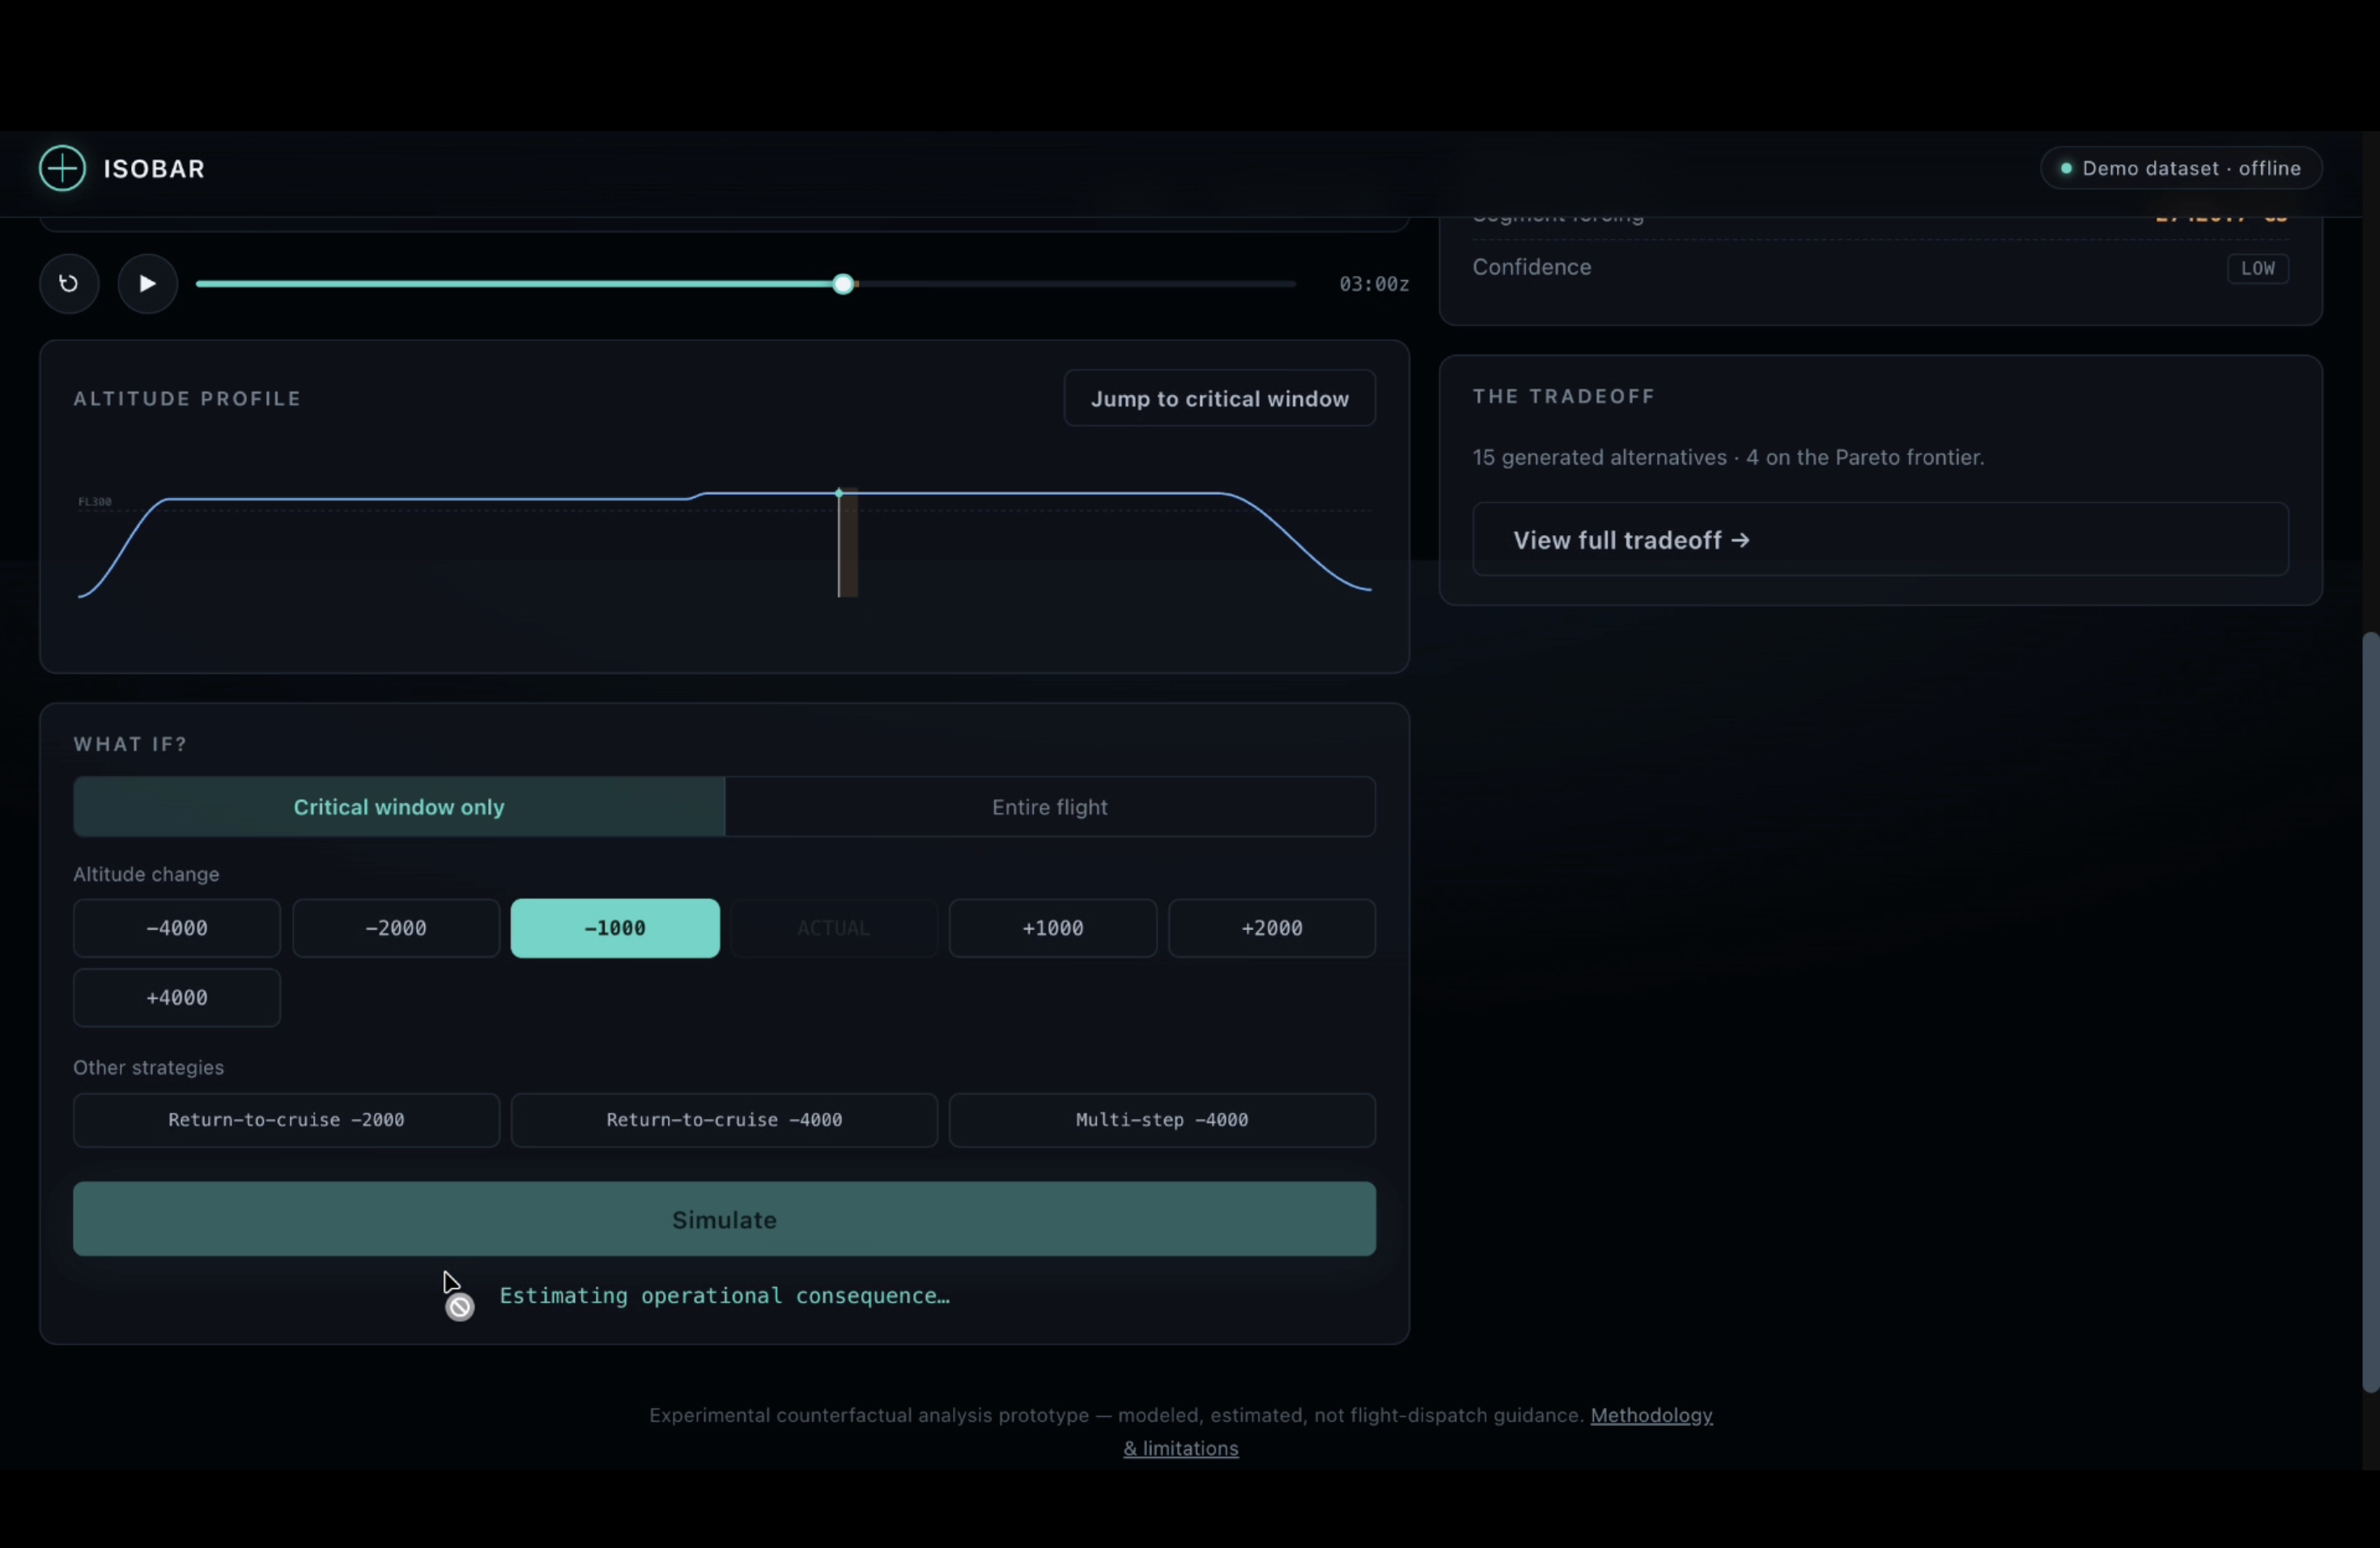
Generates counterfactual altitude profiles — five strategies (full-flight offset, critical-window descent/climb, return-to-cruise, multi-step) — all built on one kinematic ramp function that never produces an instant altitude jump, and is flagged infeasible with a human-readable reason if it can't physically happen.
Prices each alternative against a transparent operational-cost model: a parabolic fuel-flow penalty around the flight's actual recorded cruise altitude,
\( \Delta fuel(\Delta h) \approx a \cdot (\Delta h)^2 \)
plus a constant-Mach / ISA time delta, and a standard combustion factor for CO₂:
\( CO_2 = 3.16 \times fuel_{kg} \)
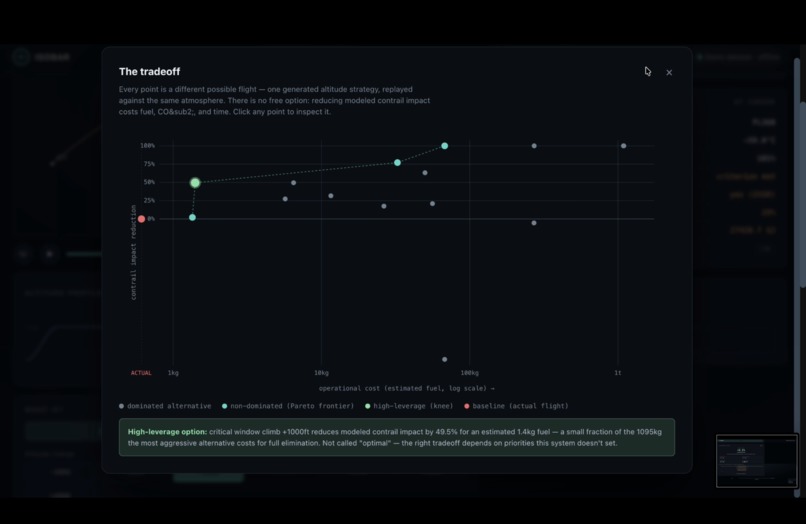
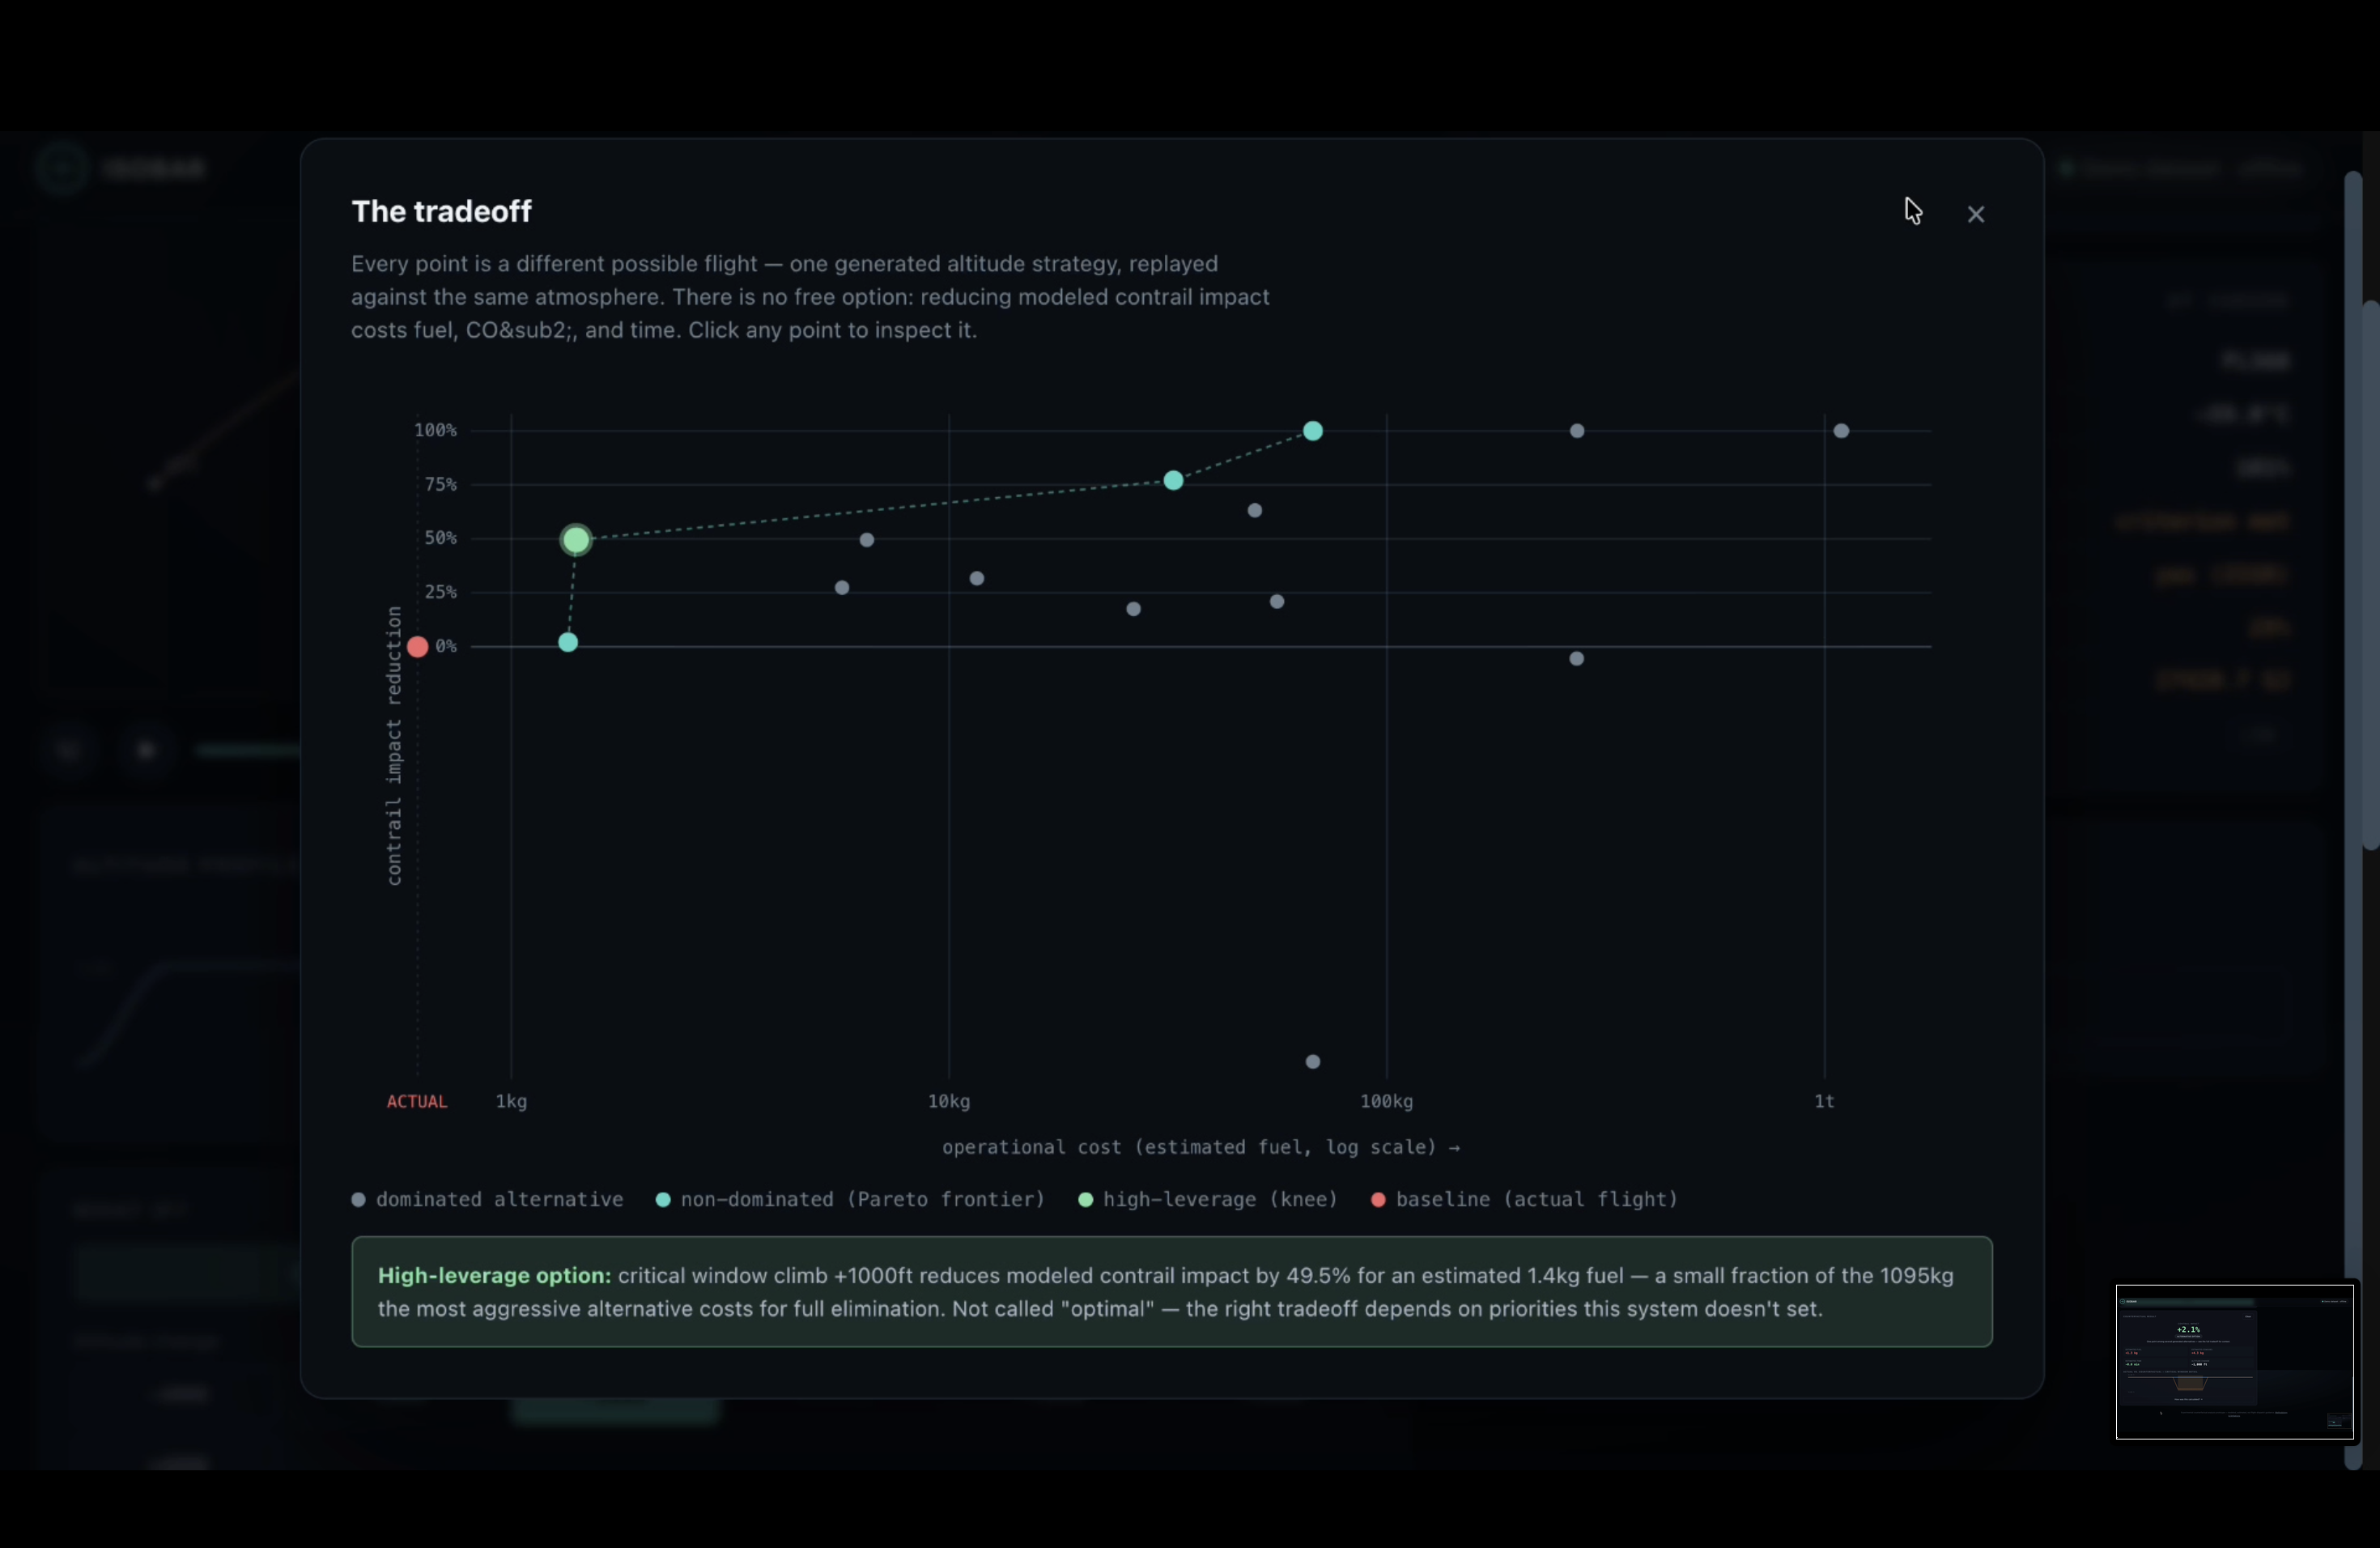
Plots the tradeoff on a Pareto frontier (lower cost and higher impact reduction dominates) with a geometric "knee point" — the alternative offering the most benefit per unit of cost, explicitly never called "optimal."
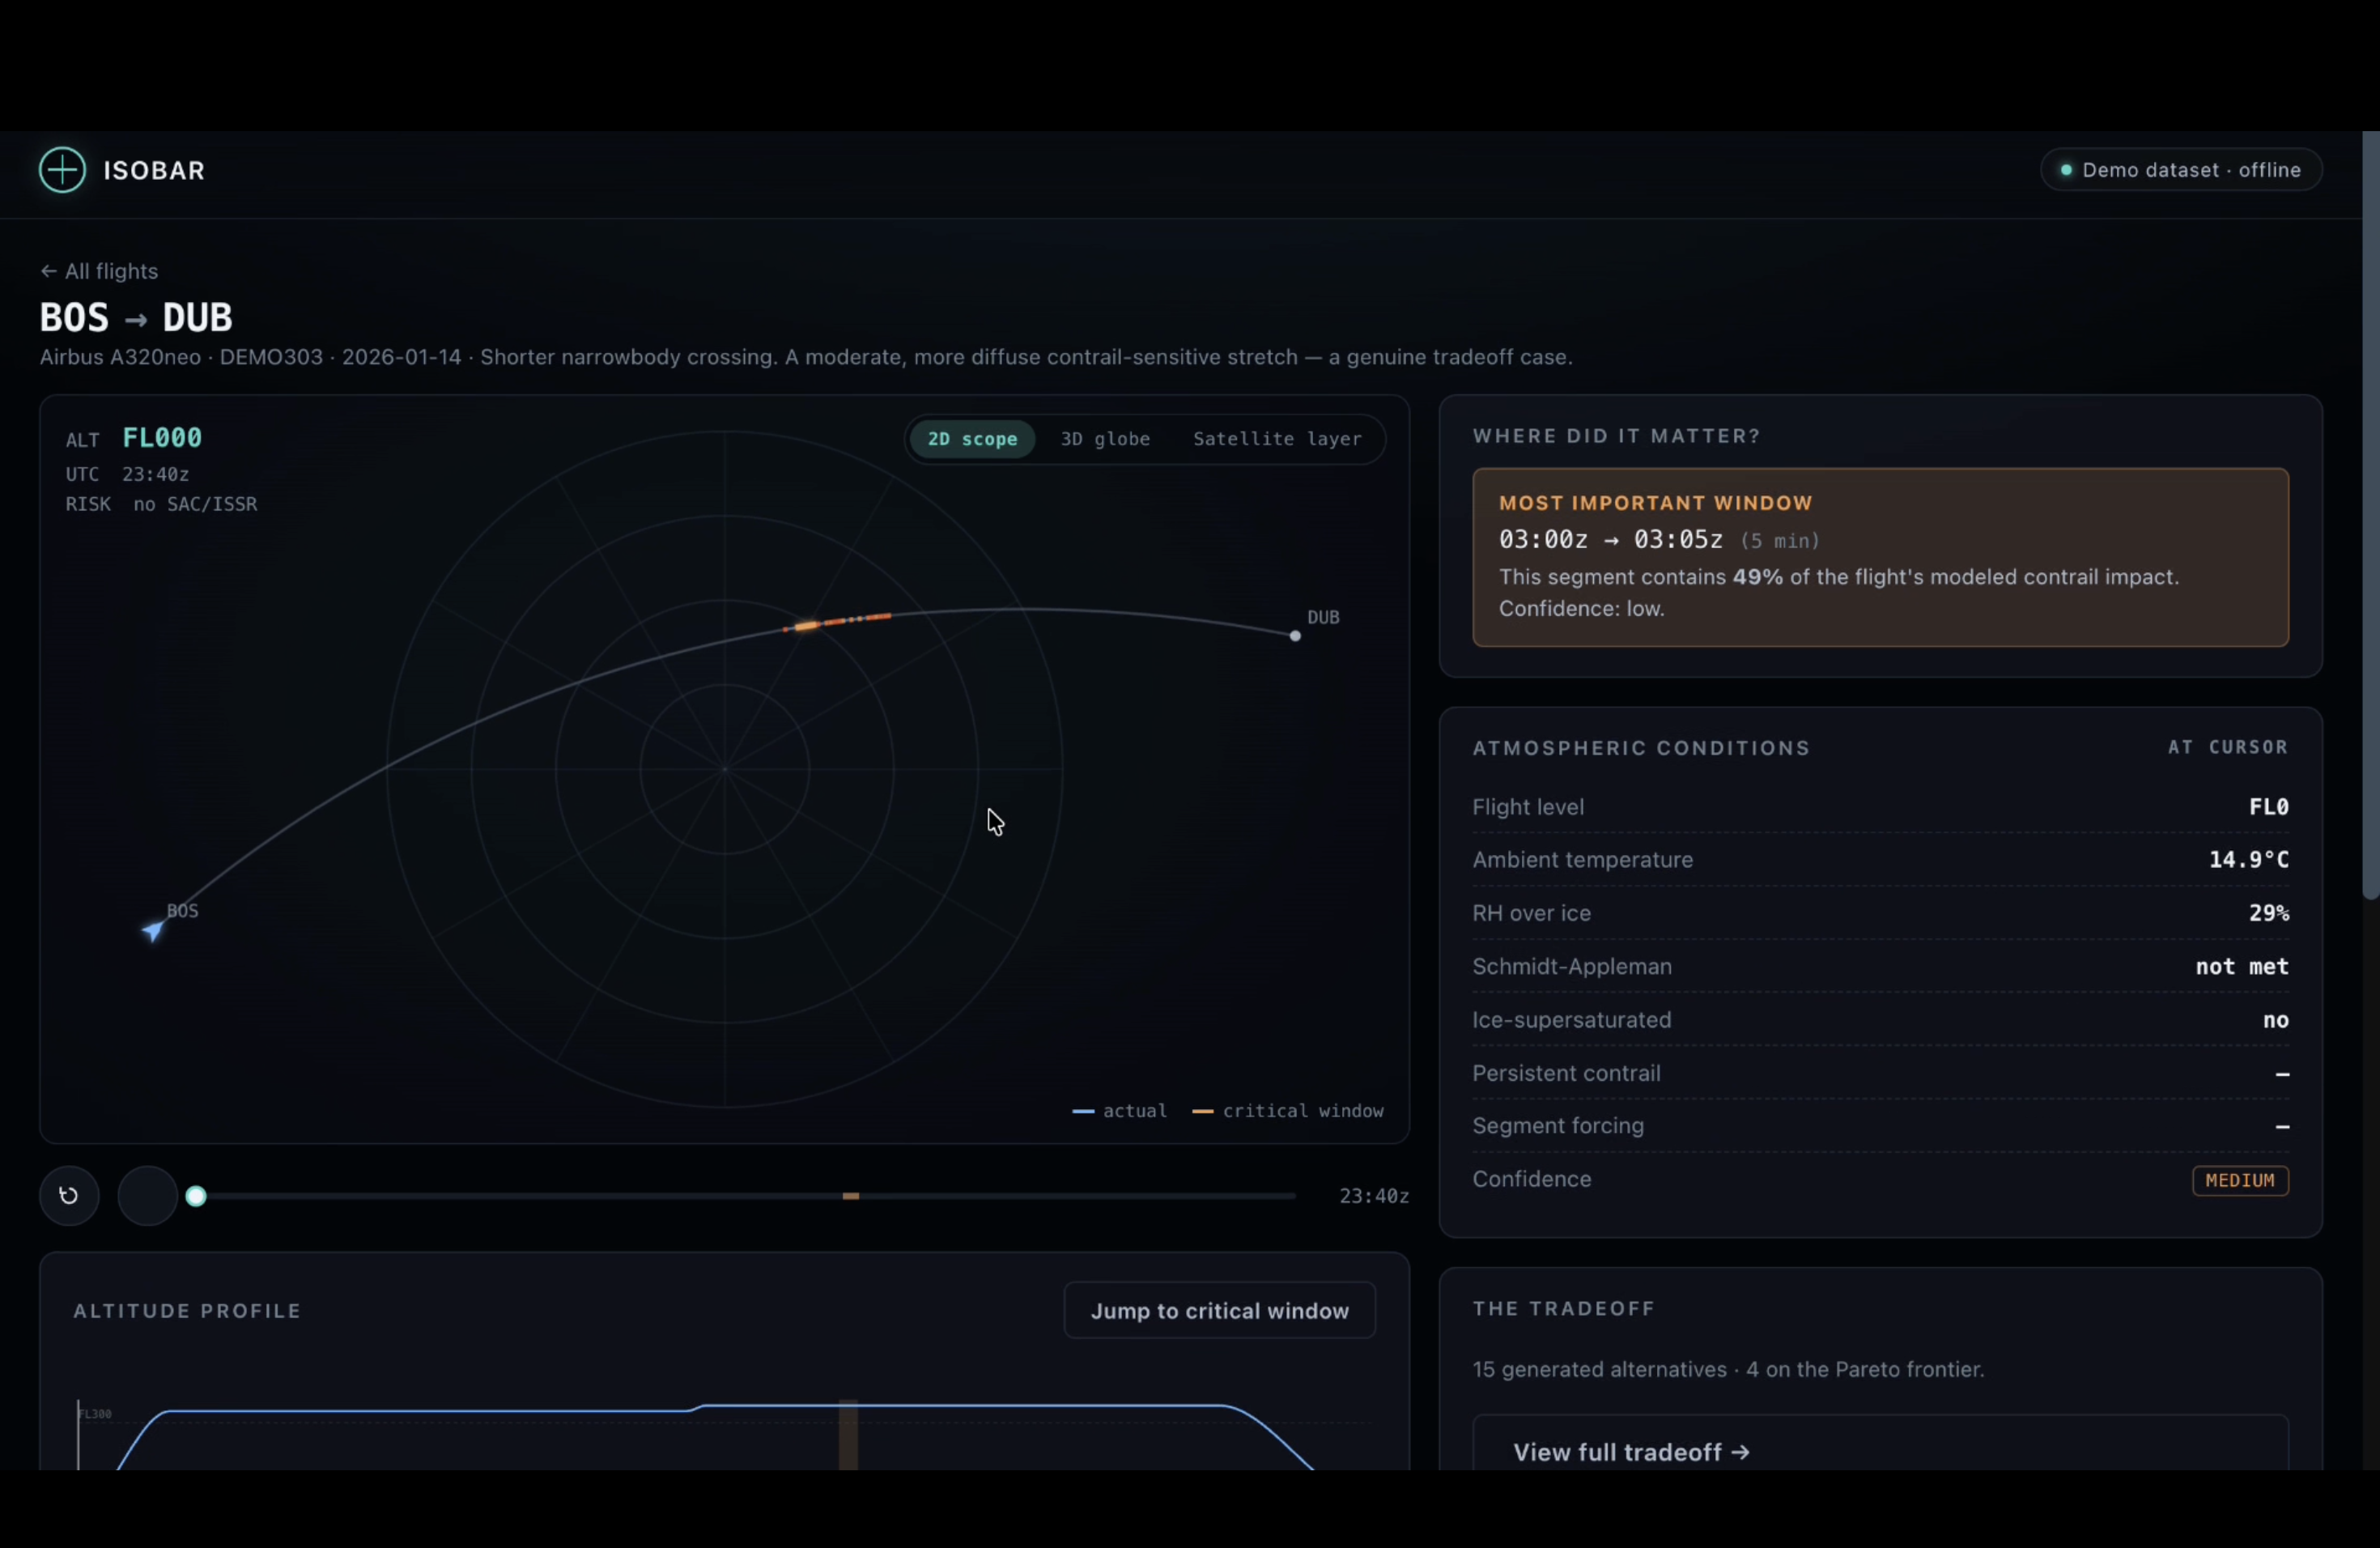
Lets you explore all of it interactively — a 2D radar-style scope with range rings and risk-colored route segments, an optional 3D globe, a WHAT IF? builder to try any altitude offset or strategy, and a log-scale Pareto chart (fuel costs across the generated alternatives span roughly three orders of magnitude, so linear axes would flatten everything near zero).
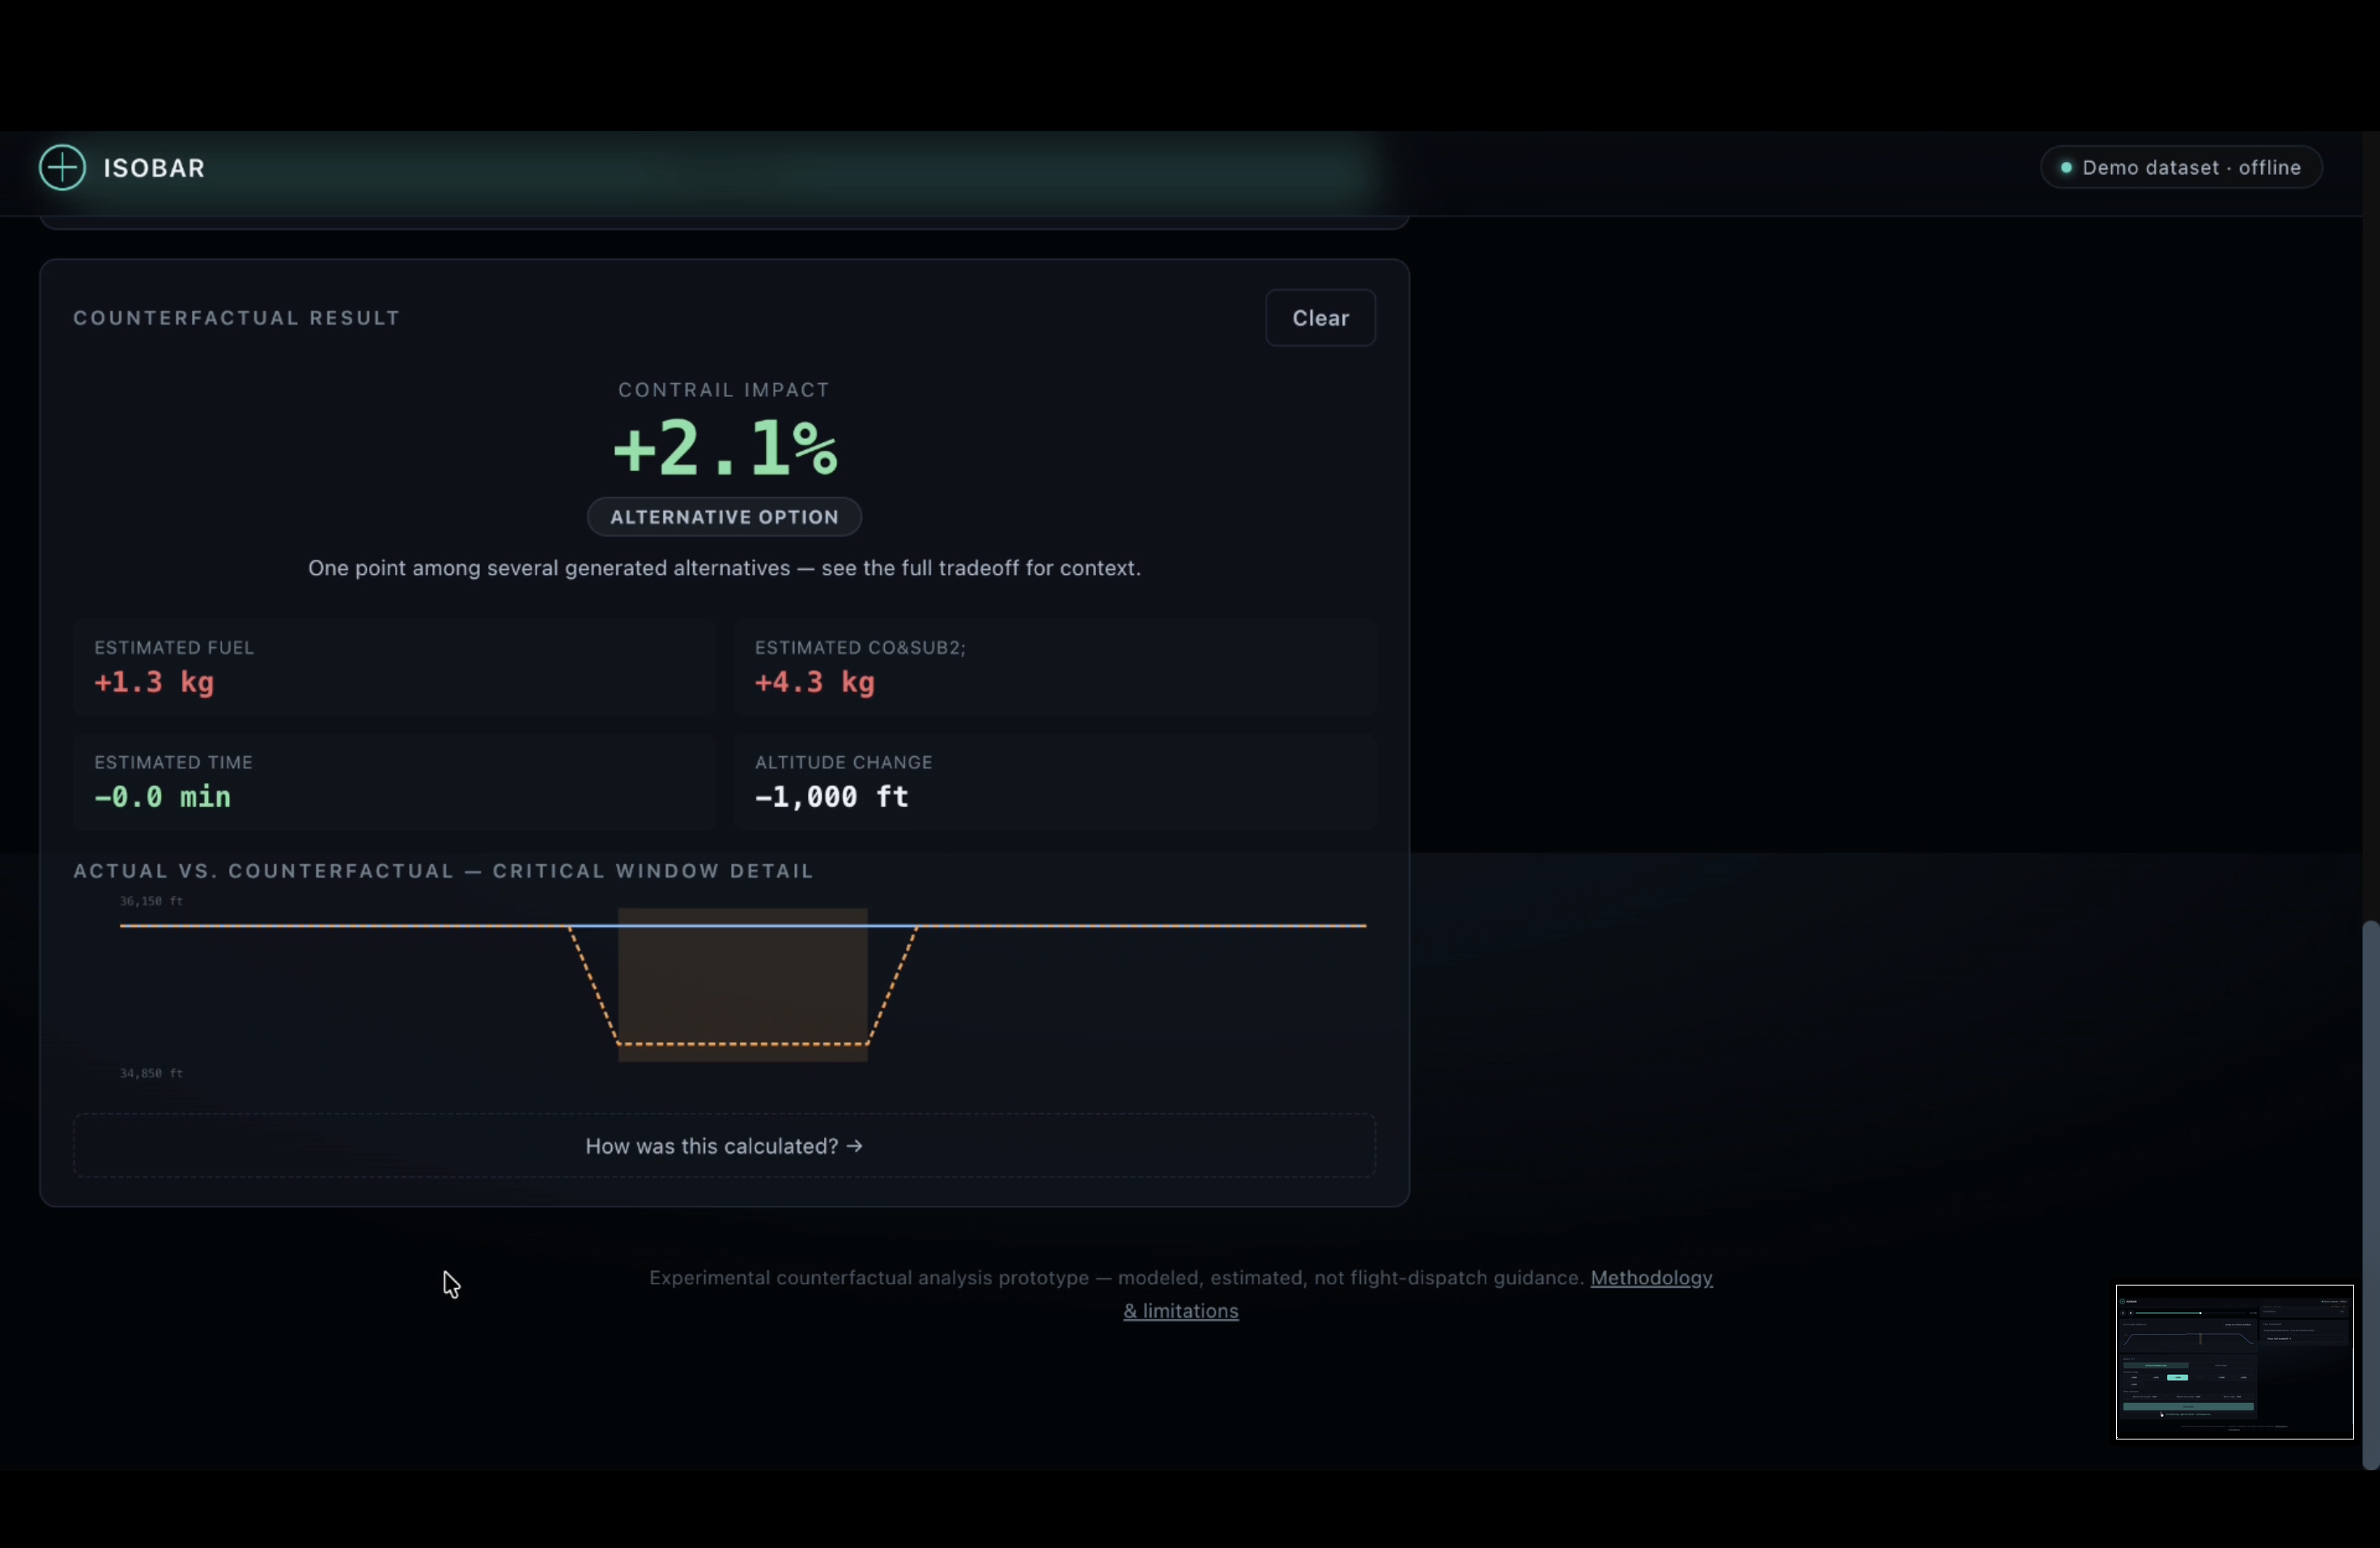
On our JFK→LHR 787-9 demo flight, the knee-point option is a 1,000 ft climb through the critical window: a 44.8% reduction in modeled warming impact for 4.9 kg of fuel and 15.5 kg of CO₂.
How we built it
- Science/simulation engine in strict-mode TypeScript (
src/science,src/simulation,src/models) — trajectory normalization, atmospheric field modeling, critical-window detection, the counterfactual generator, the cost model, and Pareto analysis, all built around a real internal domain model (Flight,TrajectoryPoint,AtmosphericSample,Counterfactual,TradeoffPoint) so the science layer never depends on any one data provider's response shape. - Data layer: a
ContrailProviderabstraction with real implementations for the OpenSky Network (OAuth2 client-credentials auth,/api/tracks/all) and Google's Contrails API (/v2/regions,/v2/detections, real GeoJSON + point-in-polygon logic), alongside a deterministic demo/cached provider so the whole thing runs fully offline. Live connectivity to both real API domains has been verified. - A live Node server (
server.ts, plainnode:http, no framework) that serves the built app and exposes real routes that actually call OpenSky/Google when API keys are present. - Frontend: a single self-contained HTML page assembled from framework-free modules — a canvas-based 2D radar scope, a Three.js (r128, pinned UMD) 3D globe with custom drag/zoom controls and no
OrbitControlsdependency, the WHAT IF? builder, and the Pareto explorer — bundled with esbuild so the exact sameanalyzeFlight()pipeline runs client-side as in our precompute script. - Testing:
node:testend to end — 60 science/simulation/provider tests plus 29 pure-function UI-logic tests, runnable with zero network access.
Challenges we ran into
- Building for "demo now, live later" without faking anything. The build environment has no outbound network access, so every "real" data source needed an honestly-labeled offline stand-in instead of an invented one. We tagged every
FlightwithdataProvenance.source("reconstructed-representative"vs"opensky-historical") and grounded the synthetic atmospheric field in real, documented CoCiP energy-forcing percentile distributions rather than random numbers, so demo-mode output is honest about what it is. - Making a few-thousand-foot change visible. A 1,000–4,000 ft shift is invisible on a 0–38,000 ft altitude axis, so the results panel needed its own zoomed actual-vs-counterfactual chart just to make the intervention legible.
- Cost values spanning three orders of magnitude. Generated alternatives for the same flight range from ~4.8 kg to ~3,192 kg of fuel; a linear Pareto axis crushed everything near the origin, which is what pushed us to a log-scale cost axis.
- Never letting a kinematically impossible altitude change through. Every profile transition runs through one shared ramp function with a documented climb/descent rate, so an "infeasible" result is flagged with a reason instead of silently rendered as if it were flyable.
Accomplishments that we're proud of
- A full science pipeline — trajectory cleaning through Pareto analysis — with 60/60 engine and provider tests passing, in strict TypeScript, with zero LLM calls anywhere in the computation path.
- Real, working, independently-tested clients for both OpenSky and Google's Contrails API (OAuth2 auth, GeoJSON parsing, live-verified connectivity), sitting behind an abstraction that means swapping demo data for live data touches zero lines of
src/scienceorsrc/simulation. - An interactive 2D radar scope and a 3D globe that both stay fully usable on their own — the globe is a genuine enhancement layered on top, not a requirement, and falls back automatically if WebGL isn't available.
- A Pareto/knee-point view that shows the honest picture, including alternatives that made things worse, rather than only showing the flattering ones.
What we learned
- How the Schmidt-Appleman criterion and CoCiP-style energy forcing actually work well enough to model them credibly, and how differently "impact reduced" and "CO₂ emitted" need to be reported — they're not the same unit and shouldn't be silently converted into each other.
- That an honest "what's real vs. simulated" data table is a stronger foundation for a hackathon build than a feature list, especially without network access during development.
- How much interaction design work goes into making a small, physically real change (a few thousand feet of altitude) actually read as meaningful on screen, rather than getting lost against a much larger scale.
What's next for Isobar — Counterfactual Flight Replay Engine
- Wire the already-implemented OpenSky and Google Contrails clients into the live server path for a real flight, end to end, in the deployed demo — the API integrations exist and are tested; the next step is surfacing that live-key capability in the UI itself rather than only through
npm run serve:live. - Swap the parabolic fuel model for a real OpenAP performance model for a small set of common aircraft types.
- Batch analysis across a route or a day's schedule, to find which flights carry the most high-leverage critical windows rather than analyzing one flight at a time.
Built With
- esbuild
- google-contrails-api
- html5
- node.js
- opensky-network-api
- three.js
- typescript
- webgl

Log in or sign up for Devpost to join the conversation.