-
"PINN-acle" (Options Analysis)
-
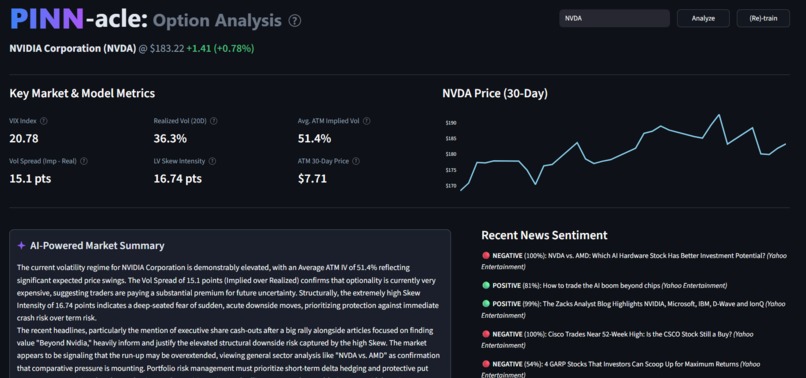
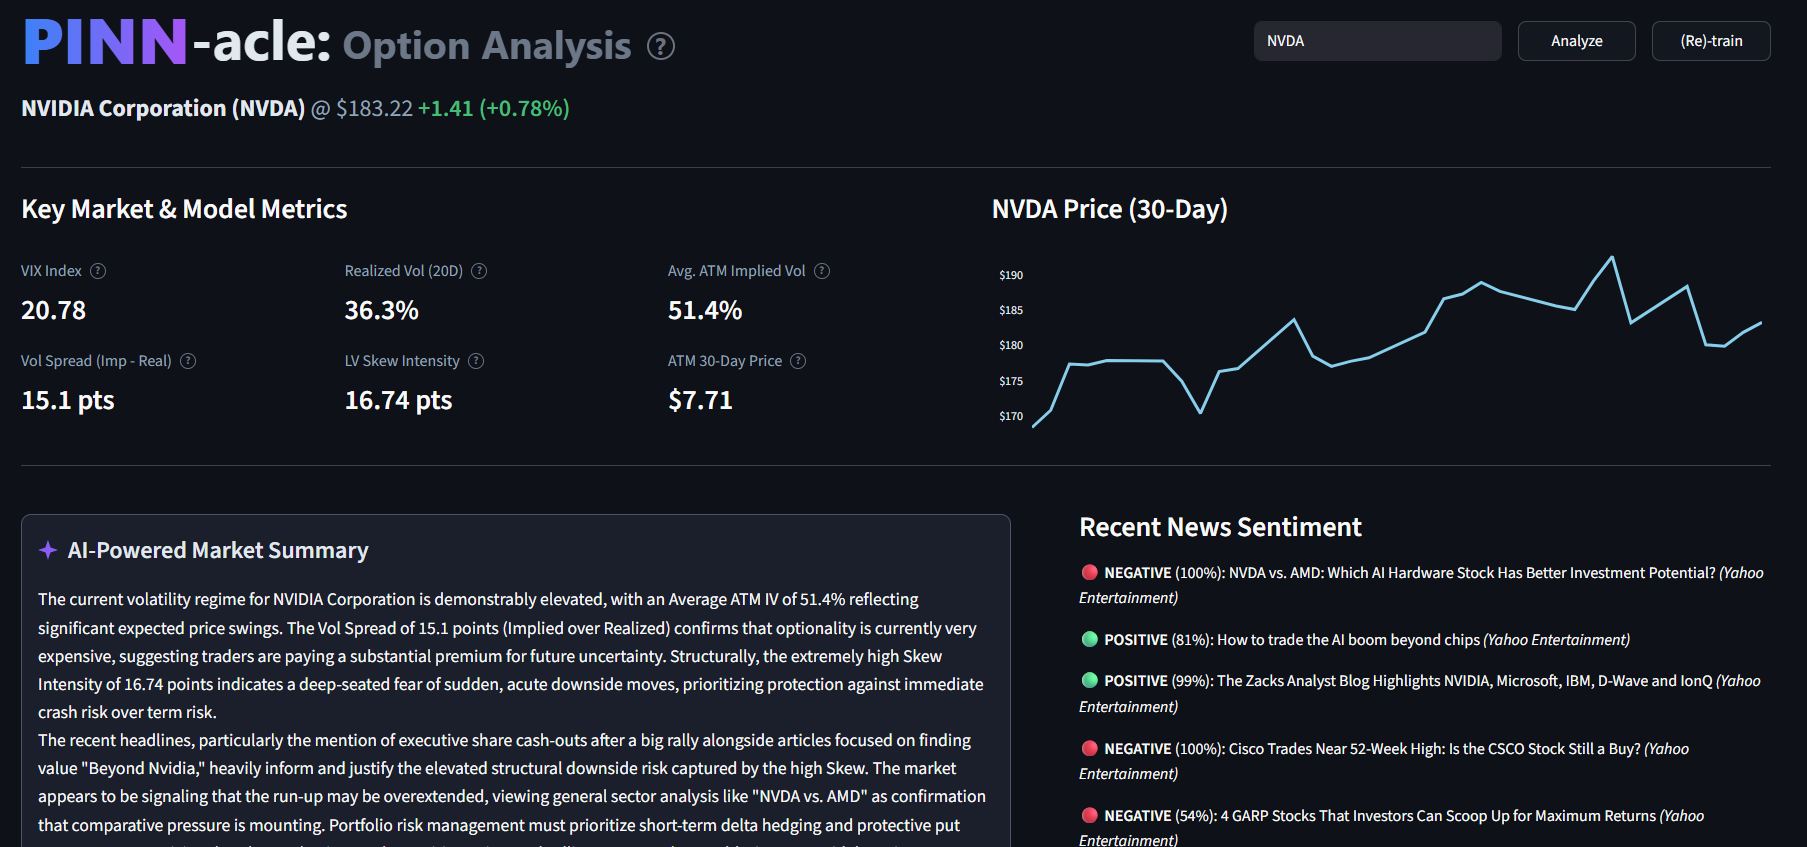
Main dashboard (NVDA)
-
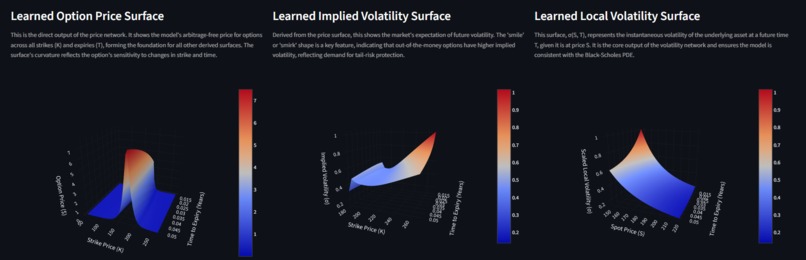
Pricing and volatility surfaces (NVDA)
-
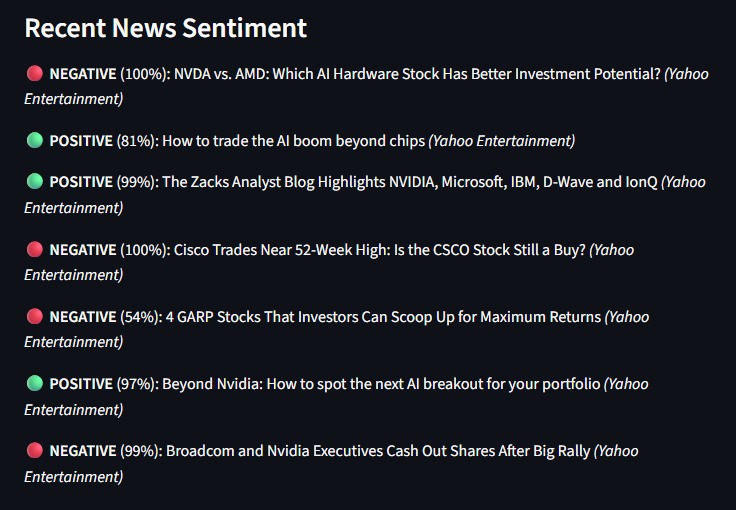
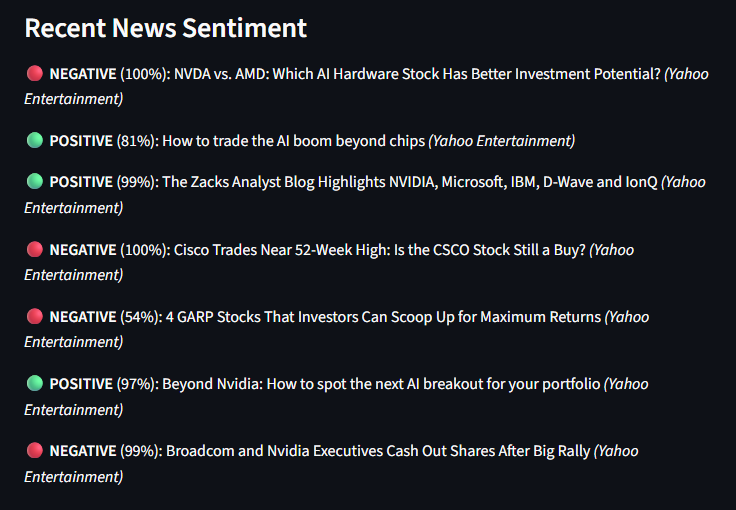
Sentiment Analysis (NVDA)
-
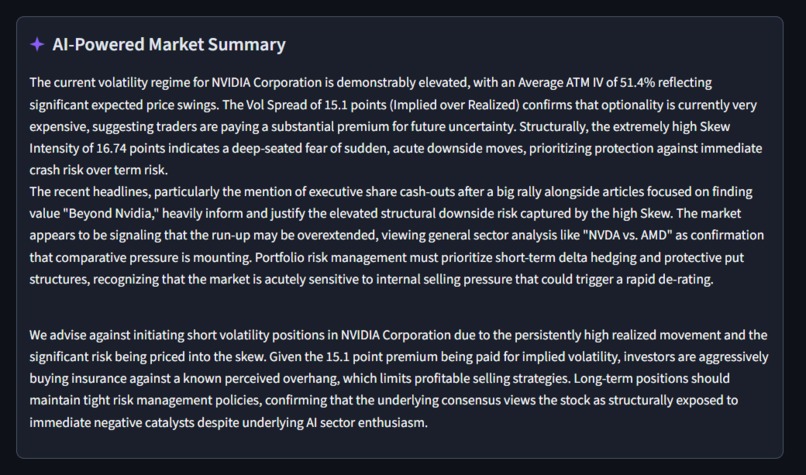
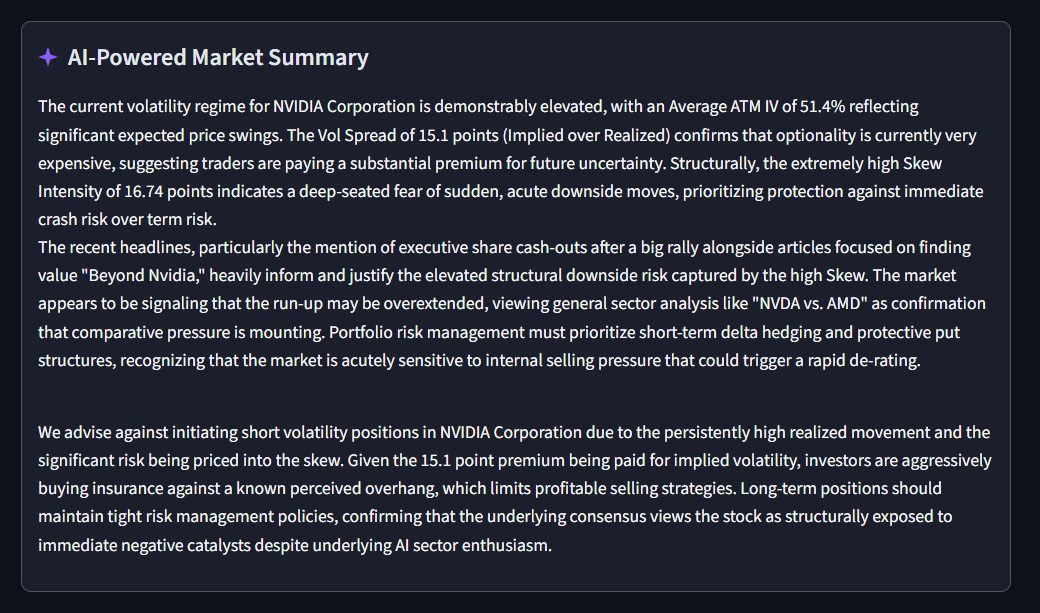
AI Data interpretation (NVDA)
-
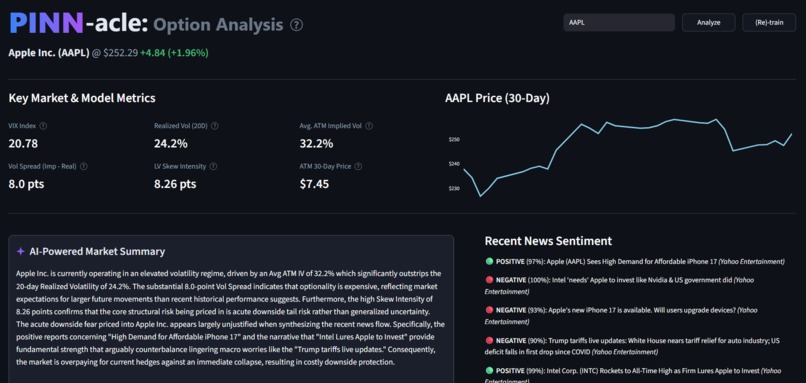
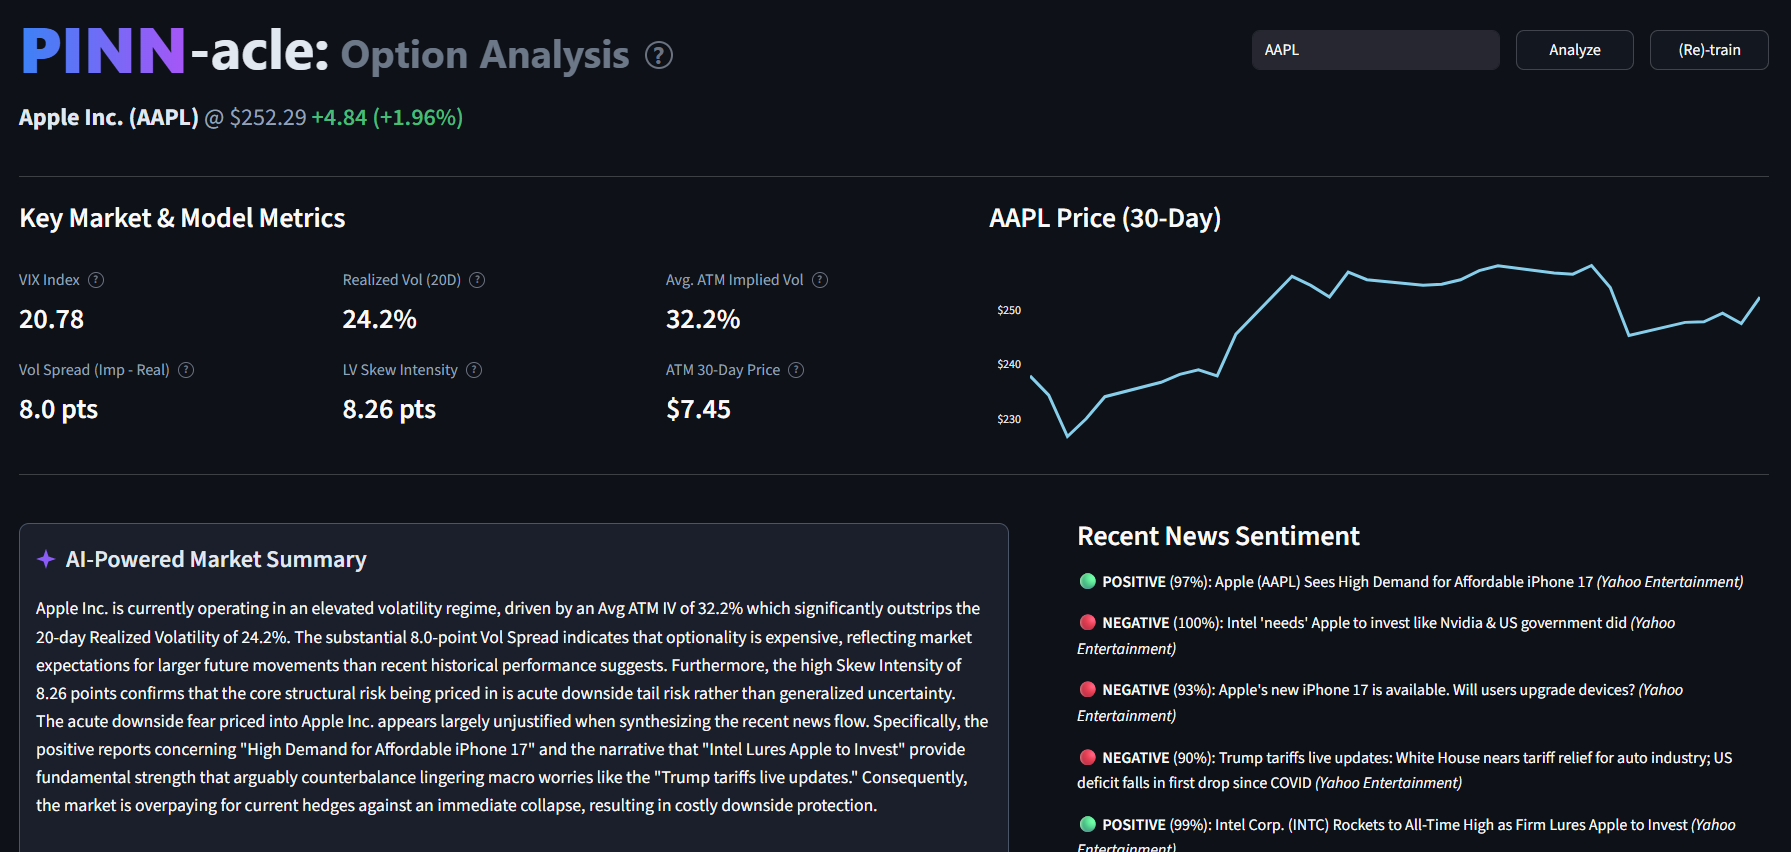
Main dashboard (AAPL)
-
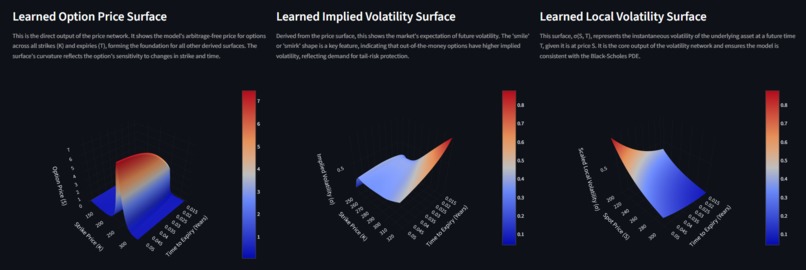
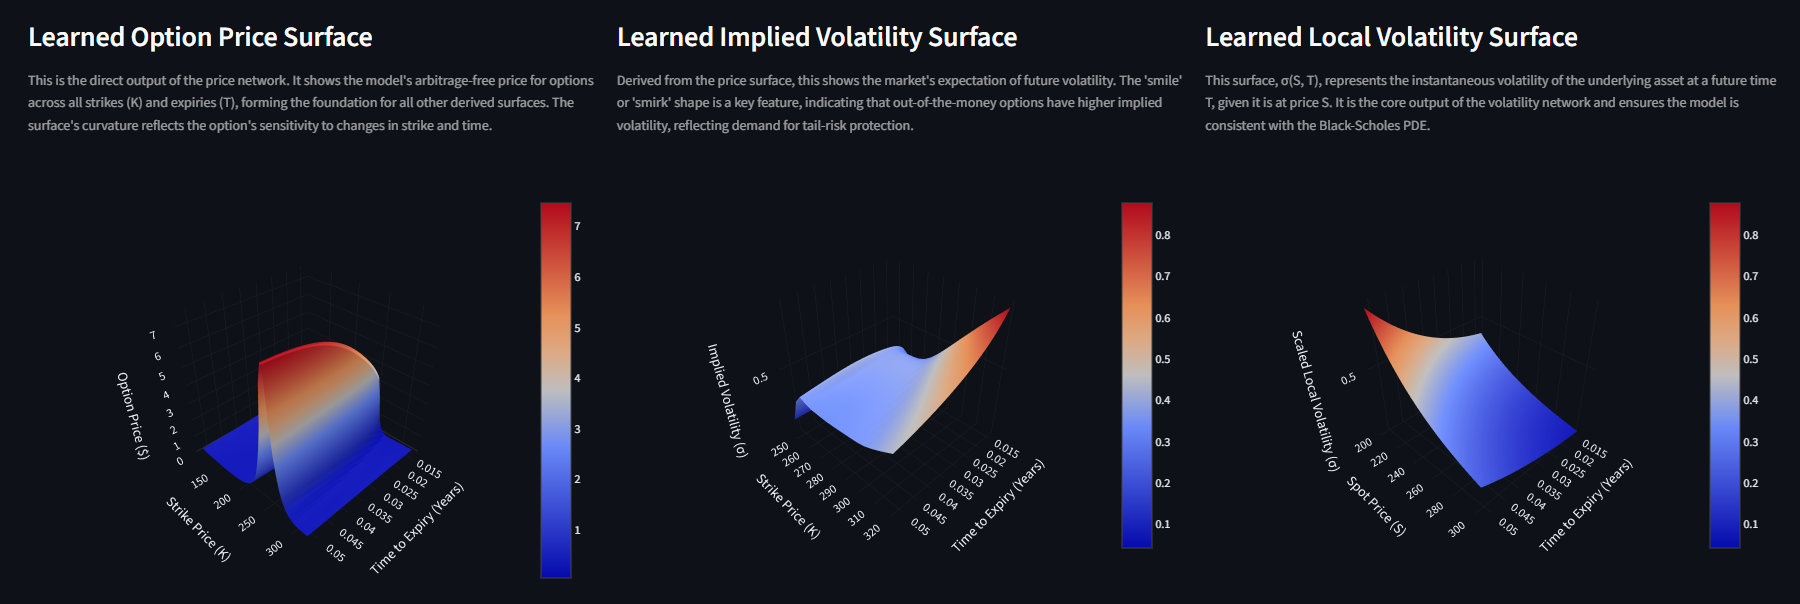
Pricing and volatility surfaces (AAPL)
-
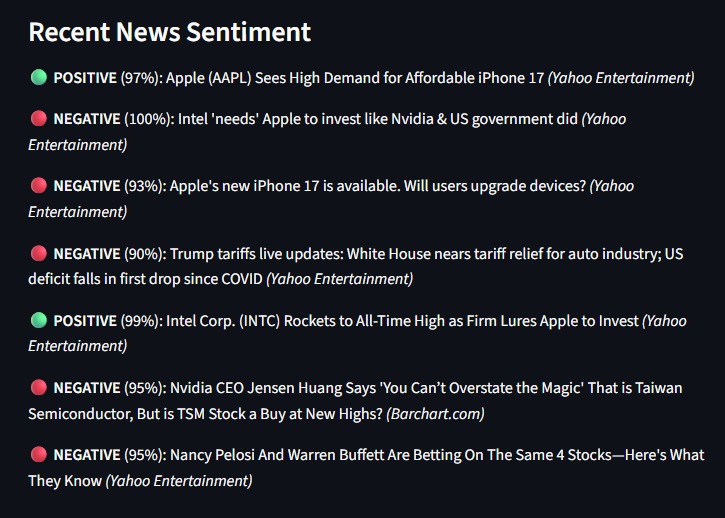
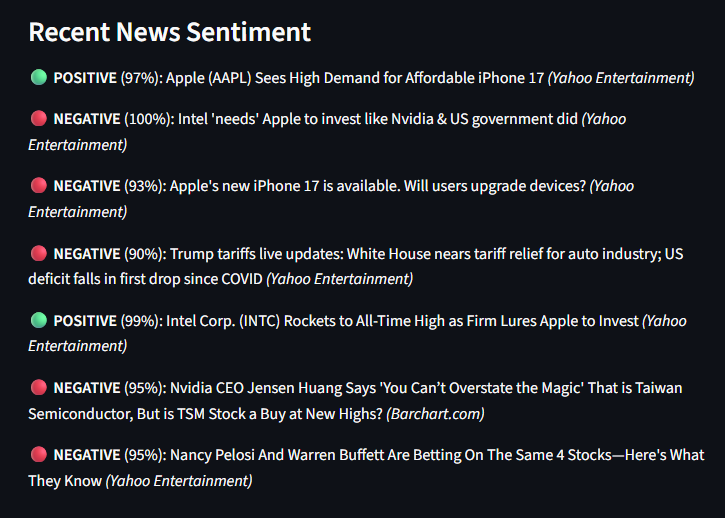
Sentiment Analysis (AAPL)
-
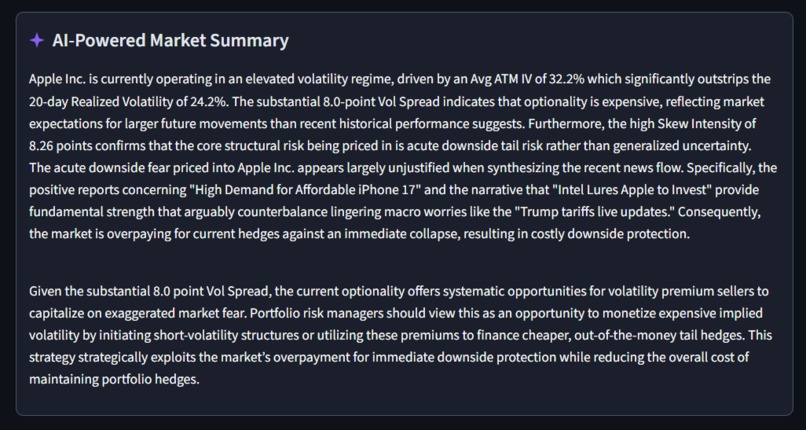
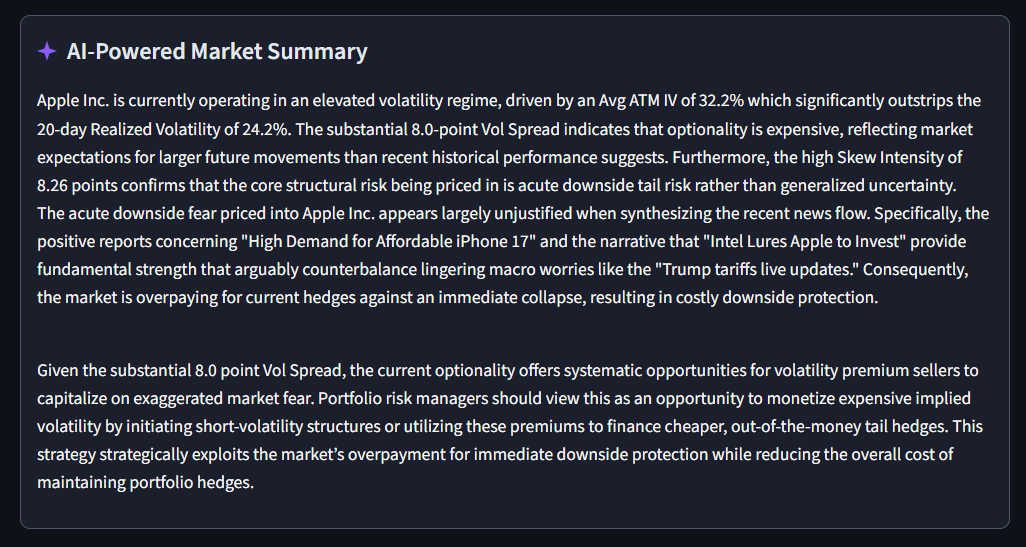
AI Data interpretation (AAPL)

Inspiration
I was very interested in PINNs, and wanted to explore their possible implementations into financial markets, specifically with interpreting and presenting solutions to sparse data sets. I was also interested in options as a whole, and this was the perfect opportunity to mesh these passions.
What it does
Uses NNs and PINNs to extract asset Pricing and Volatility - it merges market and news sentiment data to present key features of listed assets. Uses an LLM to translate this analysis into clear and actionable insights targeted to consumers and traders.
How I built it
Implemented in Python:
- Data: yfinance
- Option Analysis: NumPy, Pandas, PyTorch, Black-Scholes Equation, PINNs
- Sentiment Analysis: News API, Hugging Face
- LLM interpretation: Gemini Flash 2.5 API
- Interface: Streamlit
Challenges I ran into
- Pulling some meaningful data from yfinance
- Manipulating the Black-Scholes equation for the loss function and auto-differentiation
- Normalising and tweaking the weights to balance the data, PDE and BC terms in minimizing total loss
- Verifying the validity of the pricing and volatility surfaces
- Getting Gemini Flash 2.5 to output a meaningful and concise analysis
- Expanding the capability to all tickers accessible through yfinance
Accomplishments that I'm proud of
- First successful implementation of a PINN
- Generating plausible surfaces after much difficulty
- The successful expansion to all tickers (before the deadline)
What I learned
- New Packages used: yfinnance, News API, Hugging Face, Google Gemini API, Streamlit
- Some basic knowledge of options, volatility, and their implications on assets, both through implementing and utilizing the solution

Log in or sign up for Devpost to join the conversation.