-
-

System Architecture
Inspiration
Engineers and SREs spend too much time switching between dashboards, logs, and ticketing systems when an alert fires. They manually correlate errors across hosts, guess at root cause, and then open Jira or PagerDuty to create a ticket—often with incomplete context. We wanted an agent that runs the full incident loop in one go: take an alert or a natural-language question, search and analyze data in Elasticsearch, produce a root-cause hypothesis with evidence, and optionally create a ticket—all in a single API call. We built it using Elastic Agent Builder, with Agent Builder’s Search and ES|QL tools and Elasticsearch as the system of record, so that retrieval and correlation are driven by Search and ES|QL (no separate monitoring integration). The inspiration is speed to resolution and actionable outcomes, not another chatbot over logs.
What it does
IROA is a multi-step AI agent built using Elastic Agent Builder. It uses Agent Builder’s Search and ES|QL tools over Elasticsearch and a reasoning step to automate incident response. Specifically, IROA:
- Accepts a natural-language query or alert description (via API, CLI, or web UI).
- Runs ES|QL over Elasticsearch (e.g. error count by host, time-bounded) and Search over log indices (full-text, filters, time range).
- Correlates results (time windows, hosts, services) and generates a summary and root-cause hypothesis with confidence.
- Optionally creates a Jira ticket with the summary and link, using the same run.
- Returns a structured response: summary, root_cause, evidence (citations to ES docs), actions_taken, audit_trail, and explanation.
Interfaces: REST API (POST /analyze), Typer CLI (iroa analyze "..."), and a web demo UI (FastAPI-served at GET /) so you can type a query, set a time range, and click Analyze.
Integrations:
- Jira: Native connector creates issues with description in Atlassian Document Format (ADF); ticket key and link are returned in the response.
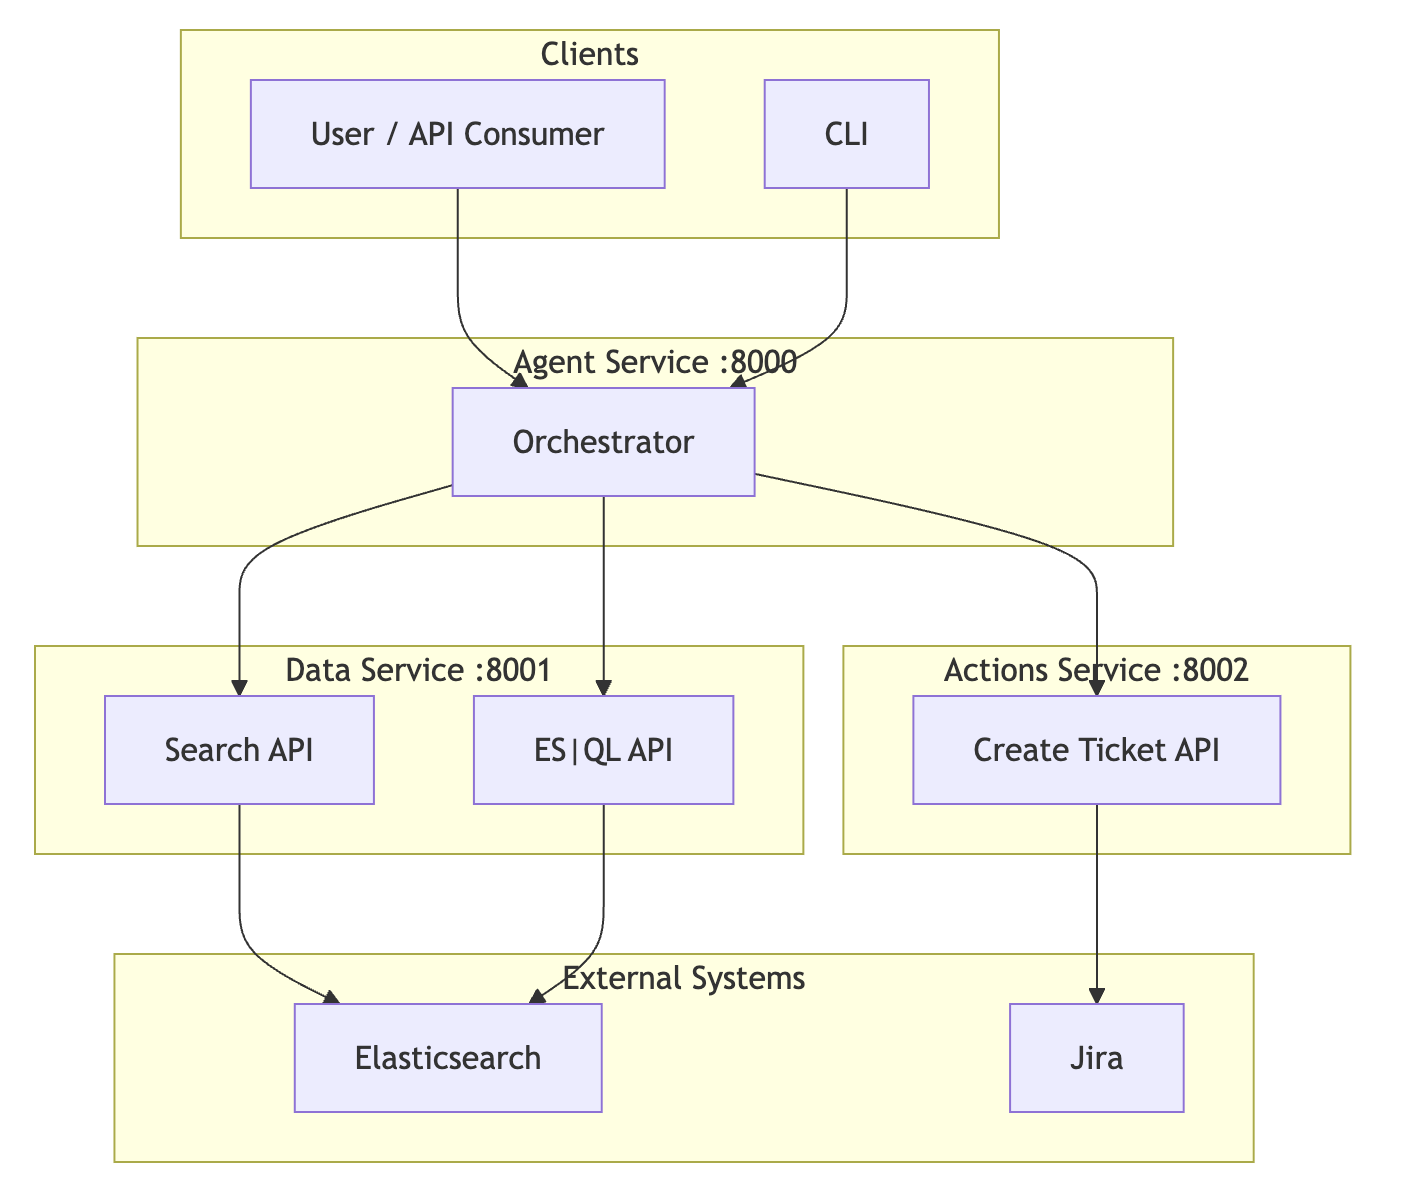
Deployment: Monolith (single process) or microservices (Agent :8000, Data :8001, Actions :8002) via Docker Compose; or monolith on Vercel. Elasticsearch can be Elastic Cloud or self-managed; we support both URL+API key and Cloud ID.
How we built it
IROA is built using Elastic Agent Builder: we implement the agent orchestration and Agent Builder’s Search and ES|QL tools, with Elasticsearch as the system of record. See AGENT_BUILDER.md for the mapping from Agent Builder to our code.
- Stack: Python 3.x, FastAPI, Elasticsearch Python client, Typer CLI, Pydantic. Frontend: vanilla HTML/JS for the demo UI.
- Core library (
iroa/) — Agent Builder implementation:
- Tools (Agent Builder tools):
SearchTool(iroa/tools/search.py) — Elasticsearch Search overlogs-*(Agent Builder Search tool);ESQLTool(iroa/tools/esql.py) — ES|QL over logs/metrics, e.g. error-count-by-host (Agent Builder ES|QL tool). Both are time-bounded, use@timestamp, and match index patternslogs-*,metrics-*. - Agent loop (Agent Builder agent):
run_agent()iniroa/agent/runner.py— orchestrates ES|QL → Search → correlate → hypothesis → optional ticket → audit →AnalyzeResponse. This is the Agent Builder agent that uses the tools and reasons over results. - Connectors:
JiraConnectorwith ADF for descriptions; base class for adding ServiceNow, etc. - Models:
AnalyzeRequest,AnalyzeResponse,AlertPayload,Citation,ActionTaken.
- Tools (Agent Builder tools):
- Services:
- Data (8001): Search + ES|QL endpoints (expose Agent Builder tools); talks only to Elasticsearch.
- Actions (8002): Create ticket (Jira); no Elasticsearch dependency.
- Agent (8000): Agent Builder orchestrator that HTTP-calls Data and Actions, runs correlation and reasoning, serves demo UI and
POST /analyze.
- Data (8001): Search + ES|QL endpoints (expose Agent Builder tools); talks only to Elasticsearch.
- Config: Single project-root
.envviairoa/env_loader.py; all entrypoints load it regardless of cwd. - Deploy: Dockerfiles in
docker/,docker-compose.yml, Vercel (see deployment-vercel.md). - Docs: AGENT_BUILDER.md (how IROA is built with Agent Builder), SRS, architecture (Mermaid diagrams: system, 8-step agent loop, data flow), implementation (layout, tools), setup, deployment (Docker, Vercel), testing examples.
Challenges we ran into
- Aligning Search and ES|QL with real data: We had to standardize on a single time field (
@timestamp) and avoidevent.createdand other fields that weren’t in our indices; we also made Search time-bounded and put the user query in a should clause so results were relevant and within the requested window. - Jira descriptions: The Jira API required descriptions in Atlassian Document Format (ADF). We added a
_plain_text_to_adf()helper and send the ticket body as ADF to avoid 400 “Operation value must be an Atlassian Document” errors. - Elastic Cloud vs self-managed: Supporting both URL+API key and Cloud ID, and making the test-data script and all services use the same client factory, required a clear config path and upfront auth validation with clear 401 guidance (e.g. API key roles: create_index, index, write).
- Meaningful “no data” responses: When Search or ES|QL returned no hits, we refined the logic so “Unknown resource” only appears when both return 404, and added friendlier messages and index/time-range hints in the UI and docs.
Accomplishments that we're proud of
- Built with Elastic Agent Builder: IROA is built using Agent Builder as required: a multi-step agent that combines a reasoning model with Agent Builder’s Search and ES|QL tools. Our code implements the agent orchestration and both tools; see AGENT_BUILDER.md.
- One orchestrated loop: A single
POST /analyzeruns ES|QL, Search, correlation, hypothesis, optional ticket, and audit—no separate “narrator” and “auditor” pipelines. Judges and users see the full flow in one call. - Actionable outcomes: Every response includes evidence (citations) and an audit trail; when
create_ticketis true, the same run creates a Jira issue with ADF description and returns the link. - Elasticsearch-native: Search API and ES|QL are the only retrieval layer; we don’t replace Elastic with another store. Log level handling is case-insensitive in both Search and ES|QL to match real-world data.
- Production-ready shape: Monolith for quick demos, microservices for scale; Docker Compose and Vercel; API + CLI + web UI; single
.envat project root; health checks and clear error handling (e.g. Jira 502/400 with response body in audit).
What we learned
- ES|QL and Search need a shared contract: Agreeing on one time field and index patterns (
logs-*,metrics-*) and keeping query and time filters consistent across both tools avoided “0 results” and confusing behavior. - Vendor APIs are strict: Jira’s ADF requirement taught us to check API specs early and normalize payloads (e.g. plain text → ADF) in a single place so the rest of the pipeline stays simple.
- Env and config matter: Loading
.envfrom project root once and reusing it in every service and script improved reliability and made local vs Cloud and monolith vs microservices easier to reason about. - User-facing copy matters: Clear messages when no data is found (with index and time-range hints) and when ticket creation fails (with response detail in the audit) reduced support burden and made the agent feel more trustworthy.
What's next for IROA — Incident Response + Observability Agent
- LLM-backed reasoning: Add an optional LLM step (e.g. via Elastic Agent Builder or an external API) to augment the current rule-based correlation and hypothesis; keep the existing logic as fallback when the LLM is unavailable or fails.
- More ES|QL presets: Latency percentiles by service, throughput over time, and other canned queries exposed as Data service endpoints and used by the orchestrator for richer correlation.
- Additional ticketing systems: ServiceNow, PagerDuty (create/acknowledge incident), or Zendesk connectors using the same base pattern as Jira.
- Training / fine-tuning pipeline: Per the SRS, support dataset preparation from Elasticsearch (historical incidents, labeled root causes), fine-tune a model for summarization or classification, and plug it into the agent with versioning and evaluation metrics.
- Runbooks and suggested actions: Surface runbook links or “suggested next steps” in the response based on root-cause category or service, and optionally trigger Elastic Workflows for automated remediation.
Built With
- docker
- elasticagentbuilder
- elasticsearch
- es|ql
- html
- javascript
- jira
- python
- vercel

Log in or sign up for Devpost to join the conversation.